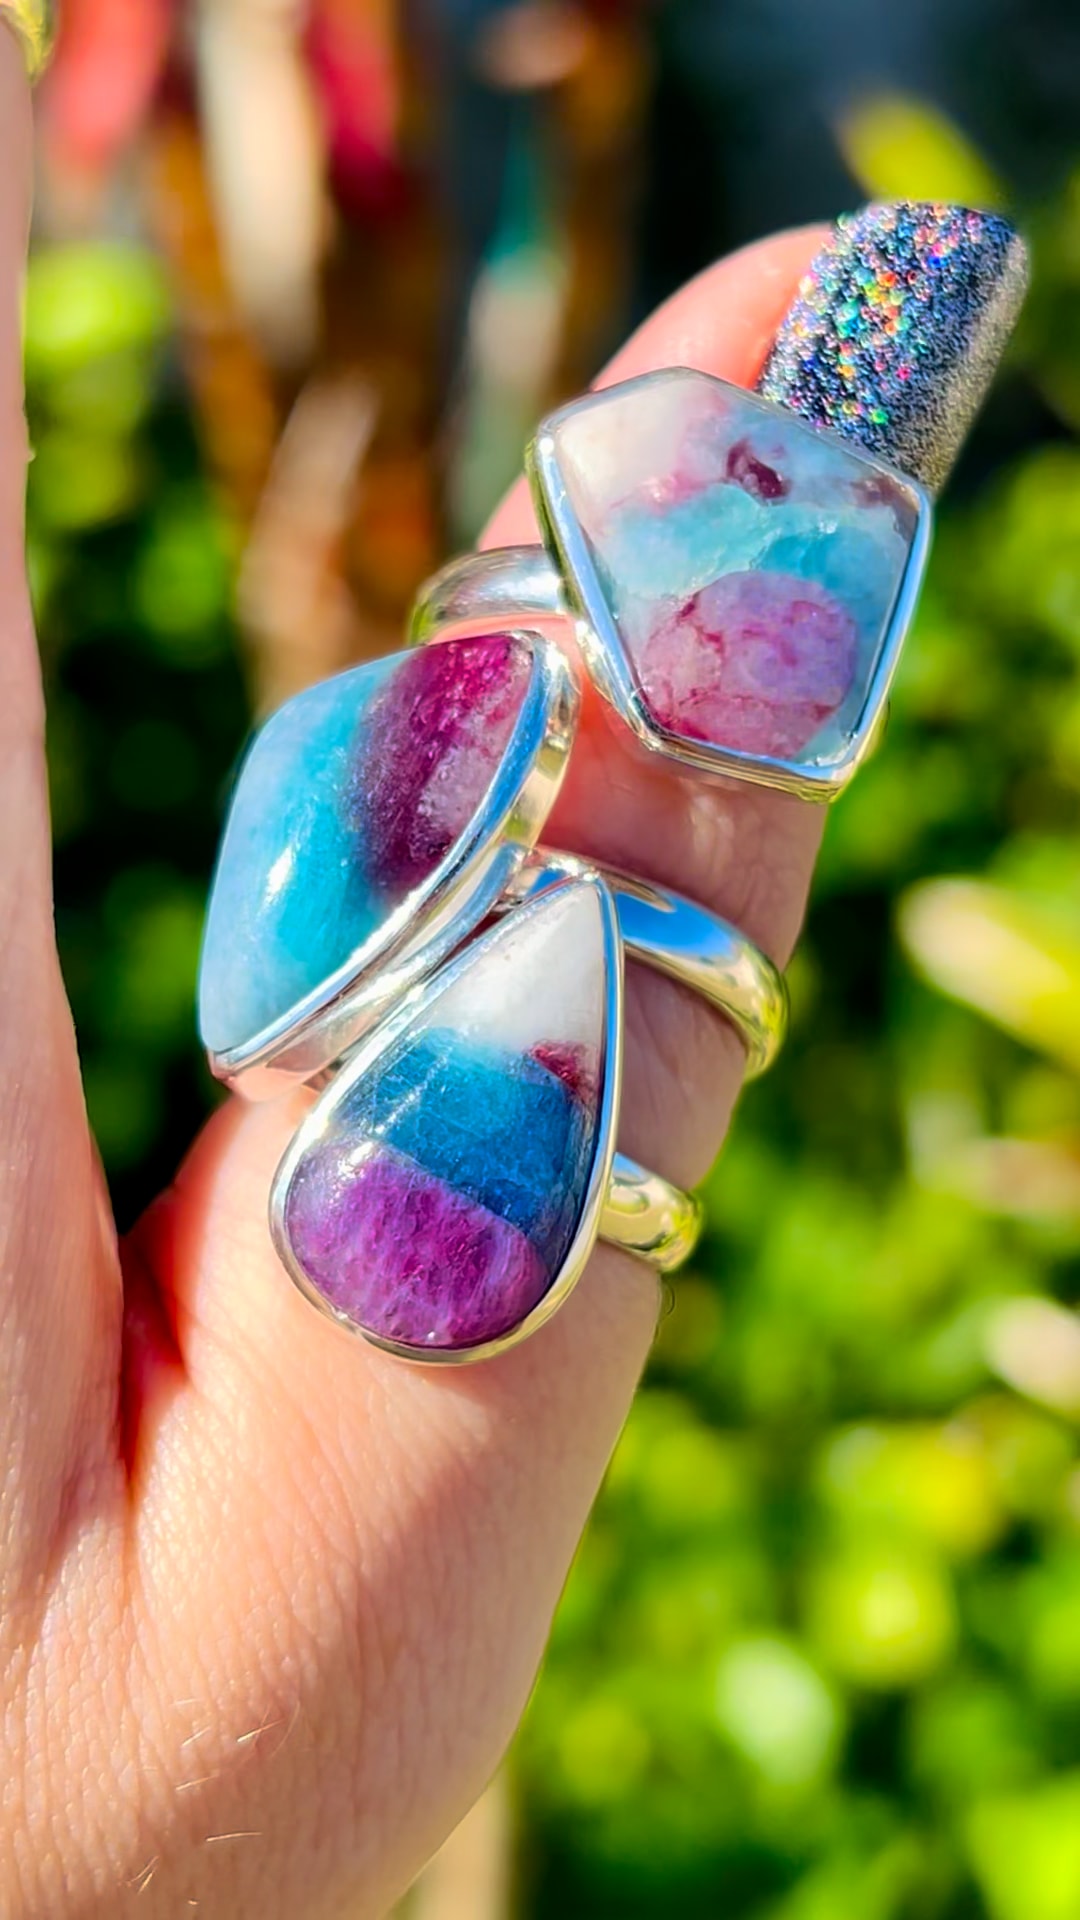
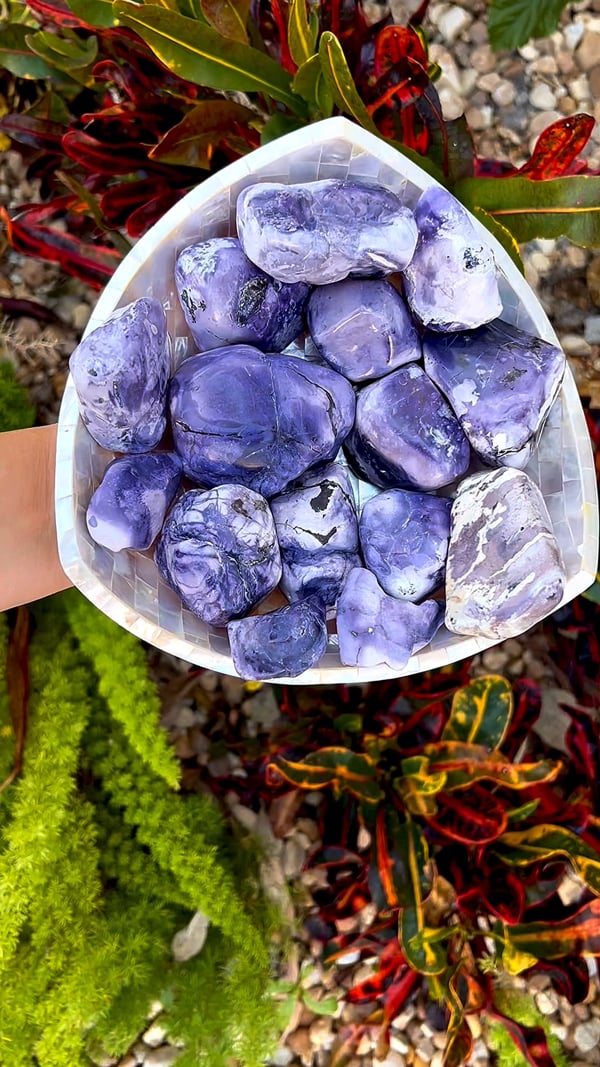
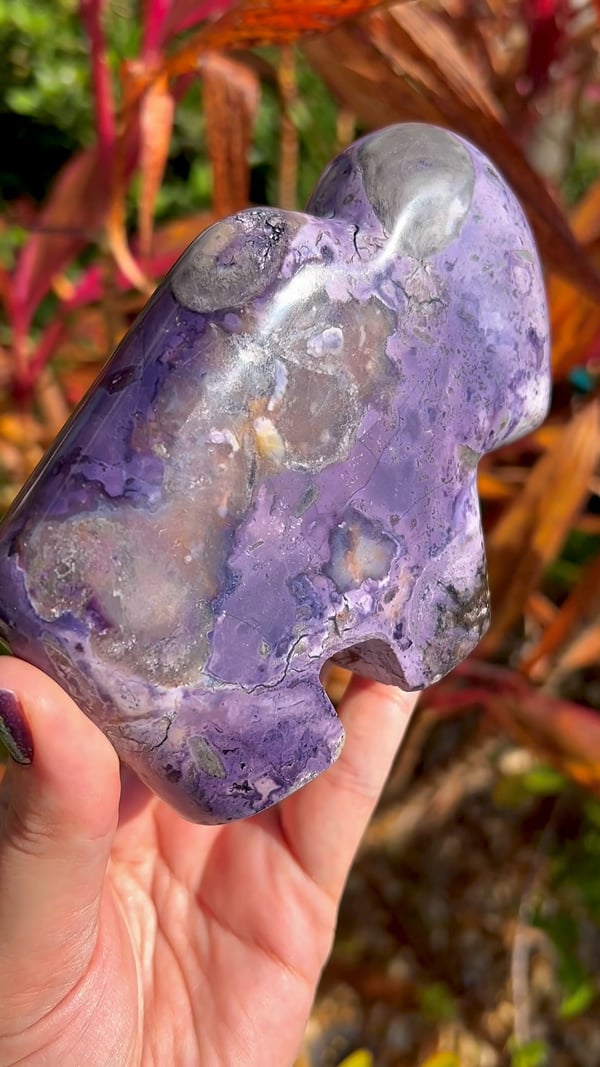
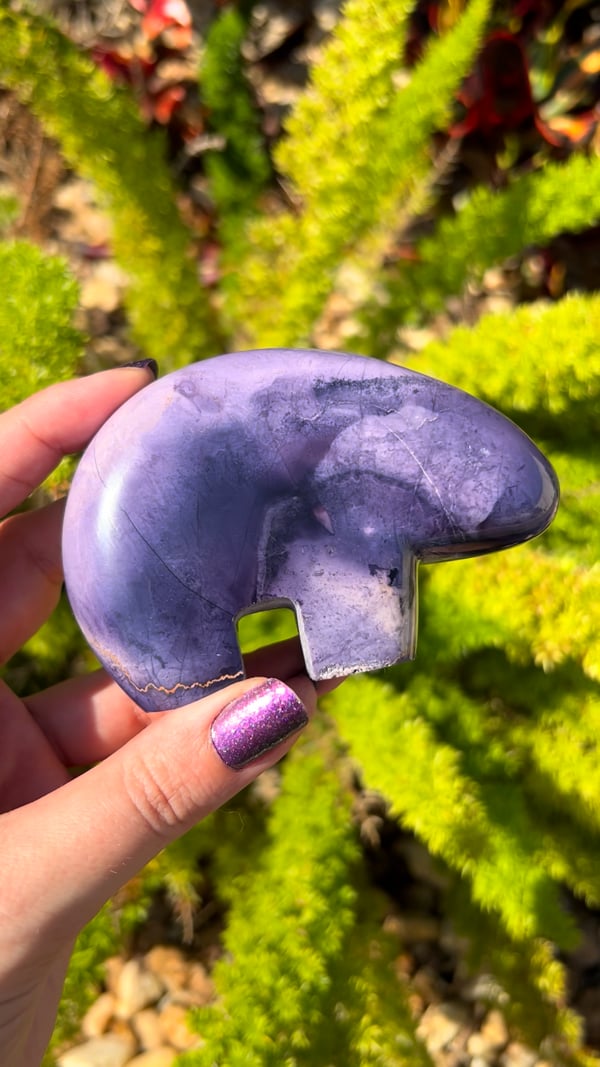
The ultimate Gem Knowledge Library, founded and hosted by Soul Body Gems. Learn what each material is, where it comes from, and its amazing history—from the Earth to your home. Explore our laboratory reports, trade-name corrections, and metaphysical traditions.
No matching Gem Knowledge entries. Try another name or term.
Azurite Blueberries is a collector nickname for rounded blue azurite nodules and crystal aggregates. The Russian examples photographed for our November 2023 collection have been cut to expose their interiors, including dark sparkling pockets and radiating or segmented patterns.
Sagenite Rutile highlights fine rutile needles arranged in a striking network. The coppery, crossing inclusions in our collection photograph make the lattice pattern the focus of the piece.
Aksumbe Turquoise is the locality name supplied for these Kazakhstan cabochons. This collection highlights turquoise from a less familiar source rather than treating all turquoise localities as interchangeable.
These Russian Azurite pieces are recorded by Soul Body Gems as old stock from the Poteryaevskoe Mine, also known as the Rubtsovsk Mine, in Altai Krai, Russia. Their deep blue color and intricate internal patterns are central to their appeal.
Amethyst Phantom celebrates Brazilian amethyst with visible outlines of earlier crystal growth inside the present crystal. These internal forms give the impression of a smaller crystal held within a larger one.
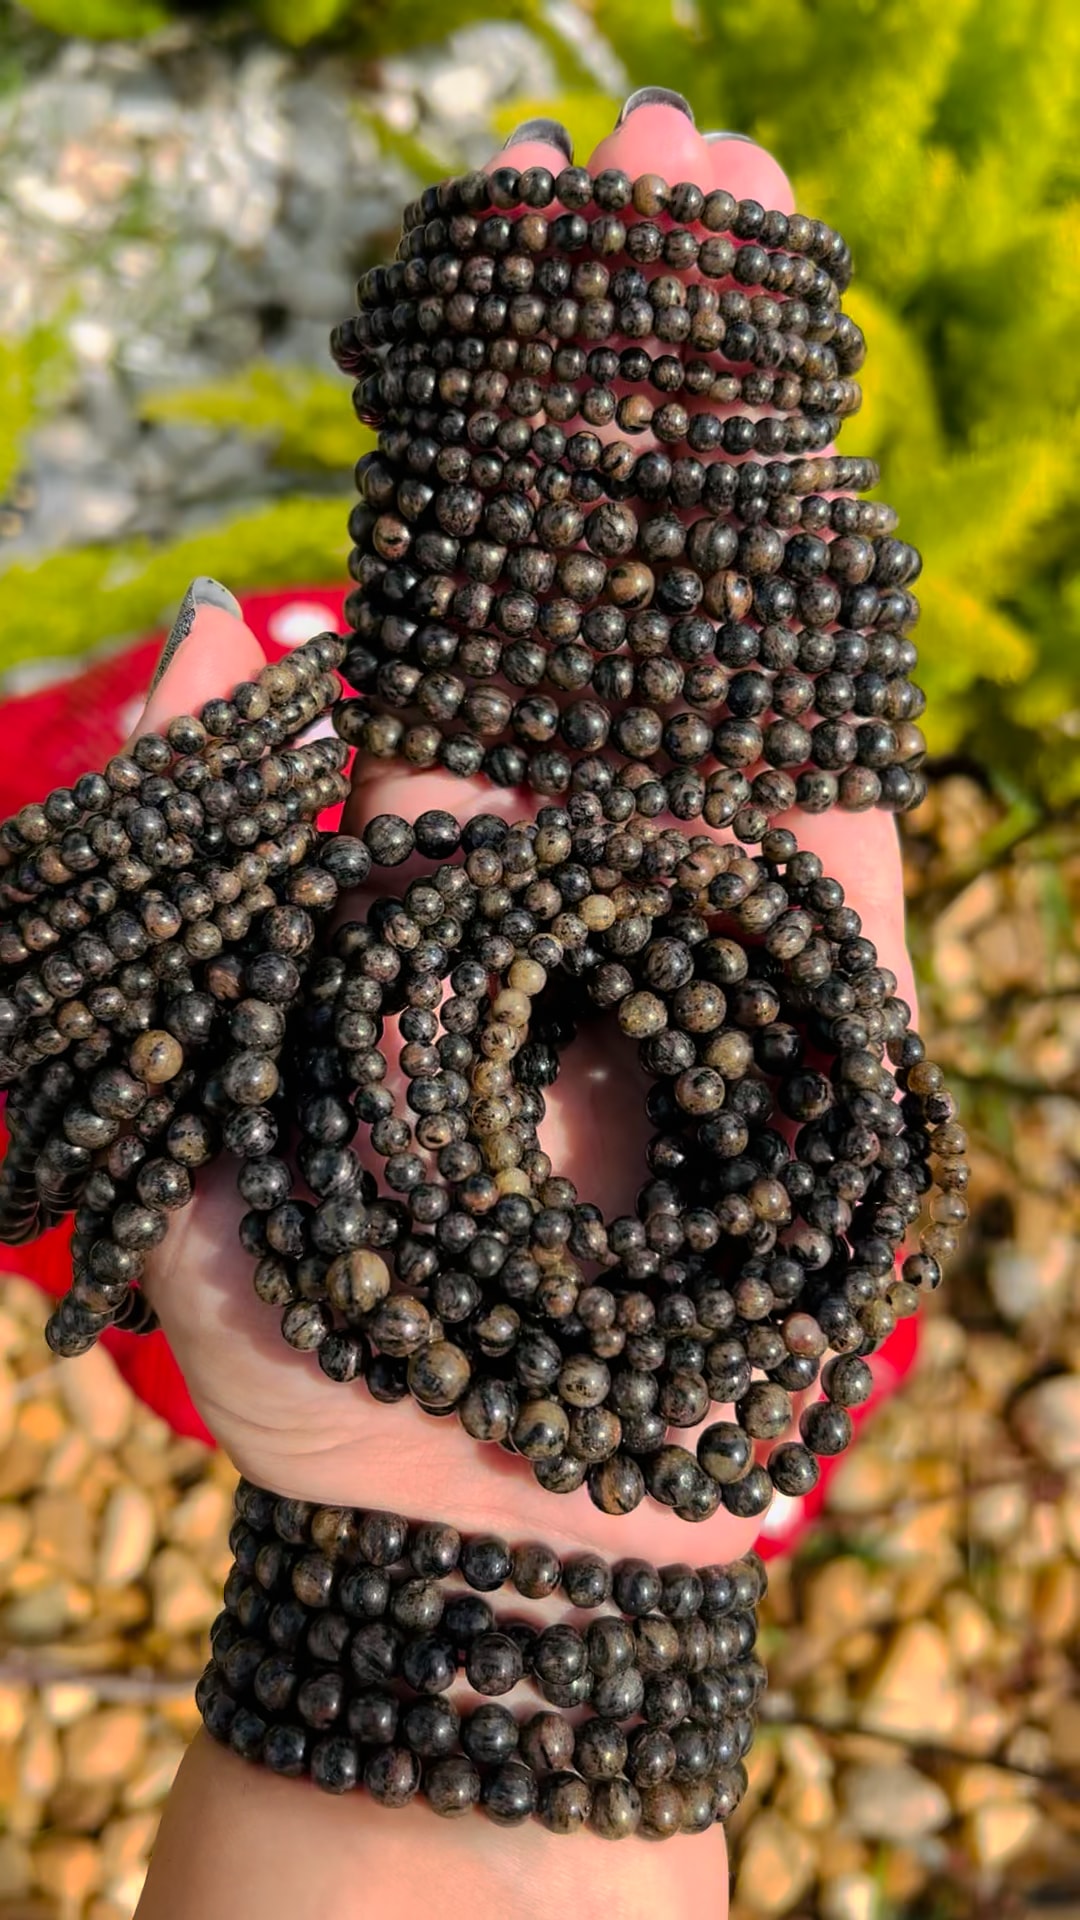
Astrophyllite is admired for bronze to golden-brown blades that can form radiating patterns. The polished towers in our April 2024 collection provide the opening image for this guide.
Blue needle-like shattuckite with reported calcite and dioptase association from the Democratic Republic of the Congo. No Soul Body Gems laboratory report.
The blue/colorless beads are mainly quartz with minor calcite and a copper-bearing carbonate, likely azurite. The blue areas lack the elements characteristic of ajoite. A separately checked green bead was identified as amazonite, a green potassium feldspar.
Blue aragonite combines soft blue-green color with the radiating fibers, bands and curved growth patterns of a carbonate mineral. This guide focuses on material circulating through the Middle Eastern and neighboring Southwest Asian mineral trade, including documented blue aragonite from Afghanistan. The collection photograph shows polished shapes.
Blue Apatite is the general collection guide for the blue apatite shown in this January photograph. It is separate from our other blue apatite locality guides and composite-material pages.
Black tourmaline from Namibia’s Erongo region is admired for its glossy surfaces, striated prisms and sharply formed terminations. Our January 2024 collection features small specimens supplied from this celebrated mineral district.
Black Sunstone (India) is a trade label used for the same material featured in our Black Aventurine guide. The April 2024 photograph is shared between these entries; the word sunstone here is a market name rather than an established feldspar identification.
Black Aventurine is the collection name for this dark, reflective material in our April 2024 photograph. It is also sold under the trade name Black Sunstone (India); both entries share the same material information and image.
Blue calcite is enjoyed for its soft blue appearance and gentle visual texture. Our April 2024 collection photograph shows old-stock spheres; old stock describes their collection history, not a measured geological age.
Blue Tiger Eye, also known as hawk’s eye, is valued for a silky band of reflected light against a blue to blue-gray background. Our April 2024 photograph records material offered under this familiar lapidary name.
Marketed as a natural Indonesian material; our preliminary report pointed to a manufactured substance, and the vendor later confirmed it was not naturally formed.
Testing identified quartz with hematite inclusions in discontinuous planar arrangements. Small amounts of iron were also detected in quartz away from the hematite.
Two separate reports identify tourmaline inclusions in quartz beads: blue, elbaite-dominant fibers in sample 1102 and darker schorl–elbaite needles in sample 1534.
The blue material was identified as chrysocolla, a copper silicate, rather than opal. Patches of iron oxide, such as goethite or hematite, were also found. The chrysocolla in this specimen is nearly amorphous.
Collawood, also written Colla Wood, is a trade name for Turkish fossil wood enriched with colorful copper minerals. The November 2023 collection photo shows a polished cross-section that brings the preserved wood structure and blue-green mineralization into view.
Copper Dolomite is the supplied collection name for these polished palms from Namibia. The guide focuses on geology and that provenance and keeps it distinct from other dolomite materials.
Campitos Turquoise is associated with Sonora in northern Mexico. Our January photograph shows this named turquoise collection set in sterling silver rings.
Celestine, also widely called celestite, is a strontium sulfate mineral appreciated for its delicate crystals. Pale blue examples are familiar to collectors, although the mineral also occurs in other colors.
Chrysoprase is a green chalcedony prized for its fresh color and polished glow. This page records the Kazakhstani material in our April 2024 collection and keeps its supplied origin separate from our other chrysoprase guides.
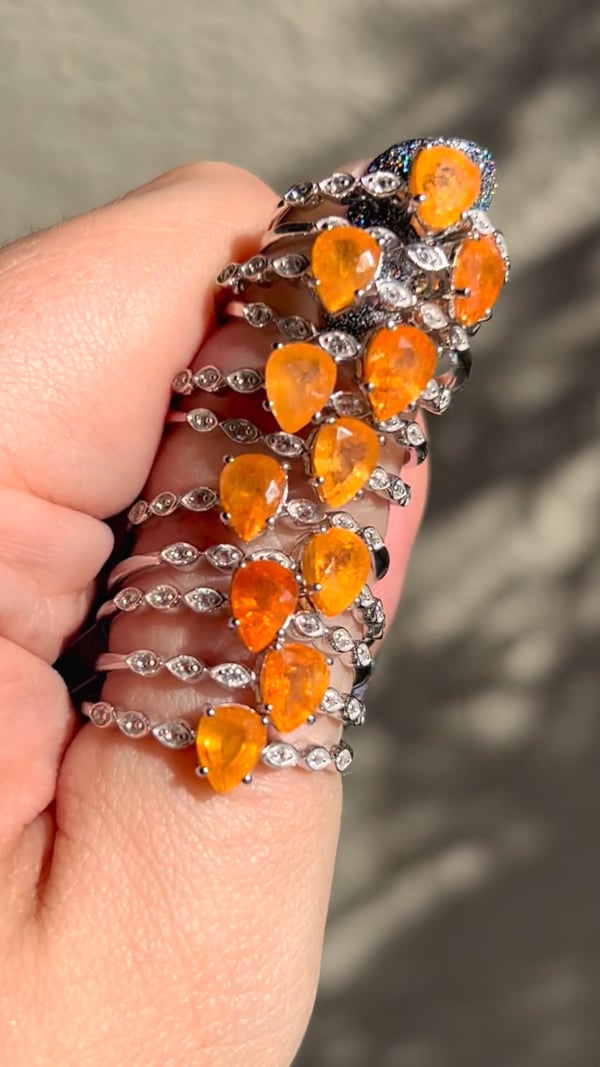
Carnelian is loved for its orange, red, and reddish-brown colors and its soft, glowing translucency. The May 2024 photograph features carnelian set in sterling silver rings.
Deep orange rutile needles enclosed in quartz. The researcher attributes the intense color mainly to a small iron content, with lesser manganese and chromium, and notes that the comparatively thick needles enhance the color.
The blue material was identified as chrysocolla, a copper silicate, rather than opal. Patches of iron oxide, such as goethite or hematite, were also found. The chrysocolla in this specimen is nearly amorphous.
The blue material was identified as chrysocolla, a copper silicate, rather than opal. Patches of iron oxide, such as goethite or hematite, were also found. The chrysocolla in this specimen is nearly amorphous.
Dreamcoat Lemurian is a trade name for colorful quartz with visible zoning, inclusions or later growth over an earlier quartz core. The November 2023 collection photograph highlights a polished point with purple, orange-red and clearer regions.
Dioptase is prized for vivid emerald-green to blue-green crystals and strong glassy luster. Our November 2023 photo shows small raw African specimens on matrix. The regional label Africa is retained; no individual mine is assigned from appearance alone.
Dendrites are branching mineral patterns that can resemble ferns, moss or tiny trees. Our Dendritic Golden Healer photograph illustrates how these delicate dark branches contrast with a golden, translucent host.
Carved crystal daggers are explored here as symbolic objects used in contemporary spiritual practice. The obsidian carvings in our collection illustrate the shape’s meaning without any association with violence.
Deerfawn Jasper is the collection name for this patterned ornamental material from India. Our May 2024 photograph shows it in adjustable sterling silver rings, where each stone brings its own arrangement of colors and markings.
The underlying mineral is genuine kyanite, but this specimen is heavily coated with blue paint. The report identified organic paint or dye and documented the coating dissolving after contact with an acetone-soaked towel. Natural mineral identity does not establish that its visible color is untreated. Dyes and surface coatings are used on a range of minerals and crystals to intensify or alter their color, and these treatments should be disclosed. This report documents a painted specimen; it does not imply that all kyanite is treated. The laboratory solvent procedure is reproduced as evidence, not as a recommendation to test jewelry or specimens at home.
Bright green epidote gives these Turkish quartz specimens their distinctive contrast and sparkling texture. Our collection locality is supplied as Şemdinli, Hakkâri Province, Turkey.
This guide covers the emerald spheres supplied from Brazil in our January collection. They are distinct from material sold as Emerald Mica or Emerald (Zimbabwe), whose shared report did not identify emerald.
Elite Shungite, also called noble shungite in the trade, is a name used for lustrous, carbon-rich material. This collection photograph shows polished pieces set in sterling silver pendants.
A descriptive comparison for the Australian ring material; laboratory analysis identified lepidolite and albite. Original Euphoralite comparison report to be added.
This yellow and blue-zoned fluorite is recorded in our collection as material from Valzergues, Aveyron, Occitanie, France. The contrast between its colored growth zones gives each specimen a distinctive visual rhythm.
Fairy Matrix Opal is a trade name that evokes small flashes of opal color scattered through a surrounding rock. The May 2024 collection labels this piece as coming from Queensland, Australia.
Also called Inner Mongolia Purple Fluorite. Testing confirms fluorite with calcite and a zeolite; the analyst favors natural formation while retaining some doubt.
Potassium feldspar, which the researcher notes could be described as orthoclase, associated with dark elbaite tourmaline containing a small liddicoatite component.
Golden Pinolite is the collection name for this Canadian material, admired for its contrasting mineral patterns. The locality name distinguishes it from other pinolite offerings without treating it as a separate mineral species.
August 2025 bracelets pictured. A separate green grossular bracelet was tested; the analyst preferred green grossular over tsavorite for that specimen.
Hermanov Spheres, also known as Heřmanov balls, are naturally layered mineral nodules from Heřmanov in the Czech Republic. A dark mica-rich center contrasts with a pale, radiating outer shell.
Isua Stone is a collection name for material supplied from Greenland, associated with a region famous for preserving very ancient rocks. Its appeal connects a tactile polished stone with the deep history of Earth’s crust.
Kakortokite is a striking, multi-mineral igneous rock associated with the Ilímaussaq complex in southern Greenland. Its pale, dark and reddish patches reflect different mineral components. It belongs to the nepheline syenite family; Kakortokite is a rock name rather than the name of a single mineral.
Geology, origin, meaning, metaphysical associations and energy traditions.
Our Pakistani kunzite collector pieces combine a soft lilac glow with impressive, elongated crystal forms. Their scale and natural faces make these examples especially compelling as display specimens.
Raw chromium-bearing chlorite material supplied from Turkey; the pictured pieces have not been individually laboratory tested. Also spelled Kämmererite.
The underlying mineral is genuine kyanite, but this specimen is heavily coated with blue paint. The report identified organic paint or dye and documented the coating dissolving after contact with an acetone-soaked towel. Natural mineral identity does not establish that its visible color is untreated. Dyes and surface coatings are used on a range of minerals and crystals to intensify or alter their color, and these treatments should be disclosed. This report documents a painted specimen; it does not imply that all kyanite is treated. The laboratory solvent procedure is reproduced as evidence, not as a recommendation to test jewelry or specimens at home.
Lemurian quartz is a modern crystal-trade name associated with quartz points bearing noticeable horizontal surface markings. Our May 2024 collection photograph records an old-stock group offered under that name.
Nundoorite, also sold as Nunderite and described in geological literature as nundorite, is an Australian ornamental rock with green crystals set in an earthy matrix. Our April 2024 collection includes wands, spheres, hearts and palms.
Finnish nuummite from Kainuu; testing found labradorite, anthophyllite, gedrite and associated minerals.
Common search spellings include nuummite, nuumite, nummite and Nuummit. These spelling variants refer to the name; Greenland and Finland remain separate locality guides.
Greenland iridescent orthoamphibole material shown in a February palm photo and later collection pieces; no report for these photographed items.
Common search spellings include nuummite, nuumite, nummite and Nuummit. These spelling variants refer to the name; Greenland and Finland remain separate locality guides.
Purple Aragonite is the supplied collection name for this January piece. Its color and form provide an appealing introduction to a mineral whose structure differs from calcite.
Petrified wood preserves the form of ancient wood through mineralization. This collection is supplied from Madagascar, with polished surfaces that reveal its visual patterns.
Polyhedral Pyrite highlights the crisp, many-faced geometry of pyrite crystals. Its metallic surfaces make the relationship between crystal growth and natural form especially easy to appreciate.
Purple scapolite brings violet color to a less familiar family of gems. This guide features the material from our April 2024 collection and keeps it distinct from our other scapolite entries.
Peanut Obsidian from Mexico is recognized by rounded reddish-orange patterns against a darker background. Our May 2024 collection shows this distinctive material carved into polished towers.
Pink tourmaline and pale albite create a vivid contrast of color and texture. The carved bowls in our May 2024 collection turn this mineral association into functional sculptural forms.
Metallic sparkle meets the warm yellow and honey tones associated with Golden Healer quartz. Our May 2024 collection shows the two textures together in a decorative specimen.
Tested gypsum. Our eight pieces faded to white, and the producing factory verbally confirmed artificial color; the laboratory left treatment unresolved.
A 2023 Brazilian find: quartz with green inclusions that the report considers likely pumpellyite-group material; polishing powder was also observed in fractures.
A zeolite-rich specimen, with stilbite-group minerals and scolecite considered the likely constituents. The researcher found more stilbite-group material than scolecite and left open the possibility of rarer zeolite species.
GIA documents needle-like ludwigite inclusions in Pakistani peridot. The cited 7.44 ct stone also contained a two-phase inclusion; it is not an SBG specimen report.
The tested sphere consists mainly of muscovite and plagioclase. The analyst considered its fine-grained texture more consistent with phyllite than schist. Iron in the muscovite was identified as the likely source of its pale green bands; no jade mineral was identified.
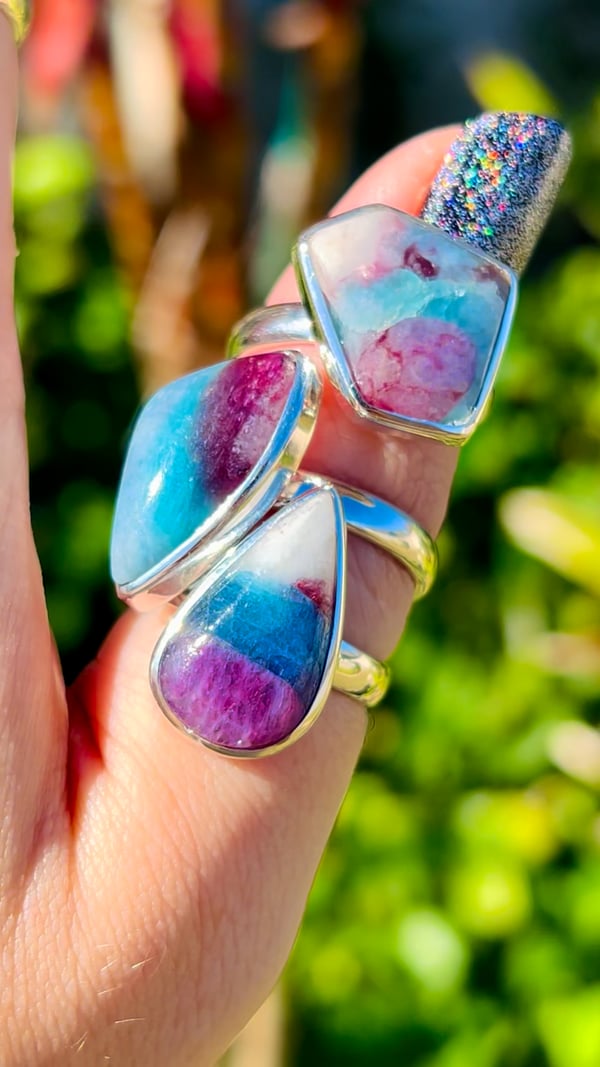
Ruby Zoisite is the collection name for jewelry combining ruby-colored areas with a contrasting green host. This guide records the name supplied for our February 2024 sterling silver rings.
Red Fox Agate is a trade name associated with Patagonian agate, also called Crater Agate in specimen collections. Its striking red areas and translucent chalcedony make the natural contrasts a central part of its appeal.
Rainbow Scapolite is the trade name used for this collection’s colorful material. This guide keeps that name distinct from the narrower mineralogical terminology needed to describe scapolite accurately.
Australian Rainforest Jasper is admired for an earthy mix of green, brown, and cream patterns. Our May 2024 collection features polished spheres that reveal the material from every direction.
Our Pakistan-sourced collection, supplied with an estimated age of around 2,000 years, with ancient glassmaking, weathered surfaces and modern jewellery.
Deep orange rutile needles enclosed in quartz. The researcher attributes the intense color mainly to a small iron content, with lesser manganese and chromium, and notes that the comparatively thick needles enhance the color.
Sagenite Rutile highlights fine rutile needles arranged in a striking network. The coppery, crossing inclusions in our collection photograph make the lattice pattern the focus of the piece.
Blue Sugilite is preserved here as the familiar trade name for the richterite material in our necklace collection. Keeping the sales name searchable helps connect the jewelry with its more precise mineral description.
A brilliant collector’s gem known for strong dispersion; this September facet appears in a mixed parcel and has not been individually laboratory tested.
Misleading market name: larvikite not identified. Report finds likely albite, astrophyllite and nepheline; also Night Shade / Arusha Confetti Sunstone.
Tiger Eye is admired for a moving band of reflected light that shifts as a polished stone is turned. Our sterling silver rings show how a curved cut brings this optical effect into jewelry.
Potassium feldspar, which the researcher notes could be described as orthoclase, associated with dark elbaite tourmaline containing a small liddicoatite component.
This Peruvian material was offered under the turquoise name. Testing of the submitted specimen instead described chrysocolla-rich domains mixed with feldspar and altered volcanic ash.
Vivianite is an iron phosphate mineral valued for its blue to green crystals and distinctive color changes. The January collection photograph introduces this material without assigning an unreported locality.
White Buffalo Turquoise is retained as a searchable trade name for the white-and-black pendant collection formerly placed under Wild Horse Jasper. The corrected placement keeps the two collection identities separate.
The tested cabochon is mainly quartz with minor clay minerals, possibly illite or sericite, and iron oxides. The iron oxides produce its delicate banding. The researcher describes a fine-grained siltstone with a clay contribution and interprets the colored bands as original bedding planes contorted before lithification. Australia is the sourcing locality supplied by Soul Body Gems. Wagyl Stone is the trade name for this material.
A banded cabochon from Western Australia, examined to understand its dark stripes and pale matrix.
Tested specimen: 9192 · Report completed: September 15, 2020
Key finding: The darker bands are rich in iron oxides, mainly hematite. The finer matrix consists of quartz and clay minerals. Iron was much more concentrated in the dark area than in the tan area.
What the report means
The report places the material near Kununurra in Western Australia and describes it as late Precambrian, around 600 million years old. A microbial contribution to the banding is presented as a possibility, not a demonstrated conclusion.
View the original test results
Select any report page to enlarge it. The pages are reproduced from the analytical report for this individual specimen.
Mineral identification is specific to the sample analyzed. The full report pages preserve the laboratory's wording and limitations.
Understanding the report figures
Use this guide alongside the written findings and the original report transcript. It explains the purpose of each analytical figure and preserves the laboratory’s own figure labels. The interpretations apply to the tested specimen; signals alone do not establish the identity of every similar-looking stone.
Elemental spectrum: The peaks record characteristic X-ray signals from elements in the analyzed spot or area. This is an analysis of that location, not automatically of the entire specimen. Any mineral identification or uncertainty named in the laboratory caption is retained below.
Laboratory figure caption: Fig. 2: Energy dispersive spectral analysis of the dark brown area in Fig. 1.
Elemental spectrum: The peaks record characteristic X-ray signals from elements in the analyzed spot or area. This is an analysis of that location, not automatically of the entire specimen. Any mineral identification or uncertainty named in the laboratory caption is retained below.
Laboratory figure caption: Fig. 2: Energy dispersive spectral analysis of the tan area in Fig. 1.
Read the report as text
This transcription makes the laboratory findings, figure captions, and table values available without opening the page images. Refer to the original images above for visual details.
Laboratory report
                                               Analytical Result Report

Sample id: 9192 (Zebra stone)
Submitted by: K.Bitner
Date submitted: Sept. 9, 2020
Date completed: Sept. 15, 2020
Operating conditions: JEOL JSM-6400 operated at 25 kV acceleration potential, 15 mm working distance, 15 degrees
sample tilt, coated with 250 Å carbon. Using the X-ray fluorescence attachment with 35kv potental in conjunction with
the EDS system.


Fig. 1: Photograph of the Zebra stone cabochon. Maximum dimension is 28 mm
Fig. 2: Energy dispersive spectral analysis of the dark brown area in Fig. 1.


Fig. 2: Energy dispersive spectral analysis of the tan area in Fig. 1.

 element                                    Dark brown area                            Tan area
 Iron                                       21.12 wt. %                                2.33 wt. %
 Titanium                                   4700 ppm                                   2800 ppm
 Zirconium                                  244 ppm                                    237 ppm
 Phosphorus                                 340 ppm                                    350 ppm
 Calcium                                    120 ppm                                    6800 ppm
 Sulfur                                     2200 ppm                                   2000 ppm


Summary of findings: This stone has a story! It comes from Western Australia near Kunnanurra. It is very late
Precambrian in age, around 600 million years old. The darker bands are rich in iron oxides, mainly hematite. The matrix
of the material is silty in grain size and finer and consists of quartz and clay minerals. Titanium, zirconium, and
phosphorus and sulfur are present in both brown and tan areas, calcium is mainly present in the tan areas. This material
may owe its striking colors to the action of life forms, microbes most likely. Bacterial mats may have precipitated the
hematite, blue-green algae may have played a role in that. Interesting note, there is a location in Jackson County,
Wisconsin, near Alma Center where a coarse sandstone is found which also has similar darker, iron-rich bands. That
material is also Precambrian, possibly a little older, but it may have a similar origin. Locally, it is called ‘Zebra sandstone’.


Date: September 15 ,2020                            Signature
Zebra Stone Palms · Soul Body Gems, February 2024.
A polished specimen sold as Moss Agate from India, investigated by electron imaging and elemental analysis.
Tested specimen: 92837 (#6) · Report completed: September 7, 2021
Key finding: The tested specimen was essentially quartz with a very small amount of finely divided chlorite group mineral. The report also found evidence that some silica may have been deposited later as opal.
What the report means
The interpretation is a hydrothermal quartz vein system with minor chlorite group minerals. The Indian locality is the collection provenance supplied by Soul Body Gems; it is not established by the chemical analysis itself.
View the original test results
Select any report page to enlarge it. The pages are reproduced from the analytical report for this individual specimen.
Mineral identification is specific to the sample analyzed. The full report pages preserve the laboratory's wording and limitations.
Understanding the report figures
Use this guide alongside the written findings and the original report transcript. It explains the purpose of each analytical figure and preserves the laboratory’s own figure labels. The interpretations apply to the tested specimen; signals alone do not establish the identity of every similar-looking stone.
Electron microscope image: This view shows small-scale regions selected for analysis. Its brightness contrast helps distinguish regions with different compositions; it is not a photograph of their natural colors. Numbered spots connect this view to the analyses listed in the report.
Laboratory figure caption: Fig. 2: Backscattered electron images of the specimen.
Elemental spectrum: The peaks record characteristic X-ray signals from elements in the analyzed spot or area. This is an analysis of that location, not automatically of the entire specimen. Any mineral identification or uncertainty named in the laboratory caption is retained below.
Laboratory figure caption: Fig. 3: Energy dispersive spectral analysis of spot 1 in Fig. 2. (quartz)
Elemental spectrum: The peaks record characteristic X-ray signals from elements in the analyzed spot or area. This is an analysis of that location, not automatically of the entire specimen. Any mineral identification or uncertainty named in the laboratory caption is retained below.
Laboratory figure caption: Fig. 4: Energy dispersive spectral analysis of spot 2 in Fig. 2. (quartz
Elemental spectrum: The peaks record characteristic X-ray signals from elements in the analyzed spot or area. This is an analysis of that location, not automatically of the entire specimen. Any mineral identification or uncertainty named in the laboratory caption is retained below.
Laboratory figure caption: Fig. 5: Energy dispersive spectral analysis of spot 3 in Fig. 2. (possibly opal with absorbed sodium chloride
Element map: This map shows where the named elements occur within the analyzed area. Its colors represent the laboratory’s selected element channels, rather than the specimen’s visible colors. The caption below preserves any color key or distribution noted by the laboratory.
This transcription makes the laboratory findings, figure captions, and table values available without opening the page images. Refer to the original images above for visual details.
Laboratory report
                                               Analytical Result Report

Sample id: 92837 (#6)
Submitted by: K. Bitner
Date submitted: Aug.2, 2021.
Date completed: Sept. 7, 2021.
Operating conditions: An AMRAY 1830 SEM operated at 25 kV acceleration potential, 26 mm working distance, 15
degrees sample tilt, coated with 250 Å carbon. Using the X-ray fluorescence attachment with 35 kV potential in
conjunction with the EDS system.


Fig. 1: Photograph of the specimen. 5.3 cm maximum dimension.


Fig. 2: Backscattered electron images of the specimen.
Fig. 3: Energy dispersive spectral analysis of spot 1 in Fig. 2. (quartz)


Fig. 4: Energy dispersive spectral analysis of spot 2 in Fig. 2. (quartz
Fig. 5: Energy dispersive spectral analysis of spot 3 in Fig. 2. (possibly opal with absorbed sodium chloride

   Na


Fig. 6: X-ray map of Fig. 2. Silicon: orange.


Table 1: Minor and trace element composition of the specimen. (in wt. %).

 Iron                                                           0.19
 Aluminum                                                       0.12
 Chlorine                                                       0.01


Summary of findings: This specimen (Fig. 1) is essentially quartz with very little and a very finely divide chlorite group
mineral. It appears to have formed in some brecciated material that was infiltrated with silica and there is evidence that
in the late stages, some of the silica was deposited as opal (Figs. 2 and 6). Since opal contains water, its average atomic
number is lower than that of quartz and in backscattered electro imaging, it will appear darker (Fig.2). Opal also can
absorb components with is evidenced n Fig. 5 where chlorine and sodium show up. Essentially, this is a specimen froma
hydrothermal quartz vein system with minor chlorite group minerals.


Date: Sept. 7, 2021                         Signature
A brown material sold as “Chocolate Opal” or “Brown Opal” was tested to see what the specimen actually contains.
Key finding: The laboratory described this tested specimen as essentially quartz with minor calcium, iron, and titanium impurities. Its brown color was attributed to trace iron. It was not identified as opal.
What the report means
The report notes grains and structures resembling ostracod shell fragments. Its suggested origin in a marine or lakeshore setting is an interpretation, not a proven locality or age. The trade name should not be taken as mineral identification.
View the original test results
Select any report page to enlarge it. The pages are reproduced from the analytical report for this individual specimen.
Mineral identification is specific to the sample analyzed. The full report pages preserve the laboratory's wording and limitations.
Understanding the report figures
Use this guide alongside the written findings and the original report transcript. It explains the purpose of each analytical figure and preserves the laboratory’s own figure labels. The interpretations apply to the tested specimen; signals alone do not establish the identity of every similar-looking stone.
Electron microscope image: This view shows small-scale regions selected for analysis. Its brightness contrast helps distinguish regions with different compositions; it is not a photograph of their natural colors. Numbered spots connect this view to the analyses listed in the report.
Laboratory figure caption: Fig. 2: Backscattered electron image of sample 7.
Elemental spectrum: The peaks record characteristic X-ray signals from elements in the analyzed spot or area. This is an analysis of that location, not automatically of the entire specimen. Any mineral identification or uncertainty named in the laboratory caption is retained below.
Laboratory figure caption: Fig. 3: Energy dispersive spectral analysis of spot 1 in Fig. 2. ()
Element map: This map shows where the named elements occur within the analyzed area. Its colors represent the laboratory’s selected element channels, rather than the specimen’s visible colors. The caption below preserves any color key or distribution noted by the laboratory.
Laboratory figure caption: Fig. 4: X-ray map of the area shown in Fig. 2. Left: Silicvon: red, Calcium green. Right: Calcium green, iron: blue.
Read the report as text
This transcription makes the laboratory findings, figure captions, and table values available without opening the page images. Refer to the original images above for visual details.
Laboratory report
                                                Analytical Result Report

Sample id: 92782 (sample 7)
Submitted by: K. Bitner
Date submitted: June 2, 2021.
Date completed: June 22, 2021.
Operating conditions: An AMRAY 1830 SEM operated at 25 kV acceleration potential, 26 mm working distance, 15
degrees sample tilt, coated with 250 Å carbon. Using the X-ray fluorescence attachment with 35kVpotental in
conjunction with the EDS system.


Fig. 1: Photograph of the specimens #7, 7 cm maximum dimension of the specimen.


Fig. 2: Backscattered electron image of sample 7.
Fig. 3: Energy dispersive spectral analysis of spot 1 in Fig. 2. ()


Fig. 4: X-ray map of the area shown in Fig. 2. Left: Silicvon: red, Calcium green. Right: Calcium green, iron: blue.


Table 1: Composition of sample 1. (in wt. %)


 Silicon                                     46.31
 Calcium                                     0.13
 Iron                                        0.22
 Titanium                                    0.03
 Barium                                      0.07
 Sodium                                      75
Fig. 5: Photomicrographs of the specimen. Width of field of left image: 5 mm, right image: 1 mm. Note in the right
image structures that resemble ostracod shell fragments (arrow).

Summary of findings: This specimen (Fig. 1) Is interesting, it is essentially composed of quartz (Figs 2-5, Table 1) with
minor impurities of calcium, iron and titanium. Texturally, it is composed of relatively large fragments of brown color
(iron in trace amounts is responsible for the color). There are sand sized grains present (Fig. 5 left) and fragments of
what looks like ostracod shall fragments (tiny shelled arthropods) (Fig. 5 right). The origin of the specimen may have
started out as relatively coarse siliceous clastic material that was deposited in a marine or lacustrine shore environment
and was eventually cemented with silica, including the ostracod shells.

.


Date: June 22, 2021                        Signature
A pink and dark patterned specimen from Peru, analyzed to distinguish its mineral components.
Key finding: Both the pastel and brighter pink portions were identified as rhodonite with some calcium substitution and very little iron substitution. The dark material was identified at least in part as the manganese sulfide alabandite, called “alabandine” in the report.
What the report means
This entry applies to the tested Peruvian specimen. Other rhodonite localities and color combinations should be considered separately.
View the original test results
Select any report page to enlarge it. The pages are reproduced from the analytical report for this individual specimen.
Mineral identification is specific to the sample analyzed. The full report pages preserve the laboratory's wording and limitations.
Understanding the report figures
Use this guide alongside the written findings and the original report transcript. It explains the purpose of each analytical figure and preserves the laboratory’s own figure labels. The interpretations apply to the tested specimen; signals alone do not establish the identity of every similar-looking stone.
Electron microscope image: This view shows small-scale regions selected for analysis. Its brightness contrast helps distinguish regions with different compositions; it is not a photograph of their natural colors. Numbered spots connect this view to the analyses listed in the report.
Laboratory figure caption: Fig 1: Backscattered electron photomicrograph of area 1 in sample 8115.
Elemental spectrum: The peaks record characteristic X-ray signals from elements in the analyzed spot or area. This is an analysis of that location, not automatically of the entire specimen. Any mineral identification or uncertainty named in the laboratory caption is retained below.
Laboratory figure caption: Fig. 2: Energy dispersive spectrum of spot 1 in Fig. 1. (rhodonite)
Elemental spectrum: The peaks record characteristic X-ray signals from elements in the analyzed spot or area. This is an analysis of that location, not automatically of the entire specimen. Any mineral identification or uncertainty named in the laboratory caption is retained below.
Laboratory figure caption: Fig. 3: Energy dispersive spectrum of spot 2 in Fig. 1. (alabandine)
Elemental spectrum: The peaks record characteristic X-ray signals from elements in the analyzed spot or area. This is an analysis of that location, not automatically of the entire specimen. Any mineral identification or uncertainty named in the laboratory caption is retained below.
Laboratory figure caption: Fig. 4: Energy dispersive spectrum of spot 3 in Fig. 1. (rhodonite)
Read the report as text
This transcription makes the laboratory findings, figure captions, and table values available without opening the page images. Refer to the original images above for visual details.
Laboratory report
                                                 Analytical Result Report

Sample id: 8115 Peru egg
Submitted by: Kathreen Bitner
Date submitted: April 10, 2020
Date completed: April 14, 2020
Operating conditions: JEOL JSM-6400 operated at 25 kV acceleration potential, 15 mm working distance, 15 degrees
sample tilt, coated with 250 Å carbon. Using the X-ray fluorescence attacement with 35kv potental in conjunction with
the EDS system


Fig 1: Backscattered electron photomicrograph of area 1 in sample 8115.


Fig. 2: Energy dispersive spectrum of spot 1 in Fig. 1. (rhodonite)
Fig. 3: Energy dispersive spectrum of spot 2 in Fig. 1. (alabandine)


Fig. 4: Energy dispersive spectrum of spot 3 in Fig. 1. (rhodonite)


Summary of findings: This is an interesting piece! Both the pastel pink and the brighter pink are rhodonite with some Ca
substitution but very little iron substitution, thus the clean pink colors. The dark material is at least in part a manganese
sulfide, alabandine! Alabandine is not that common.


Date: 4-14-2020          Signature
Key finding: The bulk of the tested specimen was quartz in a granular matrix with small cavities lined by microscopic quartz crystals. Barite was a minor, widespread accessory. The dark domains were attributed to black hydrocarbon compounds.
What the report means
“Cosmic Cheetah Jasper” is the market name used for this material. The report identifies its components in this specific heart rather than certifying every piece sold under that name.
View the original test results
Select any report page to enlarge it. The pages are reproduced from the analytical report for this individual specimen.
Mineral identification is specific to the sample analyzed. The full report pages preserve the laboratory's wording and limitations.
Understanding the report figures
Use this guide alongside the written findings and the original report transcript. It explains the purpose of each analytical figure and preserves the laboratory’s own figure labels. The interpretations apply to the tested specimen; signals alone do not establish the identity of every similar-looking stone.
Electron microscope image: This view shows small-scale regions selected for analysis. Its brightness contrast helps distinguish regions with different compositions; it is not a photograph of their natural colors. Numbered spots connect this view to the analyses listed in the report.
Laboratory figure caption: Fig 1: Backscattered electron photomicrograph of area 1 in sample 8112.
Elemental spectrum: The peaks record characteristic X-ray signals from elements in the analyzed spot or area. This is an analysis of that location, not automatically of the entire specimen. Any mineral identification or uncertainty named in the laboratory caption is retained below.
Laboratory figure caption: Fig. 2: Energy dispersive spectrum of spot 1 in Fig. 1. (Barite with some quartz interference)
Elemental spectrum: The peaks record characteristic X-ray signals from elements in the analyzed spot or area. This is an analysis of that location, not automatically of the entire specimen. Any mineral identification or uncertainty named in the laboratory caption is retained below.
Laboratory figure caption: Fig. 3: Energy dispersive spectrum of spot 2 in Fig. 1. (quartz)
Electron microscope image: This view shows small-scale regions selected for analysis. Its brightness contrast helps distinguish regions with different compositions; it is not a photograph of their natural colors. Numbered spots connect this view to the analyses listed in the report.
Laboratory figure caption: Fig 4: Backscattered electron photomicrograph of area 1 in sample 8112. Showing quarzt crystals and barite grains in the small cavity. The area of spot 1 which darker is coated with hydrocarbon!
Read the report as text
This transcription makes the laboratory findings, figure captions, and table values available without opening the page images. Refer to the original images above for visual details.
Laboratory report
                                                 Analytical Result Report

Sample id: 8112 Brazil heart
Submitted by: Kathreen Bitner
Date submitted: April 10, 2020
Date completed: April 14, 2020
Operating conditions: JEOL JSM-6400 operated at 25 kV acceleration potential, 15 mm working distance, 15 degrees
sample tilt, coated with 250 Å carbon. Using the X-ray fluorescence attacement with 35kv potental in conjunction with
the EDS system


Fig 1: Backscattered electron photomicrograph of area 1 in sample 8112.


Fig. 2: Energy dispersive spectrum of spot 1 in Fig. 1. (Barite with some quartz interference)
Fig. 3: Energy dispersive spectrum of spot 2 in Fig. 1. (quartz)


Fig 4: Backscattered electron photomicrograph of area 1 in sample 8112. Showing quarzt crystals and barite grains in
the small cavity. The area of spot 1 which darker is coated with hydrocarbon!


Summary of findings: This is an interesting sample, the bulk composition is quartz, granular matrix with small cavities
that are lined with microscopic quartz crystals. Barite is a minor but wide-spread accessory. The dark colored domains
of the specimen are due to black hydrocarbon compounds which is common in void spaces. Essentially a material like
asphalt or ‘anthraxolite’ which is seen in other locations as well, for example the Herkimer quartz locations in New York


Date: 4-14-2020          Signature
Chrysanthemum Stone: An Assembled Specimen · Soul Body Gems, February 2020.
A specimen sold as genuine Chrysanthemum Stone was tested. Its flower pattern was not naturally formed in the tested piece.
Tested specimen: 8113 · Report completed: April 14, 2020
Key finding: The laboratory concluded that grooves had been cut into a slaty rock and filled with crushed calcite or limestone to create the pattern. The report did not detect the strontium or sulfate expected for the celestite sprays used for comparison.
What the report means
This result concerns the submitted specimen, not every stone sold from China. It illustrates why appearance and a seller's label cannot establish authenticity on their own.
View the original test results
Select any report page to enlarge it. The pages are reproduced from the analytical report for this individual specimen.
Mineral identification is specific to the sample analyzed. The full report pages preserve the laboratory's wording and limitations.
Understanding the report figures
Use this guide alongside the written findings and the original report transcript. It explains the purpose of each analytical figure and preserves the laboratory’s own figure labels. The interpretations apply to the tested specimen; signals alone do not establish the identity of every similar-looking stone.
Electron microscope image: This view shows small-scale regions selected for analysis. Its brightness contrast helps distinguish regions with different compositions; it is not a photograph of their natural colors. Numbered spots connect this view to the analyses listed in the report.
Laboratory figure caption: Fig 1: Backscattered electron photomicrograph of area 1 in sample 8113.
Elemental spectrum: The peaks record characteristic X-ray signals from elements in the analyzed spot or area. This is an analysis of that location, not automatically of the entire specimen. Any mineral identification or uncertainty named in the laboratory caption is retained below.
Laboratory figure caption: Fig. 2: Energy dispersive spectrum of spot 1 in Fig. 1. (likely some clay species, smectite/chlorite groups)
Elemental spectrum: The peaks record characteristic X-ray signals from elements in the analyzed spot or area. This is an analysis of that location, not automatically of the entire specimen. Any mineral identification or uncertainty named in the laboratory caption is retained below.
Laboratory figure caption: Fig. 3: Energy dispersive spectrum of spot 2 in Fig. 1. (Feldspar group)
Elemental spectrum: The peaks record characteristic X-ray signals from elements in the analyzed spot or area. This is an analysis of that location, not automatically of the entire specimen. Any mineral identification or uncertainty named in the laboratory caption is retained below.
Laboratory figure caption: Fig. 4: Energy dispersive spectrum of spot 2 in Fig. 1. (Calcite)
Read the report as text
This transcription makes the laboratory findings, figure captions, and table values available without opening the page images. Refer to the original images above for visual details.
Laboratory report
                                                  Analytical Result Report

Sample id: 8113 chrysanthemum stone
Submitted by: Kathreen Bitner
Date submitted: April 10, 2020
Date completed: April 14, 2020
Operating conditions: JEOL JSM-6400 operated at 25 kV acceleration potential, 15 mm working distance, 15 degrees
sample tilt, coated with 250 Å carbon. Using the X-ray fluorescence attacement with 35kv potental in conjunction with
the EDS system


Fig 1: Backscattered electron photomicrograph of area 1 in sample 8113.


Fig. 2: Energy dispersive spectrum of spot 1 in Fig. 1. (likely some clay species, smectite/chlorite groups)
Fig. 3: Energy dispersive spectrum of spot 2 in Fig. 1. (Feldspar group)


Fig. 4: Energy dispersive spectrum of spot 2 in Fig. 1. (Calcite)


Fig. 5 a (left) and b (right). Photomicrographs 5 mm across (a), 0.6 mm across (b)


Summary of findings: This is not of natural origin; it is assembled from a slaty rock by cutting grooves and filling them
with crushed calcite/limestone! The rue chrysanthemum stone has radiating sprays of celestite and no strontium of
sulfate was detected in this sample. The celestite sprays are 3-dimensional, this material is not, it extends only to some
depth, enough to make it look good.


Date: 4-14-2020          Signature
Key finding: The laboratory identified chrysocolla mixed with feldspar or altered feldspar and other material consistent with altered volcanic ash. The bulk analysis found a little over 3% copper; the specimen was not pure chrysocolla.
What the report means
The report does not identify turquoise in this specimen. See the companion entry on the market name, “Turquoise” from Peru. Both entries show the same report and the same tested stone.
View the original test results
Select any report page to enlarge it. The pages are reproduced from the analytical report for this individual specimen.
Mineral identification is specific to the sample analyzed. The full report pages preserve the laboratory's wording and limitations.
Understanding the report figures
Use this guide alongside the written findings and the original report transcript. It explains the purpose of each analytical figure and preserves the laboratory’s own figure labels. The interpretations apply to the tested specimen; signals alone do not establish the identity of every similar-looking stone.
Electron microscope image: This view shows small-scale regions selected for analysis. Its brightness contrast helps distinguish regions with different compositions; it is not a photograph of their natural colors. Numbered spots connect this view to the analyses listed in the report.
Laboratory figure caption: Fig. 2: Backscattered electron image of sample 6.
Elemental spectrum: The peaks record characteristic X-ray signals from elements in the analyzed spot or area. This is an analysis of that location, not automatically of the entire specimen. Any mineral identification or uncertainty named in the laboratory caption is retained below.
Laboratory figure caption: Fig. 3: Energy dispersive spectral analysis of spot 1 in Fig. 2. (chrysocolla)
Elemental spectrum: The peaks record characteristic X-ray signals from elements in the analyzed spot or area. This is an analysis of that location, not automatically of the entire specimen. Any mineral identification or uncertainty named in the laboratory caption is retained below.
Laboratory figure caption: Fig. 4: Energy dispersive spectral analysis of spot 4 in Fig. 2. (plagioclase with some copper present)
Elemental spectrum: The peaks record characteristic X-ray signals from elements in the analyzed spot or area. This is an analysis of that location, not automatically of the entire specimen. Any mineral identification or uncertainty named in the laboratory caption is retained below.
Laboratory figure caption: Fig. 5: Energy dispersive spectral analysis of spot 3 in Fig. 2. C(hrysocolla)
Element map: This map shows where the named elements occur within the analyzed area. Its colors represent the laboratory’s selected element channels, rather than the specimen’s visible colors. The caption below preserves any color key or distribution noted by the laboratory.
Laboratory figure caption: Fig. 6: X-ray map of the area shown in Fig. 2. Left: Copper: blue, silicon: red. Right: Aluminum: yellow, silicon red.
Read the report as text
This transcription makes the laboratory findings, figure captions, and table values available without opening the page images. Refer to the original images above for visual details.
Laboratory report
                                                Analytical Result Report

Sample id: 92781 (sample 6)
Submitted by: K. Bitner
Date submitted: June 2, 2021.
Date completed: June 21, 2021.
Operating conditions: An AMRAY 1830 SEM operated at 25 kV acceleration potential, 26 mm working distance, 15
degrees sample tilt, coated with 250 Å carbon. Using the X-ray fluorescence attachment with 35kVpotental in
conjunction with the EDS system.


Fig. 1: Photograph of the specimens #6, 5 cm maximum dimension of the specimen.


Fig. 2: Backscattered electron image of sample 6.
Fig. 3: Energy dispersive spectral analysis of spot 1 in Fig. 2. (chrysocolla)


Fig. 4: Energy dispersive spectral analysis of spot 4 in Fig. 2. (plagioclase with some copper present)
Fig. 5: Energy dispersive spectral analysis of spot 3 in Fig. 2. C(hrysocolla)


Fig. 6: X-ray map of the area shown in Fig. 2. Left: Copper: blue, silicon: red. Right: Aluminum: yellow, silicon red.


Table 1: Composition of sample 1. (in wt. %)


 Silicon                                    25.22
 Aluminum                                   16.88
 Copper                                     3.22
 Calcium                                    1.11
 Iron                                       0.25
 Potassium                                  1.15
 Barium                                     0.07
 Sodium                                     75
Summary of findings: This specimen (Fig. 1) is pretty and has a story to tell. The oddly shaped grains in Figs. 2 and 6 are
likely mineralized volcanic ash shards. The embayments are typical. Compositionally, chrysocolla-rich domains are
present, mixed with feldspars or altered feldspars, typical for felsic volcanic ash. Volcanic ash is very reactive once
deposited and with moisture present, it will readily alter. This alteration can be due to weathering but also when
mineralizing fluids are present. Table 1 shows the bulk composition, only a little over 3% of copper are present in the
bulk whereas pure chrysocolla contains over 33 % copper. The specimen contains chrysocolla, but it is ‘diluted’ by
feldspars and other volcanic ash components. Most chrysocolla in the trade is not pure and contains a certain amount
of other minerals.

.


Date: June 21, 2021                        Signature
Turquoise or Chrysocolla? · Soul Body Gems, February 2024.
This Peruvian material was offered under the turquoise name. Testing of the submitted specimen instead described chrysocolla-rich domains mixed with feldspar and altered volcanic ash.
Key finding: The laboratory found chrysocolla-bearing material, with a little over 3% copper in the bulk sample. It did not identify turquoise. A blue or green color and a market label are not sufficient to establish turquoise.
What the report means
This is the same specimen and report discussed in Chrysocolla from Peru. The finding should not be generalized to all material sold as turquoise from Peru.
View the original test results
Select any report page to enlarge it. The pages are reproduced from the analytical report for this individual specimen.
Mineral identification is specific to the sample analyzed. The full report pages preserve the laboratory's wording and limitations.
Understanding the report figures
Use this guide alongside the written findings and the original report transcript. It explains the purpose of each analytical figure and preserves the laboratory’s own figure labels. The interpretations apply to the tested specimen; signals alone do not establish the identity of every similar-looking stone.
Electron microscope image: This view shows small-scale regions selected for analysis. Its brightness contrast helps distinguish regions with different compositions; it is not a photograph of their natural colors. Numbered spots connect this view to the analyses listed in the report.
Laboratory figure caption: Fig. 2: Backscattered electron image of sample 6.
Elemental spectrum: The peaks record characteristic X-ray signals from elements in the analyzed spot or area. This is an analysis of that location, not automatically of the entire specimen. Any mineral identification or uncertainty named in the laboratory caption is retained below.
Laboratory figure caption: Fig. 3: Energy dispersive spectral analysis of spot 1 in Fig. 2. (chrysocolla)
Elemental spectrum: The peaks record characteristic X-ray signals from elements in the analyzed spot or area. This is an analysis of that location, not automatically of the entire specimen. Any mineral identification or uncertainty named in the laboratory caption is retained below.
Laboratory figure caption: Fig. 4: Energy dispersive spectral analysis of spot 4 in Fig. 2. (plagioclase with some copper present)
Elemental spectrum: The peaks record characteristic X-ray signals from elements in the analyzed spot or area. This is an analysis of that location, not automatically of the entire specimen. Any mineral identification or uncertainty named in the laboratory caption is retained below.
Laboratory figure caption: Fig. 5: Energy dispersive spectral analysis of spot 3 in Fig. 2. C(hrysocolla)
Element map: This map shows where the named elements occur within the analyzed area. Its colors represent the laboratory’s selected element channels, rather than the specimen’s visible colors. The caption below preserves any color key or distribution noted by the laboratory.
Laboratory figure caption: Fig. 6: X-ray map of the area shown in Fig. 2. Left: Copper: blue, silicon: red. Right: Aluminum: yellow, silicon red.
Read the report as text
This transcription makes the laboratory findings, figure captions, and table values available without opening the page images. Refer to the original images above for visual details.
Laboratory report
                                                Analytical Result Report

Sample id: 92781 (sample 6)
Submitted by: K. Bitner
Date submitted: June 2, 2021.
Date completed: June 21, 2021.
Operating conditions: An AMRAY 1830 SEM operated at 25 kV acceleration potential, 26 mm working distance, 15
degrees sample tilt, coated with 250 Å carbon. Using the X-ray fluorescence attachment with 35kVpotental in
conjunction with the EDS system.


Fig. 1: Photograph of the specimens #6, 5 cm maximum dimension of the specimen.


Fig. 2: Backscattered electron image of sample 6.
Fig. 3: Energy dispersive spectral analysis of spot 1 in Fig. 2. (chrysocolla)


Fig. 4: Energy dispersive spectral analysis of spot 4 in Fig. 2. (plagioclase with some copper present)
Fig. 5: Energy dispersive spectral analysis of spot 3 in Fig. 2. C(hrysocolla)


Fig. 6: X-ray map of the area shown in Fig. 2. Left: Copper: blue, silicon: red. Right: Aluminum: yellow, silicon red.


Table 1: Composition of sample 1. (in wt. %)


 Silicon                                    25.22
 Aluminum                                   16.88
 Copper                                     3.22
 Calcium                                    1.11
 Iron                                       0.25
 Potassium                                  1.15
 Barium                                     0.07
 Sodium                                     75
Summary of findings: This specimen (Fig. 1) is pretty and has a story to tell. The oddly shaped grains in Figs. 2 and 6 are
likely mineralized volcanic ash shards. The embayments are typical. Compositionally, chrysocolla-rich domains are
present, mixed with feldspars or altered feldspars, typical for felsic volcanic ash. Volcanic ash is very reactive once
deposited and with moisture present, it will readily alter. This alteration can be due to weathering but also when
mineralizing fluids are present. Table 1 shows the bulk composition, only a little over 3% of copper are present in the
bulk whereas pure chrysocolla contains over 33 % copper. The specimen contains chrysocolla, but it is ‘diluted’ by
feldspars and other volcanic ash components. Most chrysocolla in the trade is not pure and contains a certain amount
of other minerals.

.


Date: June 21, 2021                        Signature
A lilac-blue variety of rose quartz was examined to investigate the color and microscopic inclusions.
Key finding: The report describes this tested specimen as a more lilac-hued rose quartz and identifies evidence consistent with tiny dumortierite particles. Solid and fluid inclusions were observed with laser scattering.
What the report means
Scattering by tiny particles is proposed as a possible cause of its more bluish hue; the report does not state that this mechanism was conclusively proven. This Blue Rose Quartz entry is separate from other rose quartz varieties in the library.
View the original test results
Select any report page to enlarge it. The pages are reproduced from the analytical report for this individual specimen.
Mineral identification is specific to the sample analyzed. The full report pages preserve the laboratory's wording and limitations.
Understanding the report figures
Use this guide alongside the written findings and the original report transcript. It explains the purpose of each analytical figure and preserves the laboratory’s own figure labels. The interpretations apply to the tested specimen; signals alone do not establish the identity of every similar-looking stone.
Electron microscope image: This view shows small-scale regions selected for analysis. Its brightness contrast helps distinguish regions with different compositions; it is not a photograph of their natural colors. Numbered spots connect this view to the analyses listed in the report.
Laboratory figure caption: Fig. 2: Backscattered electron image of sample 8.
Elemental spectrum: The peaks record characteristic X-ray signals from elements in the analyzed spot or area. This is an analysis of that location, not automatically of the entire specimen. Any mineral identification or uncertainty named in the laboratory caption is retained below.
Laboratory figure caption: Fig. 3: Energy dispersive spectral analysis of spot 1 in Fig. 2. (dumortierite)
Read the report as text
This transcription makes the laboratory findings, figure captions, and table values available without opening the page images. Refer to the original images above for visual details.
Laboratory report
                                                Analytical Result Report

Sample id: 92783 (sample 8)
Submitted by: K. Bitner
Date submitted: June 2, 2021.
Date completed: June 22, 2021.
Operating conditions: An AMRAY 1830 SEM operated at 25 kV acceleration potential, 26 mm working distance, 15
degrees sample tilt, coated with 250 Å carbon. Using the X-ray fluorescence attachment with 35kVpotental in
conjunction with the EDS system.


Fig. 1: Photograph of the specimens #8, 6.5 cm maximum dimension of the specimen.


Fig. 2: Backscattered electron image of sample 8.
Fig. 3: Energy dispersive spectral analysis of spot 1 in Fig. 2. (dumortierite)


Table 1: Trace element composition of sample 1. (in wt. %)

 Aluminum                                   0.11
 Calcium                                    0.13
 Iron                                       0.004
 Manganese                                  0.001
 Titanium                                   0.01
 Potassium                                  0.05


Fig. 4: Photomicrographs of the specimen showing scatter of a laser beam due to microscopic solid inclusions and pluid
inclusions.
Summary of findings: This specimen (Fig. 1) is a more lilac-hued rose quartz. A piece of the specimen was digested in a
hydrothermal pressure vessel in presence of dilute phosphoric acid for 3 days at 260 degrees C. The fluid recovered was
removed and the small amount of sediment was rinsed and investigated. Fig. 2 shows an example, and the composition
is shown in Fig. 3. It is possible that Raleigh scattering caused by tiny particles may be the cause of the more bluish hue
in these rose quartz specimens. The trace element composition shown in Table 1 indicates some aluminum, andiron,
which are consistent with dumortierite’s presence. Fig. 4 illustrates the presence of many solid and fluid inclusions by
the use of aa laser which shows considerable scatter.

.


Date: June 22, 2021                        Signature
Another tested example: blue and lavender bracelet
Sample 1210, completed December 24, 2024, contains both blue-patched and pink-to-lavender quartz beads. The blue material contains a high-aluminum silicate consistent with dumortierite; the pink-to-lavender beads are more manganese-rich and appear more like rose quartz. The laboratory describes dumortierite as a possible cause of the blue color, not a conclusively isolated species in every bead.
View the original report
Select a page to enlarge it. 2 pages; the findings are summarized in accessible text above.
Key finding: The tested areas showed pyrite in quartz. Reflected-light microscopy did not detect marcasite on the surfaces accessible to examination. The report expressly says marcasite elsewhere in the specimen could not be excluded.
What the report means
For the laboratory's positive identification, see Pyrite in Quartz. Both entries refer to the same sphere and the same four report pages.
View the original test results
Select any report page to enlarge it. The pages are reproduced from the analytical report for this individual specimen.
Mineral identification is specific to the sample analyzed. The full report pages preserve the laboratory's wording and limitations.
Understanding the report figures
Use this guide alongside the written findings and the original report transcript. It explains the purpose of each analytical figure and preserves the laboratory’s own figure labels. The interpretations apply to the tested specimen; signals alone do not establish the identity of every similar-looking stone.
Electron microscope image: This view shows small-scale regions selected for analysis. Its brightness contrast helps distinguish regions with different compositions; it is not a photograph of their natural colors. Numbered spots connect this view to the analyses listed in the report.
Laboratory figure caption: Fig. 2: Backscattered electron image of sample 1.
Elemental spectrum: The peaks record characteristic X-ray signals from elements in the analyzed spot or area. This is an analysis of that location, not automatically of the entire specimen. Any mineral identification or uncertainty named in the laboratory caption is retained below.
Laboratory figure caption: Fig. 3: Energy dispersive spectral analysis of spot 1 in Fig. 2. (pyrite)
Elemental spectrum: The peaks record characteristic X-ray signals from elements in the analyzed spot or area. This is an analysis of that location, not automatically of the entire specimen. Any mineral identification or uncertainty named in the laboratory caption is retained below.
Laboratory figure caption: Fig. 4: Energy dispersive spectral analysis of spot 23in Fig. 2. (quartz)
Element map: This map shows where the named elements occur within the analyzed area. Its colors represent the laboratory’s selected element channels, rather than the specimen’s visible colors. The caption below preserves any color key or distribution noted by the laboratory.
Laboratory figure caption: Fig. 5: X-ray map of the area shown in Fig. 2. Silicon: red, iron: green.
Read the report as text
This transcription makes the laboratory findings, figure captions, and table values available without opening the page images. Refer to the original images above for visual details.
Laboratory report
                                                Analytical Result Report

Sample id: 9274 (sample 1)
Submitted by: K. Bitner
Date submitted: June 2, 2021.
Date completed: June 9, 2021.
Operating conditions: An AMRAY 1830 SEM operated at 25 kV acceleration potential, 26 mm working distance, 15
degrees sample tilt, coated with 250 Å carbon. Using the X-ray fluorescence attachment with 35kVpotental in
conjunction with the EDS system.


Fig. 1: Photograph of the specimens #1, 5 cm maximum dimension of the sphere.


Fig. 2: Backscattered electron image of sample 1.
Fig. 3: Energy dispersive spectral analysis of spot 1 in Fig. 2. (pyrite)


Fig. 4: Energy dispersive spectral analysis of spot 23in Fig. 2. (quartz)
Fig. 5: X-ray map of the area shown in Fig. 2. Silicon: red, iron: green.


Fig. 6: Reflected petrographic image, crossed Nichols in 2 position, showing all sulfide grains unchanged, they are
isotropic.


Table 1: Composition of sample 1. (in wt. %)

 Quartz portion
 Silicon                                   46.45
 Phosphorus                                0.08
 Titanium                                  0.01
 Pyrite portion
 Iron                                      46.32
 Sulfur                                    53.55
 Manganese                                 0.03
 Cobalt                                    0.01


Summary of findings: This specimen (Fig. 1) Is very interesting. Pyrite in a groundmass of quartz essentially (Figs. 2-5).
Both minerals are clean, and the texture of the pyrite (Figs. 1,2 and 5) suggest that it is actually composed of
arborescent pyrite that nucleated from a common center and then formed ever coarsening branches with the coarsest
portions at the termination of pyrite growth. This is likely a rapid growth phenomenon that may have just preceded
quartz growth or growth of quartz and pyrite may have been concurrent. In Fig. 2 is some banding visible, suggesting
that at least some part of the quartz may have formed as fine-grained chalcedony, possibly infilling interstitial spaces.
Fig. 6 show a reflected light petrographic image with crossed Nichols in 2 positions. Marcasite would be anisotropic and
flash on and off during rotation of the stage whereas pyrite does not change. Hoowever, it is possible that marcasite
could also be present but it was not detected in the surfaces accessible under the microscope.


Date: June 9, 2021                       Signature
Key finding: The report identifies pyrite in a mostly quartz groundmass. It describes the pyrite texture as arborescent, with branches growing from a common center. Some quartz may have formed as fine-grained chalcedony.
October 2024 collection photograph
The photograph above shows material from a different batch than the tested sphere. Soul Body Gems identifies the photographed material as pyrite in quartz, based on its visible growth patterns. The sphere was submitted because it was being called marcasite; the laboratory identified pyrite in the examined areas. The report belongs to that sphere and is not a test of this photographed batch.
What the report means
The report did not detect marcasite on the examined surfaces, though it did not rule out marcasite elsewhere in the sphere. Read the companion Marcasite in Quartz market-name entry for that distinction.
View the original test results
Select any report page to enlarge it. The pages are reproduced from the analytical report for this individual specimen.
Mineral identification is specific to the sample analyzed. The full report pages preserve the laboratory's wording and limitations.
Understanding the report figures
Use this guide alongside the written findings and the original report transcript. It explains the purpose of each analytical figure and preserves the laboratory’s own figure labels. The interpretations apply to the tested specimen; signals alone do not establish the identity of every similar-looking stone.
Electron microscope image: This view shows small-scale regions selected for analysis. Its brightness contrast helps distinguish regions with different compositions; it is not a photograph of their natural colors. Numbered spots connect this view to the analyses listed in the report.
Laboratory figure caption: Fig. 2: Backscattered electron image of sample 1.
Elemental spectrum: The peaks record characteristic X-ray signals from elements in the analyzed spot or area. This is an analysis of that location, not automatically of the entire specimen. Any mineral identification or uncertainty named in the laboratory caption is retained below.
Laboratory figure caption: Fig. 3: Energy dispersive spectral analysis of spot 1 in Fig. 2. (pyrite)
Elemental spectrum: The peaks record characteristic X-ray signals from elements in the analyzed spot or area. This is an analysis of that location, not automatically of the entire specimen. Any mineral identification or uncertainty named in the laboratory caption is retained below.
Laboratory figure caption: Fig. 4: Energy dispersive spectral analysis of spot 23in Fig. 2. (quartz)
Element map: This map shows where the named elements occur within the analyzed area. Its colors represent the laboratory’s selected element channels, rather than the specimen’s visible colors. The caption below preserves any color key or distribution noted by the laboratory.
Laboratory figure caption: Fig. 5: X-ray map of the area shown in Fig. 2. Silicon: red, iron: green.
Read the report as text
This transcription makes the laboratory findings, figure captions, and table values available without opening the page images. Refer to the original images above for visual details.
Laboratory report
                                                Analytical Result Report

Sample id: 9274 (sample 1)
Submitted by: K. Bitner
Date submitted: June 2, 2021.
Date completed: June 9, 2021.
Operating conditions: An AMRAY 1830 SEM operated at 25 kV acceleration potential, 26 mm working distance, 15
degrees sample tilt, coated with 250 Å carbon. Using the X-ray fluorescence attachment with 35kVpotental in
conjunction with the EDS system.


Fig. 1: Photograph of the specimens #1, 5 cm maximum dimension of the sphere.


Fig. 2: Backscattered electron image of sample 1.
Fig. 3: Energy dispersive spectral analysis of spot 1 in Fig. 2. (pyrite)


Fig. 4: Energy dispersive spectral analysis of spot 23in Fig. 2. (quartz)
Fig. 5: X-ray map of the area shown in Fig. 2. Silicon: red, iron: green.


Fig. 6: Reflected petrographic image, crossed Nichols in 2 position, showing all sulfide grains unchanged, they are
isotropic.


Table 1: Composition of sample 1. (in wt. %)

 Quartz portion
 Silicon                                   46.45
 Phosphorus                                0.08
 Titanium                                  0.01
 Pyrite portion
 Iron                                      46.32
 Sulfur                                    53.55
 Manganese                                 0.03
 Cobalt                                    0.01


Summary of findings: This specimen (Fig. 1) Is very interesting. Pyrite in a groundmass of quartz essentially (Figs. 2-5).
Both minerals are clean, and the texture of the pyrite (Figs. 1,2 and 5) suggest that it is actually composed of
arborescent pyrite that nucleated from a common center and then formed ever coarsening branches with the coarsest
portions at the termination of pyrite growth. This is likely a rapid growth phenomenon that may have just preceded
quartz growth or growth of quartz and pyrite may have been concurrent. In Fig. 2 is some banding visible, suggesting
that at least some part of the quartz may have formed as fine-grained chalcedony, possibly infilling interstitial spaces.
Fig. 6 show a reflected light petrographic image with crossed Nichols in 2 positions. Marcasite would be anisotropic and
flash on and off during rotation of the stage whereas pyrite does not change. Hoowever, it is possible that marcasite
could also be present but it was not detected in the surfaces accessible under the microscope.


Date: June 9, 2021                       Signature
What forms the visible phantom layers in this Brazilian citrine specimen? The laboratory examined the inclusions along its crystal growth planes.
Tested specimen: 92849 (#9) · Report completed: March 4, 2022
Key finding: The phantoms were identified mainly as albitic plagioclase and muscovite. The report also notes a few thin rutile needles. Photomicrographs show the inclusions concentrated along earlier growth surfaces in the quartz crystal.
What are the phantom inclusions?
As the quartz grew, mineral particles became concentrated at earlier crystal surfaces. Later growth enclosed those layers, preserving the visible phantom outlines. In this specimen, the tested particles were predominantly albitic plagioclase and muscovite, with a few thin rutile needles also observed.
The report calls the sample a quartz specimen and addresses the inclusions specifically. It does not establish whether the yellow color is natural or treatment-induced, nor does it identify every inclusion in every Brazilian citrine.
View the original test results
Select any report page to enlarge it. The pages are reproduced from the analytical report for this individual specimen.
Mineral identification is specific to the sample analyzed. The full report pages preserve the laboratory's wording and limitations.
Understanding the report figures
Use this guide alongside the written findings and the original report transcript. It explains the purpose of each analytical figure and preserves the laboratory’s own figure labels. The interpretations apply to the tested specimen; signals alone do not establish the identity of every similar-looking stone.
Electron microscope image: This view shows small-scale regions selected for analysis. Its brightness contrast helps distinguish regions with different compositions; it is not a photograph of their natural colors. Numbered spots connect this view to the analyses listed in the report.
Laboratory figure caption: Fig. 2: Backscattered electron images of the specimen.
Elemental spectrum: The peaks record characteristic X-ray signals from elements in the analyzed spot or area. This is an analysis of that location, not automatically of the entire specimen. Any mineral identification or uncertainty named in the laboratory caption is retained below.
Laboratory figure caption: Fig. 3: Energy dispersive spectral analysis of spot 1 in Fig. 2. (muscovite)
Electron microscope image: This view shows small-scale regions selected for analysis. Its brightness contrast helps distinguish regions with different compositions; it is not a photograph of their natural colors. Numbered spots connect this view to the analyses listed in the report.
Laboratory figure caption: Fig. 4: Backscattered electron images of the specimen.
Elemental spectrum: The peaks record characteristic X-ray signals from elements in the analyzed spot or area. This is an analysis of that location, not automatically of the entire specimen. Any mineral identification or uncertainty named in the laboratory caption is retained below.
Laboratory figure caption: Fig. 5: Energy dispersive spectral analysis of spot 1 in Fig. 4. (plagioclase)
Read the report as text
This transcription makes the laboratory findings, figure captions, and table values available without opening the page images. Refer to the original images above for visual details.
Laboratory report
                                               Analytical Result Report

Sample id: 92849 (#9)
Submitted by: K. Bitner
Date submitted: Feb. 14, 2022.
Date completed: March 4, 2022.
Operating conditions: An AMRAY 1830 SEM operated at 25 kV acceleration potential, 26 mm working distance, 15
degrees sample tilt, coated with 250 Å carbon. Using the X-ray fluorescence attachment with 35 kV potential in
conjunction with the EDS system.


Fig. 1: Photograph of the specimen. 16.5cm maximum dimensions.


Fig. 2: Backscattered electron images of the specimen.
Fig. 3: Energy dispersive spectral analysis of spot 1 in Fig. 2. (muscovite)


Fig. 4: Backscattered electron images of the specimen.
Fig. 5: Energy dispersive spectral analysis of spot 1 in Fig. 4. (plagioclase)


Fig. 6: Photommicrograph of the inclusions. Approximately 1 mm field of view.


Table 1: Minor and trace element composition of the variscite portion of the specimen. (in wt. %).

 Aluminum                                                         0.28
 Calcium                                                          0.01
 Iron                                                             0.03
 Manganese                                                        0.02
 Potassium                                                        0.09
 Sodium                                                           0.11
 Titanium                                                         0.04
Summary of findings: This specimen (Fig. 1) an interesting quartz specimen. The phantoms are in particular of interest.
They are mainly albitic plagioclase and muscovite (Figs. 2-5). The photomicrographs (Fig. 6) show the density along
those growth planes in the crystal. A few thin rutile needles can also be discerned. The bulk composition (Table 1)
shows the key elements present in the minerals observed. And some aluminum is also needed in the structure to give
the particular color of the specimen.


Date: March 4, 2022                       Signature
Citrine Traveller Skulls · Soul Body Gems, February 2024.
A specimen sold as hackmanite was examined as a whole rock, revealing a sodalite-bearing nepheline syenite.
Tested specimen: 92838 (#8) · Report completed: September 7, 2021
Key finding: The report identifies a silica-deficient rock, sodalite syenite, containing nepheline, sodalite, a kalsilite-nepheline solid solution, and albite.
What the report means
The report characterizes the submitted rock and its mineral constituents. It does not identify the specimen as hackmanite. Read the companion Hackmanite market-name entry for why that distinction matters.
View the original test results
Both entries refer to this same tested specimen and the same analytical report. Select a page to enlarge it.
The report applies to this individual specimen. Its wording is preserved in the images.
Understanding the report figures
Use this guide alongside the written findings and the original report transcript. It explains the purpose of each analytical figure and preserves the laboratory’s own figure labels. The interpretations apply to the tested specimen; signals alone do not establish the identity of every similar-looking stone.
Electron microscope image: This view shows small-scale regions selected for analysis. Its brightness contrast helps distinguish regions with different compositions; it is not a photograph of their natural colors. Numbered spots connect this view to the analyses listed in the report.
Laboratory figure caption: Fig. 2: Backscattered electron images of the specimen.
Elemental spectrum: The peaks record characteristic X-ray signals from elements in the analyzed spot or area. This is an analysis of that location, not automatically of the entire specimen. Any mineral identification or uncertainty named in the laboratory caption is retained below.
Laboratory figure caption: Fig. 3: Energy dispersive spectral analysis of spot 1 in Fig. 2. (nepheline)
Elemental spectrum: The peaks record characteristic X-ray signals from elements in the analyzed spot or area. This is an analysis of that location, not automatically of the entire specimen. Any mineral identification or uncertainty named in the laboratory caption is retained below.
Laboratory figure caption: Fig. 4: Energy dispersive spectral analysis of spot 3 in Fig. 2. (sodalite)
Elemental spectrum: The peaks record characteristic X-ray signals from elements in the analyzed spot or area. This is an analysis of that location, not automatically of the entire specimen. Any mineral identification or uncertainty named in the laboratory caption is retained below.
Laboratory figure caption: Fig. 5: Energy dispersive spectral analysis of spot 5 in Fig. 2. (kalsilite/sodalite solid solution)
Elemental spectrum: The peaks record characteristic X-ray signals from elements in the analyzed spot or area. This is an analysis of that location, not automatically of the entire specimen. Any mineral identification or uncertainty named in the laboratory caption is retained below.
Laboratory figure caption: Fig. 6: Energy dispersive spectral analysis of spot 7in Fig. 2. (albite)
Element map: This map shows where the named elements occur within the analyzed area. Its colors represent the laboratory’s selected element channels, rather than the specimen’s visible colors. The caption below preserves any color key or distribution noted by the laboratory.
This transcription makes the laboratory findings, figure captions, and table values available without opening the page images. Refer to the original images above for visual details.
Laboratory report
                                               Analytical Result Report

Sample id: 92838 (#8)
Submitted by: K. Bitner
Date submitted: Aug.2, 2021.
Date completed: Sept. 7, 2021.
Operating conditions: An AMRAY 1830 SEM operated at 25 kV acceleration potential, 26 mm working distance, 15
degrees sample tilt, coated with 250 Å carbon. Using the X-ray fluorescence attachment with 35 kV potential in
conjunction with the EDS system.


Fig. 1: Photograph of the specimen. 5.8 cm maximum dimension.


Fig. 2: Backscattered electron images of the specimen.
Fig. 3: Energy dispersive spectral analysis of spot 1 in Fig. 2. (nepheline)


Fig. 4: Energy dispersive spectral analysis of spot 3 in Fig. 2. (sodalite)
Fig. 5: Energy dispersive spectral analysis of spot 5 in Fig. 2. (kalsilite/sodalite solid solution)


Fig. 6: Energy dispersive spectral analysis of spot 7in Fig. 2. (albite)
Fig. 7: X-ray map of Fig. 2. Left: sodium: red, potassium: green. Right: sodium: red, potassium: green, chlorine: yellow


Table 1: Minor and trace element composition of the specimen. (in wt. %).

 Iron                                                            0.05
 Chlorine                                                        2.62
 Calcium                                                         0.54
 Strontium                                                       0.02
 Manganese                                                       0.01


Summary of findings: This specimen (Fig. 1) is a very interesting specimen: It is silica-deficient rock type called sodalite
syenite, a sodalite-bearing nepheline syenite. Note the high chlorine content (Fig. 4) which also is evident in Table 1.
These rocks are very rare and only occur in continental areas where crustal thinning occurs, just before rifting occurs.
This specimen contains nepheline (Figs. 2 and 3), sodalite (Figs. 2 and 4), kalsilite-nepheline solid solution (Figs. 2 and 5)
and albite (Figs. 2 and 6. There is some hint of foliation present (Fugs 2 and 7), this can happen already during intrusion
but could also appear later during tectonic events.


Date: Sept. 7, 2021                         Signature
This specimen was offered under the hackmanite name, but the laboratory report identifies a sodalite-bearing syenite.
Tested specimen: 92838 (#8) · Report completed: September 7, 2021
Key finding: The tested piece contains sodalite along with nepheline, a kalsilite-nepheline solid solution, and albite. The laboratory did not report an identification of hackmanite.
What the report means
Sodalite in a rock does not, by itself, substantiate a hackmanite label for the whole specimen. The report does not document a tenebrescence test or establish every property needed to assess such a claim. See Sodalite Syenite for the positive identification.
View the original test results
Both entries refer to this same tested specimen and the same analytical report. Select a page to enlarge it.
The report applies to this individual specimen. Its wording is preserved in the images.
Understanding the report figures
Use this guide alongside the written findings and the original report transcript. It explains the purpose of each analytical figure and preserves the laboratory’s own figure labels. The interpretations apply to the tested specimen; signals alone do not establish the identity of every similar-looking stone.
Electron microscope image: This view shows small-scale regions selected for analysis. Its brightness contrast helps distinguish regions with different compositions; it is not a photograph of their natural colors. Numbered spots connect this view to the analyses listed in the report.
Laboratory figure caption: Fig. 2: Backscattered electron images of the specimen.
Elemental spectrum: The peaks record characteristic X-ray signals from elements in the analyzed spot or area. This is an analysis of that location, not automatically of the entire specimen. Any mineral identification or uncertainty named in the laboratory caption is retained below.
Laboratory figure caption: Fig. 3: Energy dispersive spectral analysis of spot 1 in Fig. 2. (nepheline)
Elemental spectrum: The peaks record characteristic X-ray signals from elements in the analyzed spot or area. This is an analysis of that location, not automatically of the entire specimen. Any mineral identification or uncertainty named in the laboratory caption is retained below.
Laboratory figure caption: Fig. 4: Energy dispersive spectral analysis of spot 3 in Fig. 2. (sodalite)
Elemental spectrum: The peaks record characteristic X-ray signals from elements in the analyzed spot or area. This is an analysis of that location, not automatically of the entire specimen. Any mineral identification or uncertainty named in the laboratory caption is retained below.
Laboratory figure caption: Fig. 5: Energy dispersive spectral analysis of spot 5 in Fig. 2. (kalsilite/sodalite solid solution)
Elemental spectrum: The peaks record characteristic X-ray signals from elements in the analyzed spot or area. This is an analysis of that location, not automatically of the entire specimen. Any mineral identification or uncertainty named in the laboratory caption is retained below.
Laboratory figure caption: Fig. 6: Energy dispersive spectral analysis of spot 7in Fig. 2. (albite)
Element map: This map shows where the named elements occur within the analyzed area. Its colors represent the laboratory’s selected element channels, rather than the specimen’s visible colors. The caption below preserves any color key or distribution noted by the laboratory.
This transcription makes the laboratory findings, figure captions, and table values available without opening the page images. Refer to the original images above for visual details.
Laboratory report
                                               Analytical Result Report

Sample id: 92838 (#8)
Submitted by: K. Bitner
Date submitted: Aug.2, 2021.
Date completed: Sept. 7, 2021.
Operating conditions: An AMRAY 1830 SEM operated at 25 kV acceleration potential, 26 mm working distance, 15
degrees sample tilt, coated with 250 Å carbon. Using the X-ray fluorescence attachment with 35 kV potential in
conjunction with the EDS system.


Fig. 1: Photograph of the specimen. 5.8 cm maximum dimension.


Fig. 2: Backscattered electron images of the specimen.
Fig. 3: Energy dispersive spectral analysis of spot 1 in Fig. 2. (nepheline)


Fig. 4: Energy dispersive spectral analysis of spot 3 in Fig. 2. (sodalite)
Fig. 5: Energy dispersive spectral analysis of spot 5 in Fig. 2. (kalsilite/sodalite solid solution)


Fig. 6: Energy dispersive spectral analysis of spot 7in Fig. 2. (albite)
Fig. 7: X-ray map of Fig. 2. Left: sodium: red, potassium: green. Right: sodium: red, potassium: green, chlorine: yellow


Table 1: Minor and trace element composition of the specimen. (in wt. %).

 Iron                                                            0.05
 Chlorine                                                        2.62
 Calcium                                                         0.54
 Strontium                                                       0.02
 Manganese                                                       0.01


Summary of findings: This specimen (Fig. 1) is a very interesting specimen: It is silica-deficient rock type called sodalite
syenite, a sodalite-bearing nepheline syenite. Note the high chlorine content (Fig. 4) which also is evident in Table 1.
These rocks are very rare and only occur in continental areas where crustal thinning occurs, just before rifting occurs.
This specimen contains nepheline (Figs. 2 and 3), sodalite (Figs. 2 and 4), kalsilite-nepheline solid solution (Figs. 2 and 5)
and albite (Figs. 2 and 6. There is some hint of foliation present (Fugs 2 and 7), this can happen already during intrusion
but could also appear later during tectonic events.


Date: Sept. 7, 2021                         Signature
Two distinct amethyst specimens from the Shaangan locality in Zimbabwe were analyzed in 2021 and 2022. Their reports illuminate the crystal colors and inclusions.
2022 specimen: 92853 (#8), completed March 5, 2022. Amethyst with smoky areas; delicate inclusions identified as hematite platelets. No goethite was found in the tested specimen.
2021 specimen: 9274 (sample 3), completed June 15, 2021. Amethyst with abundant hematite stringers and plates, plus a barian anhydrite inclusion.
What gives the inclusions their appearance?
In the 2022 specimen, the report attributes red to nearly black tones to differences in the thickness of hematite platelets. The 2021 report also documents hematite, as well as the unexpected barian anhydrite inclusion. These findings belong to two separate pieces, even though both were supplied from the same locality.
The 2021 report considers a hydrothermal origin likely and discusses more than one possible geological setting. That interpretation is specific to the evidence in that report.
The laboratory reports are shown in full. Testing one piece does not establish the composition of every specimen from the locality.
Understanding the report figures
Use this guide alongside the written findings and the original report transcript. It explains the purpose of each analytical figure and preserves the laboratory’s own figure labels. The interpretations apply to the tested specimen; signals alone do not establish the identity of every similar-looking stone.
Electron microscope image: This view shows small-scale regions selected for analysis. Its brightness contrast helps distinguish regions with different compositions; it is not a photograph of their natural colors. Numbered spots connect this view to the analyses listed in the report.
Laboratory figure caption: Fig. 2: Backscattered electron images of the specimen.
Elemental spectrum: The peaks record characteristic X-ray signals from elements in the analyzed spot or area. This is an analysis of that location, not automatically of the entire specimen. Any mineral identification or uncertainty named in the laboratory caption is retained below.
Laboratory figure caption: Fig. 3: Energy dispersive spectral analysis of spot 1 in Fig. 2. (quartz)
Elemental spectrum: The peaks record characteristic X-ray signals from elements in the analyzed spot or area. This is an analysis of that location, not automatically of the entire specimen. Any mineral identification or uncertainty named in the laboratory caption is retained below.
Laboratory figure caption: Fig. 4: Energy dispersive spectral analysis of spot 1 in Fig. 4. (hematite)
Electron microscope image: This view shows small-scale regions selected for analysis. Its brightness contrast helps distinguish regions with different compositions; it is not a photograph of their natural colors. Numbered spots connect this view to the analyses listed in the report.
Laboratory figure caption: Fig. 2: Backscattered electron image of sample 3
Elemental spectrum: The peaks record characteristic X-ray signals from elements in the analyzed spot or area. This is an analysis of that location, not automatically of the entire specimen. Any mineral identification or uncertainty named in the laboratory caption is retained below.
Laboratory figure caption: Fig. 3: Energy dispersive spectral analysis of spot 1 in Fig. 2. (inclusion of barian anhydrite)
Elemental spectrum: The peaks record characteristic X-ray signals from elements in the analyzed spot or area. This is an analysis of that location, not automatically of the entire specimen. Any mineral identification or uncertainty named in the laboratory caption is retained below.
Laboratory figure caption: Fig. 4: Energy dispersive spectral analysis of spot 2 in Fig. 2. (quartz)
Elemental spectrum: The peaks record characteristic X-ray signals from elements in the analyzed spot or area. This is an analysis of that location, not automatically of the entire specimen. Any mineral identification or uncertainty named in the laboratory caption is retained below.
Laboratory figure caption: Fig. 5: Energy dispersive spectral analysis of spot 2 in Fig. 2. (quartz)
Electron microscope image: This view shows small-scale regions selected for analysis. Its brightness contrast helps distinguish regions with different compositions; it is not a photograph of their natural colors. Numbered spots connect this view to the analyses listed in the report.
Laboratory figure caption: Fig. 6: Backscattered electron image of another area of sample 3.
Elemental spectrum: The peaks record characteristic X-ray signals from elements in the analyzed spot or area. This is an analysis of that location, not automatically of the entire specimen. Any mineral identification or uncertainty named in the laboratory caption is retained below.
Laboratory figure caption: Fig. 7: Energy dispersive spectral analysis of spot 1 in Fig. 6 (hematite)
Read the reports as text
This transcription makes the laboratory findings, figure captions, and table values available without opening the page images. Refer to the original images above for visual details.
Report 1
                                               Analytical Result Report

Sample id: 92853 (#8)
Submitted by: K. Bitner
Date submitted: Feb. 14, 2022.
Date completed: March 5, 2022.
Operating conditions: An AMRAY 1830 SEM operated at 25 kV acceleration potential, 26 mm working distance, 15
degrees sample tilt, coated with 250 Å carbon. Using the X-ray fluorescence attachment with 35 kV potential in
conjunction with the EDS system.


Fig. 1: Photograph of the specimen. 5 cm maximum dimensions.


Fig. 2: Backscattered electron images of the specimen.
Fig. 3: Energy dispersive spectral analysis of spot 1 in Fig. 2. (quartz)


Fig. 4: Energy dispersive spectral analysis of spot 1 in Fig. 4. (hematite)


Fig. 5: Photommicrograph of the inclusions. Approximately 1 mm field of view in each image.
Table 1: Minor and trace element composition of the specimen. (in wt. %).

 Aluminum                                                      0.13
 Iron                                                          0.16
 Titanium                                                      0.03


Summary of findings: This specimen (Fig. 1) is very beautiful! It is amethyst Figs. 2 and 3)with smoky colored areas.
The delicate inclusions are all hematite (Figs. 2 and 4). The color from red to black is caused by greater thickness of the
hematite platelets. Many of the crystals are highly distorted and intriguing (Fig. 5). No goethite is present. The trace
elements present are consistent with the colors of the specimen. Some aluminum is required to cause the smoky color
to appear and iron in the structure is needed for the amethyst color to be generated. (Table 1)


Date: March 5, 2022                         Signature
Report 2
                                               Analytical Result Report

Sample id: 9274 (sample 3)
Submitted by: K. Bitner
Date submitted: June 2, 2021.
Date completed: June 15, 2021.
Operating conditions: An AMRAY 1830 SEM operated at 25 kV acceleration potential, 26 mm working distance, 15
degrees sample tilt, coated with 250 Å carbon. Using the X-ray fluorescence attachment with 35 kV potental in
conjunction with the EDS system.


Fig. 1: Photograph of the specimens #3, 7 cm maximum.


Fig. 2: Backscattered electron image of sample 3
Fig. 3: Energy dispersive spectral analysis of spot 1 in Fig. 2. (inclusion of barian anhydrite)


Fig. 4: Energy dispersive spectral analysis of spot 2 in Fig. 2. (quartz)
Fig. 5: Energy dispersive spectral analysis of spot 2 in Fig. 2. (quartz)


Fig. 6: Backscattered electron image of another area of sample 3.
Fig. 7: Energy dispersive spectral analysis of spot 1 in Fig. 6 (hematite)


Fig. 8: Photomicrographs of the hematite inclusions. Left: 5 mm width of view , right: 1 mm field of view.
Summary of findings: These are beautiful specimens! (Figs. 1-5). The amethyst contains about 500 ppm of iron, and
this is the cause of the amethyst color. The speckled surface seen in Fig. 2 is likely due to some contamination by
organic material. Additionally, beautiful stringers and platy crystals of hematite abound in the crystals. The inclusion of
a barian anhydrite (Figs. 2 and 3) was a surprise but I have seen that before. The crystals formed a little below the
surface in both crystals (Fig. 5) but on a broken section, one of the hematite crystals was exposed and could be analyzed
(Figs. 6 and 7). The origin is most likely hydrothermal and could have come from amethyst vesicles in mafic volcanic rock
but a pegmatitic origin is also possible, maybe even more likely. Evidence is the presence of prism faces (Fig. 1) whereas
the amethyst from the vesicles typically displays only with rhombohedral faces and only rarely are prism faces visible.


Date: June 15, 2021                        Signature
Two distinct amethyst specimens from the Shaangan locality in Zimbabwe were analyzed in 2021 and 2022. Their reports illuminate the crystal colors and inclusions.
2022 specimen: 92853 (#8), completed March 5, 2022. Amethyst with smoky areas; delicate inclusions identified as hematite platelets. No goethite was found in the tested specimen.
2021 specimen: 9274 (sample 3), completed June 15, 2021. Amethyst with abundant hematite stringers and plates, plus a barian anhydrite inclusion.
What gives the inclusions their appearance?
In the 2022 specimen, the report attributes red to nearly black tones to differences in the thickness of hematite platelets. The 2021 report also documents hematite, as well as the unexpected barian anhydrite inclusion. These findings belong to two separate pieces, even though both were supplied from the same locality.
The 2021 report considers a hydrothermal origin likely and discusses more than one possible geological setting. That interpretation is specific to the evidence in that report.
The laboratory reports are shown in full. Testing one piece does not establish the composition of every specimen from the locality.
Understanding the report figures
Use this guide alongside the written findings and the original report transcript. It explains the purpose of each analytical figure and preserves the laboratory’s own figure labels. The interpretations apply to the tested specimen; signals alone do not establish the identity of every similar-looking stone.
Electron microscope image: This view shows small-scale regions selected for analysis. Its brightness contrast helps distinguish regions with different compositions; it is not a photograph of their natural colors. Numbered spots connect this view to the analyses listed in the report.
Laboratory figure caption: Fig. 2: Backscattered electron images of the specimen.
Elemental spectrum: The peaks record characteristic X-ray signals from elements in the analyzed spot or area. This is an analysis of that location, not automatically of the entire specimen. Any mineral identification or uncertainty named in the laboratory caption is retained below.
Laboratory figure caption: Fig. 3: Energy dispersive spectral analysis of spot 1 in Fig. 2. (quartz)
Elemental spectrum: The peaks record characteristic X-ray signals from elements in the analyzed spot or area. This is an analysis of that location, not automatically of the entire specimen. Any mineral identification or uncertainty named in the laboratory caption is retained below.
Laboratory figure caption: Fig. 4: Energy dispersive spectral analysis of spot 1 in Fig. 4. (hematite)
Electron microscope image: This view shows small-scale regions selected for analysis. Its brightness contrast helps distinguish regions with different compositions; it is not a photograph of their natural colors. Numbered spots connect this view to the analyses listed in the report.
Laboratory figure caption: Fig. 2: Backscattered electron image of sample 3
Elemental spectrum: The peaks record characteristic X-ray signals from elements in the analyzed spot or area. This is an analysis of that location, not automatically of the entire specimen. Any mineral identification or uncertainty named in the laboratory caption is retained below.
Laboratory figure caption: Fig. 3: Energy dispersive spectral analysis of spot 1 in Fig. 2. (inclusion of barian anhydrite)
Elemental spectrum: The peaks record characteristic X-ray signals from elements in the analyzed spot or area. This is an analysis of that location, not automatically of the entire specimen. Any mineral identification or uncertainty named in the laboratory caption is retained below.
Laboratory figure caption: Fig. 4: Energy dispersive spectral analysis of spot 2 in Fig. 2. (quartz)
Elemental spectrum: The peaks record characteristic X-ray signals from elements in the analyzed spot or area. This is an analysis of that location, not automatically of the entire specimen. Any mineral identification or uncertainty named in the laboratory caption is retained below.
Laboratory figure caption: Fig. 5: Energy dispersive spectral analysis of spot 2 in Fig. 2. (quartz)
Electron microscope image: This view shows small-scale regions selected for analysis. Its brightness contrast helps distinguish regions with different compositions; it is not a photograph of their natural colors. Numbered spots connect this view to the analyses listed in the report.
Laboratory figure caption: Fig. 6: Backscattered electron image of another area of sample 3.
Elemental spectrum: The peaks record characteristic X-ray signals from elements in the analyzed spot or area. This is an analysis of that location, not automatically of the entire specimen. Any mineral identification or uncertainty named in the laboratory caption is retained below.
Laboratory figure caption: Fig. 7: Energy dispersive spectral analysis of spot 1 in Fig. 6 (hematite)
Read the reports as text
This transcription makes the laboratory findings, figure captions, and table values available without opening the page images. Refer to the original images above for visual details.
Report 1
                                               Analytical Result Report

Sample id: 92853 (#8)
Submitted by: K. Bitner
Date submitted: Feb. 14, 2022.
Date completed: March 5, 2022.
Operating conditions: An AMRAY 1830 SEM operated at 25 kV acceleration potential, 26 mm working distance, 15
degrees sample tilt, coated with 250 Å carbon. Using the X-ray fluorescence attachment with 35 kV potential in
conjunction with the EDS system.


Fig. 1: Photograph of the specimen. 5 cm maximum dimensions.


Fig. 2: Backscattered electron images of the specimen.
Fig. 3: Energy dispersive spectral analysis of spot 1 in Fig. 2. (quartz)


Fig. 4: Energy dispersive spectral analysis of spot 1 in Fig. 4. (hematite)


Fig. 5: Photommicrograph of the inclusions. Approximately 1 mm field of view in each image.
Table 1: Minor and trace element composition of the specimen. (in wt. %).

 Aluminum                                                      0.13
 Iron                                                          0.16
 Titanium                                                      0.03


Summary of findings: This specimen (Fig. 1) is very beautiful! It is amethyst Figs. 2 and 3)with smoky colored areas.
The delicate inclusions are all hematite (Figs. 2 and 4). The color from red to black is caused by greater thickness of the
hematite platelets. Many of the crystals are highly distorted and intriguing (Fig. 5). No goethite is present. The trace
elements present are consistent with the colors of the specimen. Some aluminum is required to cause the smoky color
to appear and iron in the structure is needed for the amethyst color to be generated. (Table 1)


Date: March 5, 2022                         Signature
Report 2
                                               Analytical Result Report

Sample id: 9274 (sample 3)
Submitted by: K. Bitner
Date submitted: June 2, 2021.
Date completed: June 15, 2021.
Operating conditions: An AMRAY 1830 SEM operated at 25 kV acceleration potential, 26 mm working distance, 15
degrees sample tilt, coated with 250 Å carbon. Using the X-ray fluorescence attachment with 35 kV potental in
conjunction with the EDS system.


Fig. 1: Photograph of the specimens #3, 7 cm maximum.


Fig. 2: Backscattered electron image of sample 3
Fig. 3: Energy dispersive spectral analysis of spot 1 in Fig. 2. (inclusion of barian anhydrite)


Fig. 4: Energy dispersive spectral analysis of spot 2 in Fig. 2. (quartz)
Fig. 5: Energy dispersive spectral analysis of spot 2 in Fig. 2. (quartz)


Fig. 6: Backscattered electron image of another area of sample 3.
Fig. 7: Energy dispersive spectral analysis of spot 1 in Fig. 6 (hematite)


Fig. 8: Photomicrographs of the hematite inclusions. Left: 5 mm width of view , right: 1 mm field of view.
Summary of findings: These are beautiful specimens! (Figs. 1-5). The amethyst contains about 500 ppm of iron, and
this is the cause of the amethyst color. The speckled surface seen in Fig. 2 is likely due to some contamination by
organic material. Additionally, beautiful stringers and platy crystals of hematite abound in the crystals. The inclusion of
a barian anhydrite (Figs. 2 and 3) was a surprise but I have seen that before. The crystals formed a little below the
surface in both crystals (Fig. 5) but on a broken section, one of the hematite crystals was exposed and could be analyzed
(Figs. 6 and 7). The origin is most likely hydrothermal and could have come from amethyst vesicles in mafic volcanic rock
but a pegmatitic origin is also possible, maybe even more likely. Evidence is the presence of prism faces (Fig. 1) whereas
the amethyst from the vesicles typically displays only with rhombohedral faces and only rarely are prism faces visible.


Date: June 15, 2021                        Signature
A Brazilian find introduced in 2020 was marketed across pink, purple, and yellow/peach varieties as “Pink Amethyst.” This report tests a yellow/peach piece from that material.
Tested specimen: 92839 (#9) · Report completed: September 7, 2021.
Key finding: The submitted yellow/peach piece was essentially quartz from a quartz-vein assemblage. The laboratory did not identify this specimen as amethyst.
What this result does and does not show
The report describes earlier opaque quartz that was broken and later invaded by hydrothermal fluids, forming coarser, clearer areas. It does not test every color variant sold under the “Pink Amethyst” label. The pink and purple pieces must be assessed on their own evidence; the yellow/peach result cannot be applied wholesale to them.
The two images preserve the laboratory's report for this tested piece. The 2020 find and market naming history were supplied by Soul Body Gems.
Understanding the report figures
Use this guide alongside the written findings and the original report transcript. It explains the purpose of each analytical figure and preserves the laboratory’s own figure labels. The interpretations apply to the tested specimen; signals alone do not establish the identity of every similar-looking stone.
Electron microscope image: This view shows small-scale regions selected for analysis. Its brightness contrast helps distinguish regions with different compositions; it is not a photograph of their natural colors. Numbered spots connect this view to the analyses listed in the report.
Laboratory figure caption: Fig. 2: Backscattered electron images of the specimen.
Elemental spectrum: The peaks record characteristic X-ray signals from elements in the analyzed spot or area. This is an analysis of that location, not automatically of the entire specimen. Any mineral identification or uncertainty named in the laboratory caption is retained below.
Laboratory figure caption: Fig. 3: Energy dispersive spectral analysis of spot 1 in Fig. 2. (quartz)
Read the report as text
This transcription makes the laboratory findings, figure captions, and table values available without opening the page images. Refer to the original images above for visual details.
Laboratory report
                                               Analytical Result Report

Sample id: 92839 (#9)
Submitted by: K. Bitner
Date submitted: Aug.2, 2021.
Date completed: Sept. 7, 2021.
Operating conditions: An AMRAY 1830 SEM operated at 25 kV acceleration potential, 26 mm working distance, 15
degrees sample tilt, coated with 250 Å carbon. Using the X-ray fluorescence attachment with 35 kV potential in
conjunction with the EDS system.


Fig. 1: Photograph of the specimen. 6 cm maximum dimension.


Fig. 2: Backscattered electron images of the specimen.
Fig. 3: Energy dispersive spectral analysis of spot 1 in Fig. 2. (quartz)


Table 1: Minor and trace element composition of the specimen. (in wt. %).

 Iron                                                             0.06
 Titanium                                                         0.11
 Calcium                                                          0.28
 Phosphorus                                                       0.02
 Sulfur                                                           0.14


Summary of findings: This specimen (Fig. 1) is cut from a quartz vein assemblage and is composed essentially of quartz
(Figs. 2 and 3 and Table 1). Some portions show coarser grain and clearer areas (lower middle to lower right in Fig. 1.
The more opaque quartz was earlier and then was brecciated and invaded with more hydrothermal fluids which formed
the coarser and clearer quartz.


Date: Sept. 7, 2021                         Signature
Tanzanite polished palms · September 2025. These are not the analyzed carving or faceted gem.
The earlier analytical results on this page apply to the submitted carving and gem, not to these polished palms.
Carving: specimen 92847 (#7), March 2, 2022. Its composition was reported as a member of the zoisite/clinozoisite group, described by the laboratory as “tanzanite,” with vanadium detected.
Faceted gem: specimen 1514, July 9, 2025. Major and minor elements indicated a zoisite/clinozoisite species; chromium and vanadium were found as typical trace elements for tanzanite. The report says the stone looked authentic.
What the tests establish
The two reports support the material identification of the individually tested carving and faceted stone. The 2022 report discusses the color after heating as a general property; it does not document a treatment determination for that individual carving. Neither report should be treated as a certificate for another stone.
Use this guide alongside the written findings and the original report transcript. It explains the purpose of each analytical figure and preserves the laboratory’s own figure labels. The interpretations apply to the tested specimen; signals alone do not establish the identity of every similar-looking stone.
Electron microscope image: This view shows small-scale regions selected for analysis. Its brightness contrast helps distinguish regions with different compositions; it is not a photograph of their natural colors. Numbered spots connect this view to the analyses listed in the report.
Laboratory figure caption: Fig. 2: Backscattered electron images of the specimen.
Elemental spectrum: The peaks record characteristic X-ray signals from elements in the analyzed spot or area. This is an analysis of that location, not automatically of the entire specimen. Any mineral identification or uncertainty named in the laboratory caption is retained below.
Laboratory figure caption: Fig. 3: Energy dispersive spectral analysis of spot 1 in Fig. 2. (zoisite/clinozoistie)
Elemental spectrum: The peaks record characteristic X-ray signals from elements in the analyzed spot or area. This is an analysis of that location, not automatically of the entire specimen. Any mineral identification or uncertainty named in the laboratory caption is retained below.
Laboratory figure caption: Fig. 4: Energy dispersive spectral analysis of spot 2 in Fig. 2. (zoisite/clinozoisite)
Electron microscope image: This view shows small-scale regions selected for analysis. Its brightness contrast helps distinguish regions with different compositions; it is not a photograph of their natural colors. Numbered spots connect this view to the analyses listed in the report.
Laboratory figure caption: Fig.2: Backscattered electron image of an area of the specimen in Fig. 1.
Elemental spectrum: The peaks record characteristic X-ray signals from elements in the analyzed spot or area. This is an analysis of that location, not automatically of the entire specimen. Any mineral identification or uncertainty named in the laboratory caption is retained below.
Laboratory figure caption: Fig. 3: Energy dispersive spectrum of spot 1 in Fig. 2. (zoisite/clinozoisite)
Read the reports as text
This transcription makes the laboratory findings, figure captions, and table values available without opening the page images. Refer to the original images above for visual details.
Report 1
                                               Analytical Result Report

Sample id: 92847 (#7)
Submitted by: K. Bitner
Date submitted: Feb. 14, 2022.
Date completed: March 2, 2022.
Operating conditions: An AMRAY 1830 SEM operated at 25 kV acceleration potential, 26 mm working distance, 15
degrees sample tilt, coated with 250 Å carbon. Using the X-ray fluorescence attachment with 35 kV potential in
conjunction with the EDS system.


Fig. 1: Photograph of the specimen. 1.2 cm maximum dimensions.


Fig. 2: Backscattered electron images of the specimen.
Fig. 3: Energy dispersive spectral analysis of spot 1 in Fig. 2. (zoisite/clinozoistie)


Fig. 4: Energy dispersive spectral analysis of spot 2 in Fig. 2. (zoisite/clinozoisite)


Table 1: Minor and trace element composition of the variscite portion of the specimen. (in wt. %).

 Chromium                                                         0.02
 Iron                                                             0.10
 Magnesium                                                        0.24
 Manganese                                                        0.03
 Titanium                                                         0.02
 Vanadium                                                         0.15
Summary of findings: This specimen (Fig. 1) is a member of the zoisite/clinozoisite group (‘tanzanite’). The vanadium is
typical for tanzanite as it imparts the typical color after heating. This is a very attractive carving, I had not seen anything
like this before.


Date: March 2, 2022                          Signature
Report 2
                                                 Analytical Result Report

Sample id: 1514 (tanzanite)
Submitted by: Soul Body Gems
Date completed: 7-9-2025
Operating conditions: An AMRAY 1830 SEM operated at 25 kV acceleration potential, 24 mm working distance, 0
degrees sample tilt, coated with 250 Å carbon, and also using the attached XRF unit operated at 30 kV.


Fig. 1: Photograph of the specimens. 1 cm maximum dimension.


Fig.2: Backscattered electron image of an area of the specimen in Fig. 1.
Fig. 3: Energy dispersive spectrum of spot 1 in Fig. 2. (zoisite/clinozoisite)


Table 1: minor and trace eleemnts in the specimen, in wt. %

 element                                    Pear-shaped
 Chromium                                   0.05
 Copper                                     0.01
 Iron                                       0.13
 Manganese                                  0.21
 Titanium                                   0.11
 Vanadium                                   0.16


Summary of findings: This specimens (Fig. 1) is very pretty. The major and minor element composition indicates a
zoisite/clinozoisite species. Trace and minor elements show chromium and vanadium being present and they are the
typical elements occurring in tanzanite. The stones looks authentic.


Date: 7-9-2025                Signature
Tanzanite Buddha Carvings · Soul Body Gems, December 2023.
An Indian Ganesha carving examined for its green mineral phases and quartz matrix.
Tested specimen: 92833 (#1) · Report completed: August 16, 2021.
Key finding: The tested piece contains quartz and a mineral in the epidote–zoisite–clinozoisite range. The report describes an intermediate iron and aluminum composition rather than assigning every area to a single end member.
Geological interpretation
Magnesium was not detected in the tested areas. The laboratory considered a skarn or calc-silicate association more likely than a greenschist product of basalt metamorphism. That is an interpretation from this specimen, not a locality determination.
The India provenance is supplied by Soul Body Gems. For a different tested specimen from another locality, see Epidote Zoisite from Peru.
Use this guide alongside the written findings and the original report transcript. It explains the purpose of each analytical figure and preserves the laboratory’s own figure labels. The interpretations apply to the tested specimen; signals alone do not establish the identity of every similar-looking stone.
Electron microscope image: This view shows small-scale regions selected for analysis. Its brightness contrast helps distinguish regions with different compositions; it is not a photograph of their natural colors. Numbered spots connect this view to the analyses listed in the report.
Laboratory figure caption: Fig. 2: Backscattered electron images of the specimen.
Elemental spectrum: The peaks record characteristic X-ray signals from elements in the analyzed spot or area. This is an analysis of that location, not automatically of the entire specimen. Any mineral identification or uncertainty named in the laboratory caption is retained below.
Laboratory figure caption: Fig. 3: Energy dispersive spectral analysis of spot 1 in Fig. 2. (epidote/clinozoisite-zoisite)
Elemental spectrum: The peaks record characteristic X-ray signals from elements in the analyzed spot or area. This is an analysis of that location, not automatically of the entire specimen. Any mineral identification or uncertainty named in the laboratory caption is retained below.
Laboratory figure caption: Fig. 4: Energy dispersive spectral analysis of spot 2 in Fig. 2. (quartz)
Element map: This map shows where the named elements occur within the analyzed area. Its colors represent the laboratory’s selected element channels, rather than the specimen’s visible colors. The caption below preserves any color key or distribution noted by the laboratory.
This transcription makes the laboratory findings, figure captions, and table values available without opening the page images. Refer to the original images above for visual details.
Laboratory report
                                               Analytical Result Report

Sample id: 92833(#1, Ganesha)
Submitted by: K. Bitner
Date submitted: Aug.2, 2021.
Date completed: Aug. 16, 2021.
Operating conditions: An AMRAY 1830 SEM operated at 25 kV acceleration potential, 26 mm working distance, 15
degrees sample tilt, coated with 250 Å carbon. Using the X-ray fluorescence attachment with 35 kV potential in
conjunction with the EDS system.


Fig. 1: Photograph of the specimen. 6 cm maximum dimension.


Fig. 2: Backscattered electron images of the specimen.
Fig. 3: Energy dispersive spectral analysis of spot 1 in Fig. 2. (epidote/clinozoisite-zoisite)


Fig. 4: Energy dispersive spectral analysis of spot 2 in Fig. 2. (quartz)
Fig. 5: X-ray map of Fig. 2. Calcium: orange, silicon: green.


Table 1: Trace and minor elements in the specimen. (in wt. %).

 Titanium                                                       0.34
 Manganese                                                      0.03
 Strontium                                                      0.10
 Chromium                                                       0.01
 Phosphorus                                                     0.01


Summary of findings: This specimen (Fig. 1) is Composed of epidote/zoisite-clinozoisite and quartz (Figs. 2-5). Table 1
displays some of the minor and trace elements.

The epidote group consists of several species which include epidote, zoisite, clinozoisite. The difference is the amount of
trivalent iron versus aluminum. This material contains a mineral in between the iron and aluminum contents. Notably,
magnesium was not detected. Thus, it appears that this is probably more skarn or calc silicate related than a greenschist
metamorphic product of basalt metamorphism.


Date: Aug. 16, 2021                         Signature
A Peruvian specimen with tan to brown crystal clusters on a quartz matrix, tested separately from the Indian Ganesha carving.
Tested specimen: 10522 (#4) · Report completed: April 18, 2024.
Key finding: The tan to brown crystals are an epidote group mineral, with X-ray diffraction best matching clinozoisite. The matrix is quartz.
Why the crystals vary in color
The report found more iron in the darker crystal terminations than in their interiors, about 3.6 versus 1.4 wt.% iron in the measured areas. It interpreted this as a somewhat stronger epidote component toward the tips.
Use this guide alongside the written findings and the original report transcript. It explains the purpose of each analytical figure and preserves the laboratory’s own figure labels. The interpretations apply to the tested specimen; signals alone do not establish the identity of every similar-looking stone.
Electron microscope image: This view shows small-scale regions selected for analysis. Its brightness contrast helps distinguish regions with different compositions; it is not a photograph of their natural colors. Numbered spots connect this view to the analyses listed in the report.
Laboratory figure caption: Fig.2: Backscattered electron image of an area of the specimen.
Elemental spectrum: The peaks record characteristic X-ray signals from elements in the analyzed spot or area. This is an analysis of that location, not automatically of the entire specimen. Any mineral identification or uncertainty named in the laboratory caption is retained below.
Laboratory figure caption: Fig. 3: Energy dispersive spectrum of spot 1 in Fig. 2 (likely epidote group)
Elemental spectrum: The peaks record characteristic X-ray signals from elements in the analyzed spot or area. This is an analysis of that location, not automatically of the entire specimen. Any mineral identification or uncertainty named in the laboratory caption is retained below.
Laboratory figure caption: Fig. 4: Energy dispersive spectrum of spot 5 in Fig. 2 (quartz)
Element map: This map shows where the named elements occur within the analyzed area. Its colors represent the laboratory’s selected element channels, rather than the specimen’s visible colors. The caption below preserves any color key or distribution noted by the laboratory.
Laboratory figure caption: Fig. 5: X-ray map of the area shown in Fig. 2. Silicon: yellow, calcium: blue
Diffraction scan: This scan helps identify crystalline minerals by comparing the measured pattern with reference patterns. The laboratory interpretation explains which minerals the comparison supports.
Laboratory figure caption: Fig. 6: X-ray diffraction scan of the epidote group mineral.
Read the report as text
This transcription makes the laboratory findings, figure captions, and table values available without opening the page images. Refer to the original images above for visual details.
Laboratory report
                                               Analytical Result Report

Sample id: 10522 (#4, April 2024
Submitted by: Soul Body Gems
Date completed: 4-18-2024
Operating conditions: An AMRAY 1830 SEM operated at 25 kV acceleration potential, 24 mm working distance, 0
degrees sample tilt, coated with 250 Å carbon, and also using the attached XRF unit operated at 30 kV.

A BRUKER SD2 Phaser X-ray diffractometer was used and operated at 30 kV and 10 mA..


Fig. 1: Photograph of the specimen. Approximately 30 mm maximum dimension.


Fig.2: Backscattered electron image of an area of the specimen.
Fig. 3: Energy dispersive spectrum of spot 1 in Fig. 2 (likely epidote group)


Fig. 4: Energy dispersive spectrum of spot 5 in Fig. 2 (quartz)
Fig. 5: X-ray map of the area shown in Fig. 2. Silicon: yellow, calcium: blue


Fig. 6: X-ray diffraction scan of the epidote group mineral.


Summary of findings: This specimen (Fig. 1) is very pretty. The tan to brown crystal clusters is an epidote group
member (Figs. 2, 3, 5, and 6). The matrix is quartz (Figs 2 and 4).

The epidote group member is relatively low in iron (Fig. 3) this is either zoisite or clinozoisite, X-ray diffraction fits are
best for clinozoisite (Fig. 6.) The terminations of the crystals (Fig. 1, note the darker color) contain a little more iron than
the interiors (3.6 versus 1.4 wt. % Fe), thus a little higher epidote component is present in the termination areas.


Date: April 18, 2024               Signature
Key finding: The material is a mixture of zoisite and quartz. X-ray diffraction confirmed zoisite, and the report supports the thulite label for this pink zoisite-bearing specimen.
What the pink material contains
The report notes around 0.1 wt.% manganese and a little over 1 wt.% iron in the tested specimen. “Thulite” denotes pink zoisite; this result belongs to the Washington specimen and should not be conflated with a future Norway thulite entry.
Use this guide alongside the written findings and the original report transcript. It explains the purpose of each analytical figure and preserves the laboratory’s own figure labels. The interpretations apply to the tested specimen; signals alone do not establish the identity of every similar-looking stone.
Electron microscope image: This view shows small-scale regions selected for analysis. Its brightness contrast helps distinguish regions with different compositions; it is not a photograph of their natural colors. Numbered spots connect this view to the analyses listed in the report.
Laboratory figure caption: Fig.2: Backscattered electron image of an area of the specimen.
Elemental spectrum: The peaks record characteristic X-ray signals from elements in the analyzed spot or area. This is an analysis of that location, not automatically of the entire specimen. Any mineral identification or uncertainty named in the laboratory caption is retained below.
Laboratory figure caption: Fig. 3: Energy dispersive spectrum of spot 1 in Fig. 2. (caclcum aluminum silicate, likely zoisite)
Elemental spectrum: The peaks record characteristic X-ray signals from elements in the analyzed spot or area. This is an analysis of that location, not automatically of the entire specimen. Any mineral identification or uncertainty named in the laboratory caption is retained below.
Laboratory figure caption: Fig. 4: Energy dispersive spectrum of spot 2 in Fig. 2. (quartz)
Diffraction scan: This scan helps identify crystalline minerals by comparing the measured pattern with reference patterns. The laboratory interpretation explains which minerals the comparison supports.
Laboratory figure caption: Fig. 5: X-ray diffraction scan of the material with overlays of reference stick patterns for zoisite and quartz.
Read the report as text
This transcription makes the laboratory findings, figure captions, and table values available without opening the page images. Refer to the original images above for visual details.
Laboratory report
                                               Analytical Result Report

Sample id: 1105 (pink tower 5)
Submitted by: Soul Body Gems
Date completed: 11-26-2024
Operating conditions: An AMRAY 1830 SEM operated at 25 kV acceleration potential, 24 mm working distance, 0
degrees sample tilt, coated with 250 Å carbon, and also using the attached XRF unit operated at 30 kV.

In addition, a Bruker D2 Phhase X-ray diffraactometer was used and operated at 30 kV and 10 mA.


Fig. 1: Photograph of the specimen. Approximately 6.5 cm maximum dimension.


Fig.2: Backscattered electron image of an area of the specimen.
Fig. 3: Energy dispersive spectrum of spot 1 in Fig. 2. (caclcum aluminum silicate, likely zoisite)


Fig. 4: Energy dispersive spectrum of spot 2 in Fig. 2. (quartz)
Fig. 5: X-ray diffraction scan of the material with overlays of reference stick patterns for zoisite and quartz.


Summary of findings: This specimen (Fig. 1) is very beautiful. Chemically, it is a mixture of a calcium aluminum silicate,
zoisite (Figs. 2 and 3) most likely and quartz (Figs. 2 and 4). X-ray diffraction confirmed zoisite for the calcium aluminum
silicate. Zoisite was confirmed by X-ray diffraction (Fig. 5). Thulite is a pink zoisite by definition. In many cases it
contains trivalent manganese that imparts a strong pink-red color. This specimen contains around 0.1 wt. % manganese
and as little over 1 wt. % iron. Thus the specimen was currently labeled.


Date: 11-26-2024                 Signature
A silica-rich volcanic specimen with a partly glassy groundmass and visible crystals.
Tested specimen: 92836 (#5) · Report completed: September 7, 2021
Key finding: The report describes a rhyolitic composition with titanium-rich magnetite, fluorite, altered biotite, likely potassium feldspar, and other accessory phases. It concludes that the specimen appears to be a phenocrystic obsidian with incipient crystallization of its glassy groundmass.
What the report means
One epidote-group phase was described as possibly close to allanite, and another iron oxide as more likely hematite. Those identifications retain the report's uncertainty. India is the provenance supplied by Soul Body Gems; the analysis itself does not establish locality. For the more specific laboratory description, see Phenocrystic Obsidian.
The images reproduce the laboratory report for the specimen named above.
Understanding the report figures
Use this guide alongside the written findings and the original report transcript. It explains the purpose of each analytical figure and preserves the laboratory’s own figure labels. The interpretations apply to the tested specimen; signals alone do not establish the identity of every similar-looking stone.
Electron microscope image: This view shows small-scale regions selected for analysis. Its brightness contrast helps distinguish regions with different compositions; it is not a photograph of their natural colors. Numbered spots connect this view to the analyses listed in the report.
Laboratory figure caption: Fig. 2: Backscattered electron images of the specimen.
Elemental spectrum: The peaks record characteristic X-ray signals from elements in the analyzed spot or area. This is an analysis of that location, not automatically of the entire specimen. Any mineral identification or uncertainty named in the laboratory caption is retained below.
Laboratory figure caption: Fig. 3: Energy dispersive spectral analysis of spot 1 in Fig. 2. (glassy matrix)
Elemental spectrum: The peaks record characteristic X-ray signals from elements in the analyzed spot or area. This is an analysis of that location, not automatically of the entire specimen. Any mineral identification or uncertainty named in the laboratory caption is retained below.
Laboratory figure caption: Fig. 4: Energy dispersive spectral analysis of spot 2 in Fig. 2. (titaniferous magnetite)
Elemental spectrum: The peaks record characteristic X-ray signals from elements in the analyzed spot or area. This is an analysis of that location, not automatically of the entire specimen. Any mineral identification or uncertainty named in the laboratory caption is retained below.
Laboratory figure caption: Fig. 5: Energy dispersive spectral analysis of spot 3 in Fig. 2. (epidote group, possibly allanite)
Elemental spectrum: The peaks record characteristic X-ray signals from elements in the analyzed spot or area. This is an analysis of that location, not automatically of the entire specimen. Any mineral identification or uncertainty named in the laboratory caption is retained below.
Laboratory figure caption: Fig. 6: Energy dispersive spectral analysis of spot 4 in Fig. 2. (fluorite)
Elemental spectrum: The peaks record characteristic X-ray signals from elements in the analyzed spot or area. This is an analysis of that location, not automatically of the entire specimen. Any mineral identification or uncertainty named in the laboratory caption is retained below.
Laboratory figure caption: Fig. 7: Energy dispersive spectral analysis of spot 5 in Fig. 2. (altered biotite)
Elemental spectrum: The peaks record characteristic X-ray signals from elements in the analyzed spot or area. This is an analysis of that location, not automatically of the entire specimen. Any mineral identification or uncertainty named in the laboratory caption is retained below.
Laboratory figure caption: Fig. 8: Energy dispersive spectral analysis of spot 6 in Fig. 2. (magnetite or hematite)
Electron microscope image: This view shows small-scale regions selected for analysis. Its brightness contrast helps distinguish regions with different compositions; it is not a photograph of their natural colors. Numbered spots connect this view to the analyses listed in the report.
Laboratory figure caption: Fig. 9: Backscattered electron images of the specimen, second area.
Elemental spectrum: The peaks record characteristic X-ray signals from elements in the analyzed spot or area. This is an analysis of that location, not automatically of the entire specimen. Any mineral identification or uncertainty named in the laboratory caption is retained below.
Laboratory figure caption: Fig. 10: Energy dispersive spectral analysis of spot 1 in Fig. 9. (potassium feldspar, likely orthoclase)
Element map: This map shows where the named elements occur within the analyzed area. Its colors represent the laboratory’s selected element channels, rather than the specimen’s visible colors. The caption below preserves any color key or distribution noted by the laboratory.
This transcription makes the laboratory findings, figure captions, and table values available without opening the page images. Refer to the original images above for visual details.
Laboratory report
                                               Analytical Result Report

Sample id: 92836(#5)
Submitted by: K. Bitner
Date submitted: Aug.2, 2021.
Date completed: Sept. 7, 2021.
Operating conditions: An AMRAY 1830 SEM operated at 25 kV acceleration potential, 26 mm working distance, 15
degrees sample tilt, coated with 250 Å carbon. Using the X-ray fluorescence attachment with 35 kV potential in
conjunction with the EDS system.


Fig. 1: Photograph of the specimen. 5.5 cm maximum dimension.


Fig. 2: Backscattered electron images of the specimen.
Fig. 3: Energy dispersive spectral analysis of spot 1 in Fig. 2. (glassy matrix)


Fig. 4: Energy dispersive spectral analysis of spot 2 in Fig. 2. (titaniferous magnetite)
Fig. 5: Energy dispersive spectral analysis of spot 3 in Fig. 2. (epidote group, possibly allanite)


Fig. 6: Energy dispersive spectral analysis of spot 4 in Fig. 2. (fluorite)
Fig. 7: Energy dispersive spectral analysis of spot 5 in Fig. 2. (altered biotite)


Fig. 8: Energy dispersive spectral analysis of spot 6 in Fig. 2. (magnetite or hematite)
Fig. 9: Backscattered electron images of the specimen, second area.


Fig. 10: Energy dispersive spectral analysis of spot 1 in Fig. 9. (potassium feldspar, likely orthoclase)


Fig. 11: X-ray map of Fig. 2. Left: sodium: red, calcium: orange,potassium: green. Right: iron: blue.
Fig. 12: Petrographic images of particles of the specimen. Left: plane polarized light, right: crossed Nichols.


Table 1: Minor and trace element composition of the specimen. (in wt. %).

 Iron                                                            0.78
 Calcium                                                         0.63
 Titanium                                                        0.05
 Manganese                                                       0.03
 Zirconium                                                       0.01


Summary of findings: This specimen (Fig. 1) is a silica-rich volcanic rock, in part glassy with a rhyolitic composition, (Figs.
2 and 3) and with phenocrysts of titanium-rich magnetite (Figs. 2 and 4), an epidote group species with rare earth
element content, a mineral close to allanite (Figs. 2 and 5), fluorite (Figs. 2 and 6), altered biotite (Figs. 2 and 7),
titanium-free magnetite or hematite, hematite is more likely since no titanium is seen and hematite does not
incorporate much titanium but magnetite does (Figs. 2 and 8) and potassium feldspar, likely orthoclase (Figs. 9 and 10).
The ground mass consists of glassy and fine-grained crystalline domains. X-ray maps (Fig. 11) show potassium
enrichment around phenocrysts. Minar and trace elements (Table 1) are typical for igneous volcanic rock close to
rhyolites or obsidian. This specimen appears to be a phenocrystic obsidian with beginning crystallization of the glassy
ground mass (Fig. 12).


Date: Sept. 7, 2021                         Signature
A silica-rich volcanic specimen with a partly glassy groundmass and visible crystals.
Tested specimen: 92836 (#5) · Report completed: September 7, 2021
Key finding: The report describes a rhyolitic composition with titanium-rich magnetite, fluorite, altered biotite, likely potassium feldspar, and other accessory phases. It concludes that the specimen appears to be a phenocrystic obsidian with incipient crystallization of its glassy groundmass.
What the report means
One epidote-group phase was described as possibly close to allanite, and another iron oxide as more likely hematite. Those identifications retain the report's uncertainty. This is the same Indian specimen listed under Obsidian (India). India is the provenance supplied by Soul Body Gems; the analysis itself does not establish locality.
The images reproduce the laboratory report for the specimen named above.
Understanding the report figures
Use this guide alongside the written findings and the original report transcript. It explains the purpose of each analytical figure and preserves the laboratory’s own figure labels. The interpretations apply to the tested specimen; signals alone do not establish the identity of every similar-looking stone.
Electron microscope image: This view shows small-scale regions selected for analysis. Its brightness contrast helps distinguish regions with different compositions; it is not a photograph of their natural colors. Numbered spots connect this view to the analyses listed in the report.
Laboratory figure caption: Fig. 2: Backscattered electron images of the specimen.
Elemental spectrum: The peaks record characteristic X-ray signals from elements in the analyzed spot or area. This is an analysis of that location, not automatically of the entire specimen. Any mineral identification or uncertainty named in the laboratory caption is retained below.
Laboratory figure caption: Fig. 3: Energy dispersive spectral analysis of spot 1 in Fig. 2. (glassy matrix)
Elemental spectrum: The peaks record characteristic X-ray signals from elements in the analyzed spot or area. This is an analysis of that location, not automatically of the entire specimen. Any mineral identification or uncertainty named in the laboratory caption is retained below.
Laboratory figure caption: Fig. 4: Energy dispersive spectral analysis of spot 2 in Fig. 2. (titaniferous magnetite)
Elemental spectrum: The peaks record characteristic X-ray signals from elements in the analyzed spot or area. This is an analysis of that location, not automatically of the entire specimen. Any mineral identification or uncertainty named in the laboratory caption is retained below.
Laboratory figure caption: Fig. 5: Energy dispersive spectral analysis of spot 3 in Fig. 2. (epidote group, possibly allanite)
Elemental spectrum: The peaks record characteristic X-ray signals from elements in the analyzed spot or area. This is an analysis of that location, not automatically of the entire specimen. Any mineral identification or uncertainty named in the laboratory caption is retained below.
Laboratory figure caption: Fig. 6: Energy dispersive spectral analysis of spot 4 in Fig. 2. (fluorite)
Elemental spectrum: The peaks record characteristic X-ray signals from elements in the analyzed spot or area. This is an analysis of that location, not automatically of the entire specimen. Any mineral identification or uncertainty named in the laboratory caption is retained below.
Laboratory figure caption: Fig. 7: Energy dispersive spectral analysis of spot 5 in Fig. 2. (altered biotite)
Elemental spectrum: The peaks record characteristic X-ray signals from elements in the analyzed spot or area. This is an analysis of that location, not automatically of the entire specimen. Any mineral identification or uncertainty named in the laboratory caption is retained below.
Laboratory figure caption: Fig. 8: Energy dispersive spectral analysis of spot 6 in Fig. 2. (magnetite or hematite)
Electron microscope image: This view shows small-scale regions selected for analysis. Its brightness contrast helps distinguish regions with different compositions; it is not a photograph of their natural colors. Numbered spots connect this view to the analyses listed in the report.
Laboratory figure caption: Fig. 9: Backscattered electron images of the specimen, second area.
Elemental spectrum: The peaks record characteristic X-ray signals from elements in the analyzed spot or area. This is an analysis of that location, not automatically of the entire specimen. Any mineral identification or uncertainty named in the laboratory caption is retained below.
Laboratory figure caption: Fig. 10: Energy dispersive spectral analysis of spot 1 in Fig. 9. (potassium feldspar, likely orthoclase)
Element map: This map shows where the named elements occur within the analyzed area. Its colors represent the laboratory’s selected element channels, rather than the specimen’s visible colors. The caption below preserves any color key or distribution noted by the laboratory.
This transcription makes the laboratory findings, figure captions, and table values available without opening the page images. Refer to the original images above for visual details.
Laboratory report
                                               Analytical Result Report

Sample id: 92836(#5)
Submitted by: K. Bitner
Date submitted: Aug.2, 2021.
Date completed: Sept. 7, 2021.
Operating conditions: An AMRAY 1830 SEM operated at 25 kV acceleration potential, 26 mm working distance, 15
degrees sample tilt, coated with 250 Å carbon. Using the X-ray fluorescence attachment with 35 kV potential in
conjunction with the EDS system.


Fig. 1: Photograph of the specimen. 5.5 cm maximum dimension.


Fig. 2: Backscattered electron images of the specimen.
Fig. 3: Energy dispersive spectral analysis of spot 1 in Fig. 2. (glassy matrix)


Fig. 4: Energy dispersive spectral analysis of spot 2 in Fig. 2. (titaniferous magnetite)
Fig. 5: Energy dispersive spectral analysis of spot 3 in Fig. 2. (epidote group, possibly allanite)


Fig. 6: Energy dispersive spectral analysis of spot 4 in Fig. 2. (fluorite)
Fig. 7: Energy dispersive spectral analysis of spot 5 in Fig. 2. (altered biotite)


Fig. 8: Energy dispersive spectral analysis of spot 6 in Fig. 2. (magnetite or hematite)
Fig. 9: Backscattered electron images of the specimen, second area.


Fig. 10: Energy dispersive spectral analysis of spot 1 in Fig. 9. (potassium feldspar, likely orthoclase)


Fig. 11: X-ray map of Fig. 2. Left: sodium: red, calcium: orange,potassium: green. Right: iron: blue.
Fig. 12: Petrographic images of particles of the specimen. Left: plane polarized light, right: crossed Nichols.


Table 1: Minor and trace element composition of the specimen. (in wt. %).

 Iron                                                            0.78
 Calcium                                                         0.63
 Titanium                                                        0.05
 Manganese                                                       0.03
 Zirconium                                                       0.01


Summary of findings: This specimen (Fig. 1) is a silica-rich volcanic rock, in part glassy with a rhyolitic composition, (Figs.
2 and 3) and with phenocrysts of titanium-rich magnetite (Figs. 2 and 4), an epidote group species with rare earth
element content, a mineral close to allanite (Figs. 2 and 5), fluorite (Figs. 2 and 6), altered biotite (Figs. 2 and 7),
titanium-free magnetite or hematite, hematite is more likely since no titanium is seen and hematite does not
incorporate much titanium but magnetite does (Figs. 2 and 8) and potassium feldspar, likely orthoclase (Figs. 9 and 10).
The ground mass consists of glassy and fine-grained crystalline domains. X-ray maps (Fig. 11) show potassium
enrichment around phenocrysts. Minar and trace elements (Table 1) are typical for igneous volcanic rock close to
rhyolites or obsidian. This specimen appears to be a phenocrystic obsidian with beginning crystallization of the glassy
ground mass (Fig. 12).


Date: Sept. 7, 2021                         Signature
A calcite specimen with a striking red response under ultraviolet light and a dark included mass.
Tested specimen: 92846 (#5) · Report completed: February 25, 2022
Key finding: Testing identified manganoan calcite and a dark mass of sphalerite. The report attributes the strong red UV fluorescence to manganese in the absence of detectable iron in the tested calcite.
What the report means
The report considers a hydrothermal vein association likely. Peru is the provenance supplied by Soul Body Gems, not a locality established by the analysis. UV response and phase distribution were documented for this specimen. Also see Pink Mangano Calcite.
The images reproduce the laboratory report for the specimen named above.
Understanding the report figures
Use this guide alongside the written findings and the original report transcript. It explains the purpose of each analytical figure and preserves the laboratory’s own figure labels. The interpretations apply to the tested specimen; signals alone do not establish the identity of every similar-looking stone.
Electron microscope image: This view shows small-scale regions selected for analysis. Its brightness contrast helps distinguish regions with different compositions; it is not a photograph of their natural colors. Numbered spots connect this view to the analyses listed in the report.
Laboratory figure caption: Fig. 2: Backscattered electron images of the specimen.
Elemental spectrum: The peaks record characteristic X-ray signals from elements in the analyzed spot or area. This is an analysis of that location, not automatically of the entire specimen. Any mineral identification or uncertainty named in the laboratory caption is retained below.
Laboratory figure caption: Fig. 3: Energy dispersive spectral analysis of spot 1 in Fig. 2. (manganoan calcite)
Elemental spectrum: The peaks record characteristic X-ray signals from elements in the analyzed spot or area. This is an analysis of that location, not automatically of the entire specimen. Any mineral identification or uncertainty named in the laboratory caption is retained below.
Laboratory figure caption: Fig. 4: Energy dispersive spectral analysis of spot 2 in Fig. 2. (sphalerite)
Electron microscope image: This view shows small-scale regions selected for analysis. Its brightness contrast helps distinguish regions with different compositions; it is not a photograph of their natural colors. Numbered spots connect this view to the analyses listed in the report.
Laboratory figure caption: Fig. 5: Backscattered electron image of the area shown in Fig. 2. Manganese: blue, zinc: yellow..
Read the report as text
This transcription makes the laboratory findings, figure captions, and table values available without opening the page images. Refer to the original images above for visual details.
Laboratory report
                                               Analytical Result Report

Sample id: 92846 (#5)
Submitted by: K. Bitner
Date submitted: Feb. 14, 2022.
Date completed: Feb. 25, 2022.
Operating conditions: An AMRAY 1830 SEM operated at 25 kV acceleration potential, 26 mm working distance, 15
degrees sample tilt, coated with 250 Å carbon. Using the X-ray fluorescence attachment with 35 kV potential in
conjunction with the EDS system.


Fig. 1: Photograph of the specimen. 6.5cm maximum dimension. Left: daylight, riht: UV light showing strong red
fluorescence


Fig. 2: Backscattered electron images of the specimen.
Fig. 3: Energy dispersive spectral analysis of spot 1 in Fig. 2. (manganoan calcite)


Fig. 4: Energy dispersive spectral analysis of spot 2 in Fig. 2. (sphalerite)
Fig. 5: Backscattered electron image of the area shown in Fig. 2. Manganese: blue, zinc: yellow..


Table 1: Minor and trace element composition of the specimen. (in wt. %).

 Iron                                                          nd
 Magnesium                                                     1.1
 Manganese                                                     5.7
 Zinc                                                          0.2


Summary of findings: This specimen (Fig. 1) is a manganoan calcite (Figs. 2 and 3, Table 1). The lack of iron permitted
strong UV response caused by manganese shown in Fig. 1. Manganese is distributed a little patchy which is noticeable in
Fig. 5. A dark mass of sphalerite is present in the specimen (Figs. 2 and 4). The sphalerite is very clean! This is likely a
specimen from a hydrothermal vein type assemblage. A very intriguing specimen!


Date: February 25, 2022                         Signature
A calcite specimen with a striking red response under ultraviolet light and a dark included mass.
Tested specimen: 92846 (#5) · Report completed: February 25, 2022
Key finding: Testing identified manganoan calcite and a dark mass of sphalerite. The report attributes the strong red UV fluorescence to manganese in the absence of detectable iron in the tested calcite.
What the report means
The report considers a hydrothermal vein association likely. This is the same Peruvian specimen shown under Mangano Calcite (Peru). The report identifies manganoan calcite and sphalerite; the pink label is a descriptive market name for this piece.
The images reproduce the laboratory report for the specimen named above.
Understanding the report figures
Use this guide alongside the written findings and the original report transcript. It explains the purpose of each analytical figure and preserves the laboratory’s own figure labels. The interpretations apply to the tested specimen; signals alone do not establish the identity of every similar-looking stone.
Electron microscope image: This view shows small-scale regions selected for analysis. Its brightness contrast helps distinguish regions with different compositions; it is not a photograph of their natural colors. Numbered spots connect this view to the analyses listed in the report.
Laboratory figure caption: Fig. 2: Backscattered electron images of the specimen.
Elemental spectrum: The peaks record characteristic X-ray signals from elements in the analyzed spot or area. This is an analysis of that location, not automatically of the entire specimen. Any mineral identification or uncertainty named in the laboratory caption is retained below.
Laboratory figure caption: Fig. 3: Energy dispersive spectral analysis of spot 1 in Fig. 2. (manganoan calcite)
Elemental spectrum: The peaks record characteristic X-ray signals from elements in the analyzed spot or area. This is an analysis of that location, not automatically of the entire specimen. Any mineral identification or uncertainty named in the laboratory caption is retained below.
Laboratory figure caption: Fig. 4: Energy dispersive spectral analysis of spot 2 in Fig. 2. (sphalerite)
Electron microscope image: This view shows small-scale regions selected for analysis. Its brightness contrast helps distinguish regions with different compositions; it is not a photograph of their natural colors. Numbered spots connect this view to the analyses listed in the report.
Laboratory figure caption: Fig. 5: Backscattered electron image of the area shown in Fig. 2. Manganese: blue, zinc: yellow..
Read the report as text
This transcription makes the laboratory findings, figure captions, and table values available without opening the page images. Refer to the original images above for visual details.
Laboratory report
                                               Analytical Result Report

Sample id: 92846 (#5)
Submitted by: K. Bitner
Date submitted: Feb. 14, 2022.
Date completed: Feb. 25, 2022.
Operating conditions: An AMRAY 1830 SEM operated at 25 kV acceleration potential, 26 mm working distance, 15
degrees sample tilt, coated with 250 Å carbon. Using the X-ray fluorescence attachment with 35 kV potential in
conjunction with the EDS system.


Fig. 1: Photograph of the specimen. 6.5cm maximum dimension. Left: daylight, riht: UV light showing strong red
fluorescence


Fig. 2: Backscattered electron images of the specimen.
Fig. 3: Energy dispersive spectral analysis of spot 1 in Fig. 2. (manganoan calcite)


Fig. 4: Energy dispersive spectral analysis of spot 2 in Fig. 2. (sphalerite)
Fig. 5: Backscattered electron image of the area shown in Fig. 2. Manganese: blue, zinc: yellow..


Table 1: Minor and trace element composition of the specimen. (in wt. %).

 Iron                                                          nd
 Magnesium                                                     1.1
 Manganese                                                     5.7
 Zinc                                                          0.2


Summary of findings: This specimen (Fig. 1) is a manganoan calcite (Figs. 2 and 3, Table 1). The lack of iron permitted
strong UV response caused by manganese shown in Fig. 1. Manganese is distributed a little patchy which is noticeable in
Fig. 5. A dark mass of sphalerite is present in the specimen (Figs. 2 and 4). The sphalerite is very clean! This is likely a
specimen from a hydrothermal vein type assemblage. A very intriguing specimen!


Date: February 25, 2022                         Signature
A lilac-gray sphere tested to understand its composition and color.
Tested specimen: 92848 (#6) · Report completed: March 2, 2022
Key finding: The laboratory found it to be essentially monomineralic lepidolite. No detectable albite was seen in the mapped area, and the report notes no quartz in this specimen.
What the report means
The lilac-gray color was interpreted as likely related to iron, manganese, and titanium contents. A low potassium-to-rubidium ratio is consistent with an evolved granitic pegmatite. These interpretations belong to this tested sphere. Some sellers call this kind of material Purple Aventurine; this report establishes lepidolite in the submitted specimen.
The images reproduce the laboratory report for the specimen named above.
Understanding the report figures
Use this guide alongside the written findings and the original report transcript. It explains the purpose of each analytical figure and preserves the laboratory’s own figure labels. The interpretations apply to the tested specimen; signals alone do not establish the identity of every similar-looking stone.
Electron microscope image: This view shows small-scale regions selected for analysis. Its brightness contrast helps distinguish regions with different compositions; it is not a photograph of their natural colors. Numbered spots connect this view to the analyses listed in the report.
Laboratory figure caption: Fig. 2: Backscattered electron images of the specimen.
Elemental spectrum: The peaks record characteristic X-ray signals from elements in the analyzed spot or area. This is an analysis of that location, not automatically of the entire specimen. Any mineral identification or uncertainty named in the laboratory caption is retained below.
Laboratory figure caption: Fig. 3: Energy dispersive spectral analysis of spot 1 in Fig. 2. (lepidolite)
Elemental spectrum: The peaks record characteristic X-ray signals from elements in the analyzed spot or area. This is an analysis of that location, not automatically of the entire specimen. Any mineral identification or uncertainty named in the laboratory caption is retained below.
Laboratory figure caption: Fig. 4: Energy dispersive spectral analysis of spot 2 in Fig. 2. (lepidolite)
Element map: This map shows where the named elements occur within the analyzed area. Its colors represent the laboratory’s selected element channels, rather than the specimen’s visible colors. The caption below preserves any color key or distribution noted by the laboratory.
Laboratory figure caption: Fig. 5: X-ray maps of the area shown in Figs. 2 Potassium green, sodium red. Note that no detactable albite was seen in the image. Darker area at lower left is caused by the curvature of the sphere.
Read the report as text
This transcription makes the laboratory findings, figure captions, and table values available without opening the page images. Refer to the original images above for visual details.
Laboratory report
                                               Analytical Result Report

Sample id: 92848 (#6)
Submitted by: K. Bitner
Date submitted: Feb. 14, 2022.
Date completed: March 2, 2022.
Operating conditions: An AMRAY 1830 SEM operated at 25 kV acceleration potential, 26 mm working distance, 15
degrees sample tilt, coated with 250 Å carbon. Using the X-ray fluorescence attachment with 35 kV potential in
conjunction with the EDS system.


Fig. 1: Photograph of the specimen. 5.5 cm maximum dimensions.


Fig. 2: Backscattered electron images of the specimen.
Fig. 3: Energy dispersive spectral analysis of spot 1 in Fig. 2. (lepidolite)


Fig. 4: Energy dispersive spectral analysis of spot 2 in Fig. 2. (lepidolite)
Fig. 5: X-ray maps of the area shown in Figs. 2 Potassium green, sodium red. Note that no detactable albite was seen in
the image. Darker area at lower left is caused by the curvature of the sphere.


Table 1: Minor and trace element composition of the variscite portion of the specimen. (in wt. %).

 Iron                                                           0.09
 Manganese                                                      0.06
 Titanium                                                       0.15
 K/Rb ratio                                                     11


Summary of findings: This specimen (Fig. 1) is essentially monomineralic lepidolite (Figs. 2-5). It is very common in
pegmatitic lepidolite masses to see some albite and/or quartz but not in this case. The color is also interesting, this lilac-
gray is likely a result of relatively similar contents of iron, manganese, and titanium and the resulting intervalence charge
transfer reactions are probably responsible for the color. Higher manganese would result in more intense purple colors.

The low K/Rb ratio is typical for geochemically evolved granitic pegmatites.


Date: March 2, 2022                          Signature
A purple to lilac-gray sphere marketed by some as Purple Aventurine was tested to determine its mineral composition.
Tested specimen: 92848 (#6) · Report completed: March 2, 2022
Key finding: The laboratory found it to be essentially monomineralic lepidolite. No detectable albite was seen in the mapped area, and the report notes no quartz in this specimen.
What the report means
The lilac-gray color was interpreted as likely related to iron, manganese, and titanium contents. A low potassium-to-rubidium ratio is consistent with an evolved granitic pegmatite. The laboratory describes this particular piece as essentially lepidolite, with no quartz or albite identified in the tested area. The “Purple Aventurine” label does not negate the lepidolite finding. See Lepidolite (Purple) for the companion entry.
The images reproduce the laboratory report for the specimen named above.
Understanding the report figures
Use this guide alongside the written findings and the original report transcript. It explains the purpose of each analytical figure and preserves the laboratory’s own figure labels. The interpretations apply to the tested specimen; signals alone do not establish the identity of every similar-looking stone.
Electron microscope image: This view shows small-scale regions selected for analysis. Its brightness contrast helps distinguish regions with different compositions; it is not a photograph of their natural colors. Numbered spots connect this view to the analyses listed in the report.
Laboratory figure caption: Fig. 2: Backscattered electron images of the specimen.
Elemental spectrum: The peaks record characteristic X-ray signals from elements in the analyzed spot or area. This is an analysis of that location, not automatically of the entire specimen. Any mineral identification or uncertainty named in the laboratory caption is retained below.
Laboratory figure caption: Fig. 3: Energy dispersive spectral analysis of spot 1 in Fig. 2. (lepidolite)
Elemental spectrum: The peaks record characteristic X-ray signals from elements in the analyzed spot or area. This is an analysis of that location, not automatically of the entire specimen. Any mineral identification or uncertainty named in the laboratory caption is retained below.
Laboratory figure caption: Fig. 4: Energy dispersive spectral analysis of spot 2 in Fig. 2. (lepidolite)
Element map: This map shows where the named elements occur within the analyzed area. Its colors represent the laboratory’s selected element channels, rather than the specimen’s visible colors. The caption below preserves any color key or distribution noted by the laboratory.
Laboratory figure caption: Fig. 5: X-ray maps of the area shown in Figs. 2 Potassium green, sodium red. Note that no detactable albite was seen in the image. Darker area at lower left is caused by the curvature of the sphere.
Read the report as text
This transcription makes the laboratory findings, figure captions, and table values available without opening the page images. Refer to the original images above for visual details.
Laboratory report
                                               Analytical Result Report

Sample id: 92848 (#6)
Submitted by: K. Bitner
Date submitted: Feb. 14, 2022.
Date completed: March 2, 2022.
Operating conditions: An AMRAY 1830 SEM operated at 25 kV acceleration potential, 26 mm working distance, 15
degrees sample tilt, coated with 250 Å carbon. Using the X-ray fluorescence attachment with 35 kV potential in
conjunction with the EDS system.


Fig. 1: Photograph of the specimen. 5.5 cm maximum dimensions.


Fig. 2: Backscattered electron images of the specimen.
Fig. 3: Energy dispersive spectral analysis of spot 1 in Fig. 2. (lepidolite)


Fig. 4: Energy dispersive spectral analysis of spot 2 in Fig. 2. (lepidolite)
Fig. 5: X-ray maps of the area shown in Figs. 2 Potassium green, sodium red. Note that no detactable albite was seen in
the image. Darker area at lower left is caused by the curvature of the sphere.


Table 1: Minor and trace element composition of the variscite portion of the specimen. (in wt. %).

 Iron                                                           0.09
 Manganese                                                      0.06
 Titanium                                                       0.15
 K/Rb ratio                                                     11


Summary of findings: This specimen (Fig. 1) is essentially monomineralic lepidolite (Figs. 2-5). It is very common in
pegmatitic lepidolite masses to see some albite and/or quartz but not in this case. The color is also interesting, this lilac-
gray is likely a result of relatively similar contents of iron, manganese, and titanium and the resulting intervalence charge
transfer reactions are probably responsible for the color. Higher manganese would result in more intense purple colors.

The low K/Rb ratio is typical for geochemically evolved granitic pegmatites.


Date: March 2, 2022                          Signature
Two small spheres tested together to identify their green material and contrasting inclusions.
Tested specimen: 92847 (#4) · Report completed: February 28, 2022
Key finding: Variscite was the major component of both specimens. The smaller sphere also contained a volcanic-rock inclusion, possibly rhyolite, and some iron-rich impure variscite. Some dark areas were carbon-rich and likely hydrocarbon-bearing.
What the report means
The report notes that one carbon-rich patch on the larger sphere may be surface contamination. Its discussion of vanadium and reducing conditions is an interpretation of the tested material. Brazil is the provenance supplied by Soul Body Gems. See the companion Brazilian Variscite entry.
The images reproduce the laboratory report for the specimen named above.
Understanding the report figures
Use this guide alongside the written findings and the original report transcript. It explains the purpose of each analytical figure and preserves the laboratory’s own figure labels. The interpretations apply to the tested specimen; signals alone do not establish the identity of every similar-looking stone.
Electron microscope image: This view shows small-scale regions selected for analysis. Its brightness contrast helps distinguish regions with different compositions; it is not a photograph of their natural colors. Numbered spots connect this view to the analyses listed in the report.
Laboratory figure caption: Fig. 2: Backscattered electron images of the larger specimen.
Elemental spectrum: The peaks record characteristic X-ray signals from elements in the analyzed spot or area. This is an analysis of that location, not automatically of the entire specimen. Any mineral identification or uncertainty named in the laboratory caption is retained below.
Laboratory figure caption: Fig. 3: Energy dispersive spectral analysis of spot 1 in Fig. 2. (variscite)
Electron microscope image: This view shows small-scale regions selected for analysis. Its brightness contrast helps distinguish regions with different compositions; it is not a photograph of their natural colors. Numbered spots connect this view to the analyses listed in the report.
Laboratory figure caption: Fig. 4: Backscattered electron images of the smaller specimen.
Elemental spectrum: The peaks record characteristic X-ray signals from elements in the analyzed spot or area. This is an analysis of that location, not automatically of the entire specimen. Any mineral identification or uncertainty named in the laboratory caption is retained below.
Laboratory figure caption: Fig. 5: Energy dispersive spectral analysis of spot 1 in Fig. 4. (volcanic rock fragment, possibly rhyolite)
Elemental spectrum: The peaks record characteristic X-ray signals from elements in the analyzed spot or area. This is an analysis of that location, not automatically of the entire specimen. Any mineral identification or uncertainty named in the laboratory caption is retained below.
Laboratory figure caption: Fig. 6: Energy dispersive spectral analysis of spot 3 in Fig. 4. (variscite).
Elemental spectrum: The peaks record characteristic X-ray signals from elements in the analyzed spot or area. This is an analysis of that location, not automatically of the entire specimen. Any mineral identification or uncertainty named in the laboratory caption is retained below.
Laboratory figure caption: Fig. 7: Energy dispersive spectral analysis of spot 4 in Fig. 4. (mixture of variscite with iron-rich impurities).
Element map: This map shows where the named elements occur within the analyzed area. Its colors represent the laboratory’s selected element channels, rather than the specimen’s visible colors. The caption below preserves any color key or distribution noted by the laboratory.
Laboratory figure caption: Fig. 8: X-ray maps of the areas shown in Figs. 2 and 4. Left: carbon: yellow, phosphorus: red; right: carbon: yellow, phoosphorus: red, silicon: blue.
Read the report as text
This transcription makes the laboratory findings, figure captions, and table values available without opening the page images. Refer to the original images above for visual details.
Laboratory report
                                                Analytical Result Report

Sample id: 92847 (#4)
Submitted by: K. Bitner
Date submitted: Feb. 14, 2022.
Date completed: Feb. 28, 2022.
Operating conditions: An AMRAY 1830 SEM operated at 25 kV acceleration potential, 26 mm working distance, 15
degrees sample tilt, coated with 250 Å carbon. Using the X-ray fluorescence attachment with 35 kV potential in
conjunction with the EDS system.


Fig. 1: Photograph of the specimen. 2.5 and 2 cm maximum dimensions.


Fig. 2: Backscattered electron images of the larger specimen.
Fig. 3: Energy dispersive spectral analysis of spot 1 in Fig. 2. (variscite)


Fig. 4: Backscattered electron images of the smaller specimen.
Fig. 5: Energy dispersive spectral analysis of spot 1 in Fig. 4. (volcanic rock fragment, possibly rhyolite)


Fig. 6: Energy dispersive spectral analysis of spot 3 in Fig. 4. (variscite).
Fig. 7: Energy dispersive spectral analysis of spot 4 in Fig. 4. (mixture of variscite with iron-rich impurities).


Fig. 8: X-ray maps of the areas shown in Figs. 2 and 4. Left: carbon: yellow, phosphorus: red; right: carbon: yellow,
phoosphorus: red, silicon: blue.


Table 1: Minor and trace element composition of the variscite portion of the specimen. (in wt. %).

 Calcium                                                          0.04
 Chromium                                                         0.03
 Iron                                                             0.34
 Manganese                                                        0.03
 Titanium                                                         0.10
 Vanadium                                                         0.20


Summary of findings: These specimens (Fig. 1) contain variscite as major component (Figs. 2,3,4 and 6). In the smaller
sphere some inclusions of a volcanic rock, likely rhyolite (Figs. 4 and 5)is present as well and there are some iron-rich
impure variscite areas present (Figs. 4 and 7). The dark areas are carbon-rich (Fig. 8), likely some hydrocarbons. The
presence of vanadium suggests reducing conditions, as the vanadium is trivalent which is the green chromophore. The
patch of carbon-rich material in the alrger specien (left image in Fig. 8, may be a surface contamination. In the smaller
sphere, carbon is present in some of the black areas of the specimen (Fig. 8) (see also Falster, Hanson & Simmons:
Vanadium-bearing wavellite from Garland Cpo., Arkansas. Rocks & Minerals, 1990).


Date: February 28, 2022                        Signature
Brazilian Variscite SS Rings · Soul Body Gems, August 2024.
Two small spheres tested together to identify their green material and contrasting inclusions.
Tested specimen: 92847 (#4) · Report completed: February 28, 2022
Key finding: Variscite was the major component of both specimens. The smaller sphere also contained a volcanic-rock inclusion, possibly rhyolite, and some iron-rich impure variscite. Some dark areas were carbon-rich and likely hydrocarbon-bearing.
What the report means
The report notes that one carbon-rich patch on the larger sphere may be surface contamination. Its discussion of vanadium and reducing conditions is an interpretation of the tested material. This is the same pair of specimens and report shown under Variscite (Brazil); the Brazil provenance is supplied by Soul Body Gems.
The images reproduce the laboratory report for the specimen named above.
Understanding the report figures
Use this guide alongside the written findings and the original report transcript. It explains the purpose of each analytical figure and preserves the laboratory’s own figure labels. The interpretations apply to the tested specimen; signals alone do not establish the identity of every similar-looking stone.
Electron microscope image: This view shows small-scale regions selected for analysis. Its brightness contrast helps distinguish regions with different compositions; it is not a photograph of their natural colors. Numbered spots connect this view to the analyses listed in the report.
Laboratory figure caption: Fig. 2: Backscattered electron images of the larger specimen.
Elemental spectrum: The peaks record characteristic X-ray signals from elements in the analyzed spot or area. This is an analysis of that location, not automatically of the entire specimen. Any mineral identification or uncertainty named in the laboratory caption is retained below.
Laboratory figure caption: Fig. 3: Energy dispersive spectral analysis of spot 1 in Fig. 2. (variscite)
Electron microscope image: This view shows small-scale regions selected for analysis. Its brightness contrast helps distinguish regions with different compositions; it is not a photograph of their natural colors. Numbered spots connect this view to the analyses listed in the report.
Laboratory figure caption: Fig. 4: Backscattered electron images of the smaller specimen.
Elemental spectrum: The peaks record characteristic X-ray signals from elements in the analyzed spot or area. This is an analysis of that location, not automatically of the entire specimen. Any mineral identification or uncertainty named in the laboratory caption is retained below.
Laboratory figure caption: Fig. 5: Energy dispersive spectral analysis of spot 1 in Fig. 4. (volcanic rock fragment, possibly rhyolite)
Elemental spectrum: The peaks record characteristic X-ray signals from elements in the analyzed spot or area. This is an analysis of that location, not automatically of the entire specimen. Any mineral identification or uncertainty named in the laboratory caption is retained below.
Laboratory figure caption: Fig. 6: Energy dispersive spectral analysis of spot 3 in Fig. 4. (variscite).
Elemental spectrum: The peaks record characteristic X-ray signals from elements in the analyzed spot or area. This is an analysis of that location, not automatically of the entire specimen. Any mineral identification or uncertainty named in the laboratory caption is retained below.
Laboratory figure caption: Fig. 7: Energy dispersive spectral analysis of spot 4 in Fig. 4. (mixture of variscite with iron-rich impurities).
Element map: This map shows where the named elements occur within the analyzed area. Its colors represent the laboratory’s selected element channels, rather than the specimen’s visible colors. The caption below preserves any color key or distribution noted by the laboratory.
Laboratory figure caption: Fig. 8: X-ray maps of the areas shown in Figs. 2 and 4. Left: carbon: yellow, phosphorus: red; right: carbon: yellow, phoosphorus: red, silicon: blue.
Read the report as text
This transcription makes the laboratory findings, figure captions, and table values available without opening the page images. Refer to the original images above for visual details.
Laboratory report
                                                Analytical Result Report

Sample id: 92847 (#4)
Submitted by: K. Bitner
Date submitted: Feb. 14, 2022.
Date completed: Feb. 28, 2022.
Operating conditions: An AMRAY 1830 SEM operated at 25 kV acceleration potential, 26 mm working distance, 15
degrees sample tilt, coated with 250 Å carbon. Using the X-ray fluorescence attachment with 35 kV potential in
conjunction with the EDS system.


Fig. 1: Photograph of the specimen. 2.5 and 2 cm maximum dimensions.


Fig. 2: Backscattered electron images of the larger specimen.
Fig. 3: Energy dispersive spectral analysis of spot 1 in Fig. 2. (variscite)


Fig. 4: Backscattered electron images of the smaller specimen.
Fig. 5: Energy dispersive spectral analysis of spot 1 in Fig. 4. (volcanic rock fragment, possibly rhyolite)


Fig. 6: Energy dispersive spectral analysis of spot 3 in Fig. 4. (variscite).
Fig. 7: Energy dispersive spectral analysis of spot 4 in Fig. 4. (mixture of variscite with iron-rich impurities).


Fig. 8: X-ray maps of the areas shown in Figs. 2 and 4. Left: carbon: yellow, phosphorus: red; right: carbon: yellow,
phoosphorus: red, silicon: blue.


Table 1: Minor and trace element composition of the variscite portion of the specimen. (in wt. %).

 Calcium                                                          0.04
 Chromium                                                         0.03
 Iron                                                             0.34
 Manganese                                                        0.03
 Titanium                                                         0.10
 Vanadium                                                         0.20


Summary of findings: These specimens (Fig. 1) contain variscite as major component (Figs. 2,3,4 and 6). In the smaller
sphere some inclusions of a volcanic rock, likely rhyolite (Figs. 4 and 5)is present as well and there are some iron-rich
impure variscite areas present (Figs. 4 and 7). The dark areas are carbon-rich (Fig. 8), likely some hydrocarbons. The
presence of vanadium suggests reducing conditions, as the vanadium is trivalent which is the green chromophore. The
patch of carbon-rich material in the alrger specien (left image in Fig. 8, may be a surface contamination. In the smaller
sphere, carbon is present in some of the black areas of the specimen (Fig. 8) (see also Falster, Hanson & Simmons:
Vanadium-bearing wavellite from Garland Cpo., Arkansas. Rocks & Minerals, 1990).


Date: February 28, 2022                        Signature
Brazilian Variscite SS Rings · Soul Body Gems, August 2024.
A carved cat offered as obsidian from China raised questions about whether the material was genuine. We submitted this specific carving for laboratory examination.
Finding: The laboratory found a composition consistent with a glassy igneous rock (obsidian). Uniform sodium and potassium distribution and predominantly isotropic material supported that interpretation. The report concludes that the impression it was carved from obsidian or obsidian-like material was confirmed.
What was examined
The submitted specimen was a carved cat about 5 cm across (sample 92835, #4). The September 1, 2021 report includes backscattered electron images, energy dispersive analysis, an X-ray map, and petrographic images. It notes minor crystalline portions, likely small quartz or feldspar crystals.
The carving was supplied to us as material from China. The analytical report assesses its composition; it does not independently verify the country of origin or every carving sold under the same name.
View the original report
Select any page to enlarge it. Three pages, in report order.
Use this guide alongside the written findings and the original report transcript. It explains the purpose of each analytical figure and preserves the laboratory’s own figure labels. The interpretations apply to the tested specimen; signals alone do not establish the identity of every similar-looking stone.
Electron microscope image: This view shows small-scale regions selected for analysis. Its brightness contrast helps distinguish regions with different compositions; it is not a photograph of their natural colors. Numbered spots connect this view to the analyses listed in the report.
Laboratory figure caption: Fig. 2: Backscattered electron images of the specimen.
Elemental spectrum: The peaks record characteristic X-ray signals from elements in the analyzed spot or area. This is an analysis of that location, not automatically of the entire specimen. Any mineral identification or uncertainty named in the laboratory caption is retained below.
Laboratory figure caption: Fig. 3: Energy dispersive spectral analysis of spot 1 in Fig. 2.
Elemental spectrum: The peaks record characteristic X-ray signals from elements in the analyzed spot or area. This is an analysis of that location, not automatically of the entire specimen. Any mineral identification or uncertainty named in the laboratory caption is retained below.
Laboratory figure caption: Fig. 4: Energy dispersive spectral analysis of spot 2 in Fig. 2.
Element map: This map shows where the named elements occur within the analyzed area. Its colors represent the laboratory’s selected element channels, rather than the specimen’s visible colors. The caption below preserves any color key or distribution noted by the laboratory.
This text is transcribed from the laboratory report so the findings and figure captions can be read without opening the page images. The images remain available above for visual details.
Laboratory report
                                               Analytical Result Report

Sample id: 92835(#4, carved cat)
Submitted by: K. Bitner
Date submitted: Aug.2, 2021.
Date completed: Sept. 1, 2021.
Operating conditions: An AMRAY 1830 SEM operated at 25 kV acceleration potential, 26 mm working distance, 15
degrees sample tilt, coated with 250 Å carbon. Using the X-ray fluorescence attachment with 35 kV potential in
conjunction with the EDS system.


Fig. 1: Photograph of the specimen. 5 cm maximum dimension.


Fig. 2: Backscattered electron images of the specimen.
Fig. 3: Energy dispersive spectral analysis of spot 1 in Fig. 2.


Fig. 4: Energy dispersive spectral analysis of spot 2 in Fig. 2.
Fig. 5: X-ray map of Fig. 2. sodium: red, poassium: green.


Fig. 6: Petrographic images of particles of the specimen. Left: plane polarized light, right: crossed Nichols.


Table 1: Minor and trace element composition of the specimen. (in wt. %).

 Iron                                                           1.87
 Calcium                                                        0.21
 Titanium                                                       0.07
 Manganese                                                      0.06
 Zirconium                                                      0.08


Summary of findings: This specimen (Fig. 1) has a composition that agrees with that of a glassy igneous rock (obsidian)
(Figs. 2-4 and Table 1). Sodium and potassium are uniformly distributed which is typical for a glassy rock (Fig. 5). The
material s dominantly isotropic with some minor crystalline portions, likely small crystals of quartz of feldspars (Fig. 6),
thus impression that it was carved from obsidian or obsidian-like material is confirmed.


Date: Sept. 1, 2021                        Signature
Personal Collection Release: Moonstone Tanzania · Soul Body Gems, October 2024.
A sphere sold as Moonstone from Tanzania was submitted for mineralogical testing. Its feldspar structure matters because the trade name “moonstone” can cover more than one kind of material.
Finding: The tested sphere is predominantly sodic plagioclase (albite-rich) with discontinuous potassium feldspar exsolution lamellae. The report describes this texture as antiperthite. Such material has often been grouped with moonstone in trade, although the laboratory distinguishes it from potassium feldspar perthite commonly called moonstone.
Why this distinction matters
In this specimen, the bulk feldspar is plagioclase and the lamellae are potassium feldspar. Perthite reverses that relationship: potassium feldspar is the bulk material, with plagioclase lamellae. The report notes that antiperthite may show schiller. It recorded trace iron, barium, strontium, and titanium.
This result applies to the 4.5 cm sphere identified as sample 92834 (#3), reported August 30, 2021. Tanzania is the supplied locality; the analytical report does not independently verify geographic origin. Other moonstones will have their own entries as reports are added.
View the original report
Select any page to enlarge it. Three pages, in report order.
Use this guide alongside the written findings and the original report transcript. It explains the purpose of each analytical figure and preserves the laboratory’s own figure labels. The interpretations apply to the tested specimen; signals alone do not establish the identity of every similar-looking stone.
Electron microscope image: This view shows small-scale regions selected for analysis. Its brightness contrast helps distinguish regions with different compositions; it is not a photograph of their natural colors. Numbered spots connect this view to the analyses listed in the report.
Laboratory figure caption: Fig. 2: Backscattered electron images of the specimen.
Elemental spectrum: The peaks record characteristic X-ray signals from elements in the analyzed spot or area. This is an analysis of that location, not automatically of the entire specimen. Any mineral identification or uncertainty named in the laboratory caption is retained below.
Laboratory figure caption: Fig. 3: Energy dispersive spectral analysis of spot 1 in Fig. 2. (plagioclase, albite-rich)
Elemental spectrum: The peaks record characteristic X-ray signals from elements in the analyzed spot or area. This is an analysis of that location, not automatically of the entire specimen. Any mineral identification or uncertainty named in the laboratory caption is retained below.
Laboratory figure caption: Fig. 4: Energy dispersive spectral analysis of spot 2 in Fig. 2. (potassium feldspar)
Element map: This map shows where the named elements occur within the analyzed area. Its colors represent the laboratory’s selected element channels, rather than the specimen’s visible colors. The caption below preserves any color key or distribution noted by the laboratory.
This text is transcribed from the laboratory report so the findings and figure captions can be read without opening the page images. The images remain available above for visual details.
Laboratory report
                                               Analytical Result Report

Sample id: 92834(#3, sphere)
Submitted by: K. Bitner
Date submitted: Aug.2, 2021.
Date completed: Aug. 30, 2021.
Operating conditions: An AMRAY 1830 SEM operated at 25 kV acceleration potential, 26 mm working distance, 15
degrees sample tilt, coated with 250 Å carbon. Using the X-ray fluorescence attachment with 35 kV potential in
conjunction with the EDS system.


Fig. 1: Photograph of the specimen. 4.5 cm maximum dimension.


Fig. 2: Backscattered electron images of the specimen.
Fig. 3: Energy dispersive spectral analysis of spot 1 in Fig. 2. (plagioclase, albite-rich)


Fig. 4: Energy dispersive spectral analysis of spot 2 in Fig. 2. (potassium feldspar)
Fig. 5: X-ray map of Fig. 2. (right image) sodium: red, poassium: green.


Table 1: trace element composition of the specimen. (in wt. %).

 Barium                                                        0.01
 Strontium                                                     0.01
 Iron                                                          0.08
 Titanium                                                      0.01


Summary of findings: This specimen (Fig. 1) is a sodic plagioclase (basically an albite with minor anorthite component)
with exsolution lamellae of potassium feldspar (Figs. 2-5). The lamellae are non-continuous which is a common
occurrence. This what is commonly called an antiperthite whereas in a perthite, the bulk is a potassium feldspar with
plagioclase exsolution lamellae. Antiperthite may exhibit schiller as does perthite. The potassium feldspar perthite is
what is commonly called moonstone. Due to a lack of a separate name for antiperthitic samples, they have often been
lumped with the true moonstones. Chemically, the trace elements include iron, barium, strontium and titanium (Table
1).


Date: Aug. 30, 2021                        Signature
This sphere was offered as containing sphalerite. We tested it to check the visible material rather than relying on its market name.
Finding: The tested sphere is a composite of quartz and fluorite. The laboratory found no detectable zinc or sulfur in its analysis and concluded there was no sphalerite in this specimen.
What the laboratory examined
The 4.5 cm sphere was submitted as sample 92833 (#2), described in the report as a sphere with “sphalerite.” Electron imaging, energy dispersive spectra, and an X-ray map identified quartz and fluorite; the laboratory described the piece as resembling a hydrothermal vein assemblage. The report was completed August 29, 2021.
This conclusion belongs to the submitted sphere and should not be applied automatically to other pieces sold under either name.
Use this guide alongside the written findings and the original report transcript. It explains the purpose of each analytical figure and preserves the laboratory’s own figure labels. The interpretations apply to the tested specimen; signals alone do not establish the identity of every similar-looking stone.
Electron microscope image: This view shows small-scale regions selected for analysis. Its brightness contrast helps distinguish regions with different compositions; it is not a photograph of their natural colors. Numbered spots connect this view to the analyses listed in the report.
Laboratory figure caption: Fig. 2: Backscattered electron images of the specimen.
Elemental spectrum: The peaks record characteristic X-ray signals from elements in the analyzed spot or area. This is an analysis of that location, not automatically of the entire specimen. Any mineral identification or uncertainty named in the laboratory caption is retained below.
Laboratory figure caption: Fig. 3: Energy dispersive spectral analysis of spot 1 in Fig. 2. (quartz)
Elemental spectrum: The peaks record characteristic X-ray signals from elements in the analyzed spot or area. This is an analysis of that location, not automatically of the entire specimen. Any mineral identification or uncertainty named in the laboratory caption is retained below.
Laboratory figure caption: Fig. 4: Energy dispersive spectral analysis of spot 2 in Fig. 2. (fluorite)
Element map: This map shows where the named elements occur within the analyzed area. Its colors represent the laboratory’s selected element channels, rather than the specimen’s visible colors. The caption below preserves any color key or distribution noted by the laboratory.
This text is transcribed from the laboratory report so the findings and figure captions can be read without opening the page images. The images remain available above for visual details.
Laboratory report
                                               Analytical Result Report

Sample id: 92833(#2, sphere with ‘sphalerite’)
Submitted by: K. Bitner
Date submitted: Aug.2, 2021.
Date completed: Aug. 29, 2021.
Operating conditions: An AMRAY 1830 SEM operated at 25 kV acceleration potential, 26 mm working distance, 15
degrees sample tilt, coated with 250 Å carbon. Using the X-ray fluorescence attachment with 35 kV potential in
conjunction with the EDS system.


Fig. 1: Photograph of the specimen. 4.5 cm maximum dimension.


Fig. 2: Backscattered electron images of the specimen.
Fig. 3: Energy dispersive spectral analysis of spot 1 in Fig. 2. (quartz)


Fig. 4: Energy dispersive spectral analysis of spot 2 in Fig. 2. (fluorite)
Fig. 5: X-ray map of Fig. 2. (right image) fluorine: red, silicon: green.


Table 1: composition of the specimen. (in wt. %).

 silicon                                                          25.43
 calcium                                                          23.25
 Iron                                                             0.01
 aluminum                                                         0.50
 phosphorus                                                       0.05


Summary of findings: This specimen (Fig. 1) is a composite of quartz and fluorite (Figs. 2-5 and Table 1). It looks like a
hydrothermal vein assemblage. There are no zinc or sulfur detectable so there is no sphalerite! Table 1 shows only
minor impurities.


Date: Aug. 29, 2021                          Signature
The sphere marketed as containing sphalerite was identified by the laboratory as a quartz and fluorite composite.
Finding: The tested sphere is a composite of quartz and fluorite. The laboratory found no detectable zinc or sulfur in its analysis and concluded there was no sphalerite in this specimen.
What the laboratory examined
The 4.5 cm sphere was submitted as sample 92833 (#2), described in the report as a sphere with “sphalerite.” Electron imaging, energy dispersive spectra, and an X-ray map identified quartz and fluorite; the laboratory described the piece as resembling a hydrothermal vein assemblage. The report was completed August 29, 2021.
This conclusion belongs to the submitted sphere and should not be applied automatically to other pieces sold under either name.
Use this guide alongside the written findings and the original report transcript. It explains the purpose of each analytical figure and preserves the laboratory’s own figure labels. The interpretations apply to the tested specimen; signals alone do not establish the identity of every similar-looking stone.
Electron microscope image: This view shows small-scale regions selected for analysis. Its brightness contrast helps distinguish regions with different compositions; it is not a photograph of their natural colors. Numbered spots connect this view to the analyses listed in the report.
Laboratory figure caption: Fig. 2: Backscattered electron images of the specimen.
Elemental spectrum: The peaks record characteristic X-ray signals from elements in the analyzed spot or area. This is an analysis of that location, not automatically of the entire specimen. Any mineral identification or uncertainty named in the laboratory caption is retained below.
Laboratory figure caption: Fig. 3: Energy dispersive spectral analysis of spot 1 in Fig. 2. (quartz)
Elemental spectrum: The peaks record characteristic X-ray signals from elements in the analyzed spot or area. This is an analysis of that location, not automatically of the entire specimen. Any mineral identification or uncertainty named in the laboratory caption is retained below.
Laboratory figure caption: Fig. 4: Energy dispersive spectral analysis of spot 2 in Fig. 2. (fluorite)
Element map: This map shows where the named elements occur within the analyzed area. Its colors represent the laboratory’s selected element channels, rather than the specimen’s visible colors. The caption below preserves any color key or distribution noted by the laboratory.
This text is transcribed from the laboratory report so the findings and figure captions can be read without opening the page images. The images remain available above for visual details.
Laboratory report
                                               Analytical Result Report

Sample id: 92833(#2, sphere with ‘sphalerite’)
Submitted by: K. Bitner
Date submitted: Aug.2, 2021.
Date completed: Aug. 29, 2021.
Operating conditions: An AMRAY 1830 SEM operated at 25 kV acceleration potential, 26 mm working distance, 15
degrees sample tilt, coated with 250 Å carbon. Using the X-ray fluorescence attachment with 35 kV potential in
conjunction with the EDS system.


Fig. 1: Photograph of the specimen. 4.5 cm maximum dimension.


Fig. 2: Backscattered electron images of the specimen.
Fig. 3: Energy dispersive spectral analysis of spot 1 in Fig. 2. (quartz)


Fig. 4: Energy dispersive spectral analysis of spot 2 in Fig. 2. (fluorite)
Fig. 5: X-ray map of Fig. 2. (right image) fluorine: red, silicon: green.


Table 1: composition of the specimen. (in wt. %).

 silicon                                                          25.43
 calcium                                                          23.25
 Iron                                                             0.01
 aluminum                                                         0.50
 phosphorus                                                       0.05


Summary of findings: This specimen (Fig. 1) is a composite of quartz and fluorite (Figs. 2-5 and Table 1). It looks like a
hydrothermal vein assemblage. There are no zinc or sulfur detectable so there is no sphalerite! Table 1 shows only
minor impurities.


Date: Aug. 29, 2021                          Signature
A second Peruvian chrysocolla specimen, separately examined from the piece described in our other Chrysocolla from Peru entry.
Finding: The tested specimen is largely chrysocolla with abundant fragmental quartz and feldspars. The report also describes an aluminum silicate that could not be narrowed to one species, plus reddish hematite-dominant fragments with possible goethite, permeated by chrysocolla.
What this report covers
This is sample 92840 (#2), completed February 22, 2022, and is a different specimen from our earlier Peru chrysocolla report. The report presents electron images, elemental spectra, and X-ray maps across six pages. Peru is the supplied source for this piece; the laboratory report does not independently establish its locality.
The laboratory's hypothetical discussion of a Southwestern U.S. setting is an analogy about how such fragments could form, not an origin determination for this specimen.
Use this guide alongside the written findings and the original report transcript. It explains the purpose of each analytical figure and preserves the laboratory’s own figure labels. The interpretations apply to the tested specimen; signals alone do not establish the identity of every similar-looking stone.
Electron microscope image: This view shows small-scale regions selected for analysis. Its brightness contrast helps distinguish regions with different compositions; it is not a photograph of their natural colors. Numbered spots connect this view to the analyses listed in the report.
Laboratory figure caption: Fig. 2: Backscattered electron images of the specimen.
Elemental spectrum: The peaks record characteristic X-ray signals from elements in the analyzed spot or area. This is an analysis of that location, not automatically of the entire specimen. Any mineral identification or uncertainty named in the laboratory caption is retained below.
Laboratory figure caption: Fig. 3: Energy dispersive spectral analysis of spot 1 in Fig. 2. (quartz)
Elemental spectrum: The peaks record characteristic X-ray signals from elements in the analyzed spot or area. This is an analysis of that location, not automatically of the entire specimen. Any mineral identification or uncertainty named in the laboratory caption is retained below.
Laboratory figure caption: Fig. 4: Energy dispersive spectral analysis of spot 2 in Fig. 2. (potassium feldspar)
Elemental spectrum: The peaks record characteristic X-ray signals from elements in the analyzed spot or area. This is an analysis of that location, not automatically of the entire specimen. Any mineral identification or uncertainty named in the laboratory caption is retained below.
Laboratory figure caption: Fig. 5: Energy dispersive spectral analysis of spot 3 in Fig. 2. (chrysocolla)
Elemental spectrum: The peaks record characteristic X-ray signals from elements in the analyzed spot or area. This is an analysis of that location, not automatically of the entire specimen. Any mineral identification or uncertainty named in the laboratory caption is retained below.
Laboratory figure caption: Fig. 6: Energy dispersive spectral analysis of spot 4 in Fig. 2. (aluminum silicate species)
Electron microscope image: This view shows small-scale regions selected for analysis. Its brightness contrast helps distinguish regions with different compositions; it is not a photograph of their natural colors. Numbered spots connect this view to the analyses listed in the report.
Laboratory figure caption: Fig. 7: Backscattered electron images of another area of the specimen.
Elemental spectrum: The peaks record characteristic X-ray signals from elements in the analyzed spot or area. This is an analysis of that location, not automatically of the entire specimen. Any mineral identification or uncertainty named in the laboratory caption is retained below.
Laboratory figure caption: Fig. 8: Energy dispersive spectral analysis of spot 1 in Fig. 5. (hematite/goethite with chrysocolla)
Electron microscope image: This view shows small-scale regions selected for analysis. Its brightness contrast helps distinguish regions with different compositions; it is not a photograph of their natural colors. Numbered spots connect this view to the analyses listed in the report.
Laboratory figure caption: Fig. 9: Backscattered electron images of the area shown in Fig. 2. Left: Copper: green, potasium: purple. Right: Silicon: red, aluminum: blue.
Electron microscope image: This view shows small-scale regions selected for analysis. Its brightness contrast helps distinguish regions with different compositions; it is not a photograph of their natural colors. Numbered spots connect this view to the analyses listed in the report.
Laboratory figure caption: Fig. 10: Backscattered electron image of the area shown in Fig. 7. Copper: green, iron: yellow.
Read the report as text
This text is transcribed from the laboratory report so the findings and figure captions can be read without opening the page images. The images remain available above for visual details.
Laboratory report
                                               Analytical Result Report

Sample id: 92840 (#2)
Submitted by: K. Bitner
Date submitted: Feb. 14, 2022.
Date completed: Feb. 22, 2022.
Operating conditions: An AMRAY 1830 SEM operated at 25 kV acceleration potential, 26 mm working distance, 15
degrees sample tilt, coated with 250 Å carbon. Using the X-ray fluorescence attachment with 35 kV potential in
conjunction with the EDS system.


Fig. 1: Photograph of the specimen. 5cm maximum dimension.


Fig. 2: Backscattered electron images of the specimen.
Fig. 3: Energy dispersive spectral analysis of spot 1 in Fig. 2. (quartz)


Fig. 4: Energy dispersive spectral analysis of spot 2 in Fig. 2. (potassium feldspar)
Fig. 5: Energy dispersive spectral analysis of spot 3 in Fig. 2. (chrysocolla)


Fig. 6: Energy dispersive spectral analysis of spot 4 in Fig. 2. (aluminum silicate species)
Fig. 7: Backscattered electron images of another area of the specimen.


Fig. 8: Energy dispersive spectral analysis of spot 1 in Fig. 5. (hematite/goethite with chrysocolla)
Fig. 9: Backscattered electron images of the area shown in Fig. 2. Left: Copper: green, potasium: purple. Right: Silicon:
red, aluminum: blue.


Fig. 10: Backscattered electron image of the area shown in Fig. 7. Copper: green, iron: yellow.


Table 1: Minor and trace element composition of the specimen. (in wt. %).

 Aluminum                                                      6.3
 Calcium                                                       0.33
 Chromium                                                      0.04
 Iron                                                          0.8
 Magnesium                                                     0.2
 Manganese                                                     0.06
 Phosphorus                                                    0.02
 Sulfur                                                        0.02
 Titanium                                                      0.05
 Vanadium                                                      0.04
 Zinc                                                          0.03


Summary of findings: This specimen (Fig. 1) is Composed largely of chrysocolla (Figs. 2, 6 and 9) with a lot of fragmental
quartz (Figs. 2, 3 and 9), feldspars (Figs. 2, 4 and 9), (these may have come from a fragmented rhyolite) an aluminum
silicate which may be andalusite, kyanite, or sillimanite but it may also be topaz (Figs. 2, 5 and 9). The reddish pieces are
pieces dominantly composed of hematite with possible goethite present (Figs. 7, 8 and 10). They are permeated with
chrysocolla. If this material has been mined in the Southwestern US, the admixed fragmental pieces in the chrysocolla
could have come from topaz rhyolite. We ran across a situation quite similar to this and published it in 2019 April-May
issue of Rocks and Minerals, Vol 94, 185: ‘Surprising find of spessartine from the Finch mine, Hayden area, Gila Co.,
Arizona by Dallaire, Falster and Simmons. Trace and minor elements are shown in Table 1.


Date: February 22, 2022                         Signature
This Peruvian material was offered under the Quantum Quattro name. Testing documents a chrysocolla-rich mixture rather than establishing that trade label as a precise mineral identification.
Finding: The tested specimen is largely chrysocolla with abundant fragmental quartz and feldspars. The report also describes an aluminum silicate that could not be narrowed to one species, plus reddish hematite-dominant fragments with possible goethite, permeated by chrysocolla.
What this report covers
This is sample 92840 (#2), completed February 22, 2022, and is a different specimen from our earlier Peru chrysocolla report. The report presents electron images, elemental spectra, and X-ray maps across six pages. Peru is the supplied source for this piece; the laboratory report does not independently establish its locality.
The laboratory's hypothetical discussion of a Southwestern U.S. setting is an analogy about how such fragments could form, not an origin determination for this specimen.
Use this guide alongside the written findings and the original report transcript. It explains the purpose of each analytical figure and preserves the laboratory’s own figure labels. The interpretations apply to the tested specimen; signals alone do not establish the identity of every similar-looking stone.
Electron microscope image: This view shows small-scale regions selected for analysis. Its brightness contrast helps distinguish regions with different compositions; it is not a photograph of their natural colors. Numbered spots connect this view to the analyses listed in the report.
Laboratory figure caption: Fig. 2: Backscattered electron images of the specimen.
Elemental spectrum: The peaks record characteristic X-ray signals from elements in the analyzed spot or area. This is an analysis of that location, not automatically of the entire specimen. Any mineral identification or uncertainty named in the laboratory caption is retained below.
Laboratory figure caption: Fig. 3: Energy dispersive spectral analysis of spot 1 in Fig. 2. (quartz)
Elemental spectrum: The peaks record characteristic X-ray signals from elements in the analyzed spot or area. This is an analysis of that location, not automatically of the entire specimen. Any mineral identification or uncertainty named in the laboratory caption is retained below.
Laboratory figure caption: Fig. 4: Energy dispersive spectral analysis of spot 2 in Fig. 2. (potassium feldspar)
Elemental spectrum: The peaks record characteristic X-ray signals from elements in the analyzed spot or area. This is an analysis of that location, not automatically of the entire specimen. Any mineral identification or uncertainty named in the laboratory caption is retained below.
Laboratory figure caption: Fig. 5: Energy dispersive spectral analysis of spot 3 in Fig. 2. (chrysocolla)
Elemental spectrum: The peaks record characteristic X-ray signals from elements in the analyzed spot or area. This is an analysis of that location, not automatically of the entire specimen. Any mineral identification or uncertainty named in the laboratory caption is retained below.
Laboratory figure caption: Fig. 6: Energy dispersive spectral analysis of spot 4 in Fig. 2. (aluminum silicate species)
Electron microscope image: This view shows small-scale regions selected for analysis. Its brightness contrast helps distinguish regions with different compositions; it is not a photograph of their natural colors. Numbered spots connect this view to the analyses listed in the report.
Laboratory figure caption: Fig. 7: Backscattered electron images of another area of the specimen.
Elemental spectrum: The peaks record characteristic X-ray signals from elements in the analyzed spot or area. This is an analysis of that location, not automatically of the entire specimen. Any mineral identification or uncertainty named in the laboratory caption is retained below.
Laboratory figure caption: Fig. 8: Energy dispersive spectral analysis of spot 1 in Fig. 5. (hematite/goethite with chrysocolla)
Electron microscope image: This view shows small-scale regions selected for analysis. Its brightness contrast helps distinguish regions with different compositions; it is not a photograph of their natural colors. Numbered spots connect this view to the analyses listed in the report.
Laboratory figure caption: Fig. 9: Backscattered electron images of the area shown in Fig. 2. Left: Copper: green, potasium: purple. Right: Silicon: red, aluminum: blue.
Electron microscope image: This view shows small-scale regions selected for analysis. Its brightness contrast helps distinguish regions with different compositions; it is not a photograph of their natural colors. Numbered spots connect this view to the analyses listed in the report.
Laboratory figure caption: Fig. 10: Backscattered electron image of the area shown in Fig. 7. Copper: green, iron: yellow.
Read the report as text
This text is transcribed from the laboratory report so the findings and figure captions can be read without opening the page images. The images remain available above for visual details.
Laboratory report
                                               Analytical Result Report

Sample id: 92840 (#2)
Submitted by: K. Bitner
Date submitted: Feb. 14, 2022.
Date completed: Feb. 22, 2022.
Operating conditions: An AMRAY 1830 SEM operated at 25 kV acceleration potential, 26 mm working distance, 15
degrees sample tilt, coated with 250 Å carbon. Using the X-ray fluorescence attachment with 35 kV potential in
conjunction with the EDS system.


Fig. 1: Photograph of the specimen. 5cm maximum dimension.


Fig. 2: Backscattered electron images of the specimen.
Fig. 3: Energy dispersive spectral analysis of spot 1 in Fig. 2. (quartz)


Fig. 4: Energy dispersive spectral analysis of spot 2 in Fig. 2. (potassium feldspar)
Fig. 5: Energy dispersive spectral analysis of spot 3 in Fig. 2. (chrysocolla)


Fig. 6: Energy dispersive spectral analysis of spot 4 in Fig. 2. (aluminum silicate species)
Fig. 7: Backscattered electron images of another area of the specimen.


Fig. 8: Energy dispersive spectral analysis of spot 1 in Fig. 5. (hematite/goethite with chrysocolla)
Fig. 9: Backscattered electron images of the area shown in Fig. 2. Left: Copper: green, potasium: purple. Right: Silicon:
red, aluminum: blue.


Fig. 10: Backscattered electron image of the area shown in Fig. 7. Copper: green, iron: yellow.


Table 1: Minor and trace element composition of the specimen. (in wt. %).

 Aluminum                                                      6.3
 Calcium                                                       0.33
 Chromium                                                      0.04
 Iron                                                          0.8
 Magnesium                                                     0.2
 Manganese                                                     0.06
 Phosphorus                                                    0.02
 Sulfur                                                        0.02
 Titanium                                                      0.05
 Vanadium                                                      0.04
 Zinc                                                          0.03


Summary of findings: This specimen (Fig. 1) is Composed largely of chrysocolla (Figs. 2, 6 and 9) with a lot of fragmental
quartz (Figs. 2, 3 and 9), feldspars (Figs. 2, 4 and 9), (these may have come from a fragmented rhyolite) an aluminum
silicate which may be andalusite, kyanite, or sillimanite but it may also be topaz (Figs. 2, 5 and 9). The reddish pieces are
pieces dominantly composed of hematite with possible goethite present (Figs. 7, 8 and 10). They are permeated with
chrysocolla. If this material has been mined in the Southwestern US, the admixed fragmental pieces in the chrysocolla
could have come from topaz rhyolite. We ran across a situation quite similar to this and published it in 2019 April-May
issue of Rocks and Minerals, Vol 94, 185: ‘Surprising find of spessartine from the Finch mine, Hayden area, Gila Co.,
Arizona by Dallaire, Falster and Simmons. Trace and minor elements are shown in Table 1.


Date: February 22, 2022                         Signature
Material marketed as “Blue Scheelite” and supplied as a newer find from Turkey was submitted for analysis. The name emphasizes a mineral that makes up only a small part of the tested piece.
Finding: The specimen is predominantly dolomite. The laboratory found scheelite grains, but estimated their contribution at well below 1% of the sample.
The name and the testing
The miner used the name “Blue Scheelite” and, in conversation, described the material as containing calcite and dolomite without testing it. Our submitted specimen tested predominantly as dolomite with scheelite grains present at well below 1%. The report did not identify calcite in this analyzed piece. That is why the name and informal description are presented as history rather than a composition guarantee.
What the report shows
Sample 92854 (#14) is an approximately 11 cm banded specimen. The laboratory used electron imaging, elemental analysis, and X-ray mapping. It described an assemblage compatible with a hydrothermal vein setting, while discussing a skarn setting as another possibility. Its reported trace tungsten does not make scheelite the dominant material.
Turkey and a trade introduction around 2018 are supplied background, not independently verified by this laboratory report. The findings apply to the submitted piece; other material sold as Blue Scheelite may differ.
View the original report
Select any page to enlarge it. 4 pages, in report order.
Use this guide alongside the written findings and the original report transcript. It explains the purpose of each analytical figure and preserves the laboratory’s own figure labels. The interpretations apply to the tested specimen; signals alone do not establish the identity of every similar-looking stone.
Electron microscope image: This view shows small-scale regions selected for analysis. Its brightness contrast helps distinguish regions with different compositions; it is not a photograph of their natural colors. Numbered spots connect this view to the analyses listed in the report.
Laboratory figure caption: Fig. 2: Backscattered electron images of the specimen.
Elemental spectrum: The peaks record characteristic X-ray signals from elements in the analyzed spot or area. This is an analysis of that location, not automatically of the entire specimen. Any mineral identification or uncertainty named in the laboratory caption is retained below.
Laboratory figure caption: Fig. 3: Energy dispersive spectral analysis of spot 1 in Fig. 2. (dolomite)
Electron microscope image: This view shows small-scale regions selected for analysis. Its brightness contrast helps distinguish regions with different compositions; it is not a photograph of their natural colors. Numbered spots connect this view to the analyses listed in the report.
Laboratory figure caption: Fig. 4: Backscattered electron images of the specimen.
Elemental spectrum: The peaks record characteristic X-ray signals from elements in the analyzed spot or area. This is an analysis of that location, not automatically of the entire specimen. Any mineral identification or uncertainty named in the laboratory caption is retained below.
Laboratory figure caption: Fig. 5: Energy dispersive spectral analysis of spot 1 in Fig. 4. (scheelite)
Element map: This map shows where the named elements occur within the analyzed area. Its colors represent the laboratory’s selected element channels, rather than the specimen’s visible colors. The caption below preserves any color key or distribution noted by the laboratory.
Laboratory figure caption: Fig. 6: X-ray maps of the area shown in Fig. 2: Magnesium-red, calcium-green, iron-blue. Iron is shown on the left iamges as well but to show it more clearly, it is shown by itself on the right once more.
Read the report as text
This text is transcribed from the laboratory report so the findings and figure captions can be read without opening the page images. The images remain available above for visual details.
Laboratory report
                                               Analytical Result Report

Sample id: 92854 (#14)
Submitted by: K. Bitner
Date submitted: Feb. 14, 2022.
Date completed: March 7, 2022.
Operating conditions: An AMRAY 1830 SEM operated at 25 kV acceleration potential, 26 mm working distance, 15
degrees sample tilt, coated with 250 Å carbon. Using the X-ray fluorescence attachment with 35 kV potential in
conjunction with the EDS system.


Fig. 1: Photograph of the specimen. 11 cm maximum dimensions.


Fig. 2: Backscattered electron images of the specimen.
Fig. 3: Energy dispersive spectral analysis of spot 1 in Fig. 2. (dolomite)


Fig. 4: Backscattered electron images of the specimen.
Fig. 5: Energy dispersive spectral analysis of spot 1 in Fig. 4. (scheelite)


Fig. 6: X-ray maps of the area shown in Fig. 2: Magnesium-red, calcium-green, iron-blue. Iron is shown on the left
iamges as well but to show it more clearly, it is shown by itself on the right once more.


Table 1: Minor and trace element composition of the specimen. (in wt. %).

 Iron                                                             0.92
 Manganese                                                        0.02
 Titanium                                                         0.01
 Tungsten                                                         0.12


Summary of findings: This specimen (Fig. 1) is composed dominantly of dolomite (Figs. 2 and 3). The material is clearly
banded (Figs. 1 and 6) which is part caused by iron but by the grain size. This is likely derived from a hydrothermal vein
type assemblage where such banding is common. Another possibility is a skarn body where banding is also common but
the differing grain sizes are not typical for that environment whereas scheelite would fir in either case. There are some
bright grains visible in backscattered electron images (Figs. 2, 4 and 5), they are scheelite! However, the scheelite
contribution of the sample is well below 1 %! (Table 1).


Date: March 5, 2022                         Signature
Gem Lepidolite Dragon Spheres · Soul Body Gems, June 2024.
These two reports examine different examples of gem-like lepidolite: a raw zoned piece with a purple lepidolite rim and muscovite core, and a separately tested polished piece.
Two specimens: The raw piece documents lepidolite alongside muscovite. The polished piece was identified as lepidolite. Their results should remain tied to each specimen.
Raw zoned mica: purple and pale zones
The May 8, 2020 report examined a 5.3 cm raw mica specimen (sample 9006). It identifies the purple rim as lepidolite and the pale core as muscovite. The direct current plasma analysis reported about 6.7 wt.% Li₂O in the lepidolite zone and about 0.8–1.2 wt.% Li₂O in the muscovite zone. The report calls the core colorless; the yellow appearance of the material is a visual description, not a separate mineral identification.
Raw specimen report, three pages. Select a page to enlarge.
A second, polished specimen (sample 92857, #13; report completed March 10, 2022) was chemically identified as lepidolite. The laboratory remarked on the unusual cut for a mica. Thin bubble-like features followed cleavage planes. After a mild heating observation, the report considered a stabilizing resin more likely than trapped water, but did not establish that interpretation conclusively.
Polished specimen report, four pages. Select a page to enlarge.
Use this guide alongside the written findings and the original report transcript. It explains the purpose of each analytical figure and preserves the laboratory’s own figure labels. The interpretations apply to the tested specimen; signals alone do not establish the identity of every similar-looking stone.
Elemental spectrum: The peaks record characteristic X-ray signals from elements in the analyzed spot or area. This is an analysis of that location, not automatically of the entire specimen. Any mineral identification or uncertainty named in the laboratory caption is retained below.
Laboratory figure caption: Fig. 2: Energy dispersive spectrum of point 1 in the purplish rim of the specimen. (lepidolite)
Elemental spectrum: The peaks record characteristic X-ray signals from elements in the analyzed spot or area. This is an analysis of that location, not automatically of the entire specimen. Any mineral identification or uncertainty named in the laboratory caption is retained below.
Laboratory figure caption: Fig. 3: Energy dispersive spectrum of point 2 in the colorless core of the specimen. (muscovite)
Electron microscope image: This view shows small-scale regions selected for analysis. Its brightness contrast helps distinguish regions with different compositions; it is not a photograph of their natural colors. Numbered spots connect this view to the analyses listed in the report.
Laboratory figure caption: Fig. 2: Backscattered electron image of the specimen.
Elemental spectrum: The peaks record characteristic X-ray signals from elements in the analyzed spot or area. This is an analysis of that location, not automatically of the entire specimen. Any mineral identification or uncertainty named in the laboratory caption is retained below.
Laboratory figure caption: Fig. 3: Energy dispersive spectral analysis of spot 1 in Fig. 2. (lepidolite)
Elemental spectrum: The peaks record characteristic X-ray signals from elements in the analyzed spot or area. This is an analysis of that location, not automatically of the entire specimen. Any mineral identification or uncertainty named in the laboratory caption is retained below.
Laboratory figure caption: Fig. 4: Energy dispersive spectral analysis of spot 2 in Fig. 2. (lepidolite)
Read the reports as text
This text is transcribed from the laboratory reports so the findings and figure captions can be read without opening the page images. The images remain available above for visual details.
Raw zoned mica report
                                                 Analytical Result Report

Sample id: 9006
Submitted by: Kathreen Bitner
Date submitted: May 4, 2020
Date completed: May 8, 2020
Operating conditions: JEOL JSM-6400 operated at 25 kV acceleration potential, 15 mm working distance, 15 degrees
sample tilt, coated with 250 Å carbon. Using the X-ray fluorescence attacement with 35kv potental in conjunction with
the EDS system


Fig 1: Photograph showing the distinct zonation in the mica specimen, maximum dimension 5.3 cm.


Fig. 2: Energy dispersive spectrum of point 1 in the purplish rim of the specimen. (lepidolite)
Fig. 3: Energy dispersive spectrum of point 2 in the colorless core of the specimen. (muscovite)


Fig. 4: Overlay of the spectra shown in Figs. 2 and 3, scrolled down to the lower energy end of the spectrum.


Summary of findings: This is a very interesting specimen with dramatic color zoning. Two areas were selected for EDS
analysis (Fig. 1). The rim is clearly lepidolite, indicated by the distinctly higher amount of silicon and fluorine (Figs. 2 and
4), whereas the rim shows the typical higher aluminum content and lower fluorine typical for muscovite (Figs. 3 and 4).
Lithium analysis by direct current plasma spectrometry showed that the lepidolite contains about 6.7 wt. % Li 2O,
whereas the muscovite area only shows around 0.8-1.2 wt. % Li 2O.


Date: May 8..2020                        Signature
Polished lepidolite report
                                               Analytical Result Report

Sample id: 92857 (#13)
Submitted by: K. Bitner
Date submitted: Feb. 14, 2022.
Date completed: March 10, 2022.
Operating conditions: An AMRAY 1830 SEM operated at 25 kV acceleration potential, 26 mm working distance, 15
degrees sample tilt, coated with 250 Å carbon. Using the X-ray fluorescence attachment with 35 kV potential in
conjunction with the EDS system.


Fig. 1: Photograph of the specimen. 3.4 cm maximum dimensions.


Fig. 2: Backscattered electron image of the specimen.
Fig. 3: Energy dispersive spectral analysis of spot 1 in Fig. 2. (lepidolite)


Fig. 4: Energy dispersive spectral analysis of spot 2 in Fig. 2. (lepidolite)
Fig. 5: Two sets of photomicrographs showing different focal positions. It shows that the bubble-like features are very
thin. Images were taken in monochrome since it enhances the structures better.


Table 1: Minor and trace element composition of the specimen. (in wt. %).

 Fluorine                                                     7.0
 Iron                                                         0.04
 Manganese                                                    0.23
 Rubidium                                                     1.2
 K/Rb                                                         8
Fig. 6: Two images, the right one was taken 3 hours after heating to 90 C.


Summary of findings: This specimen (Fig. 1) is interesting and very unusual for its cut. This is quite a feat to do with a
mica! Chemically, it clearly is lepidolite (Figs. 2-4 and Table 1). The high fluorine is typical for lepidolite. The Rubidium
content is high which is typical for pegmatites producing lepidolite. The odd bubble-like structures are very interesting.
They are very thin (Fig. 5) and appear to follow the cleavage planes. They lake gas bubbles so they are not fluid
inclusions that were trapped during crystal growth but appear to be water that migrated into the spaces where the
lepidolite had separated a little along cleavage planes. Since the space was very thing, this water or other fluid could
remain in there for a considerable amount of time.

Update: A simple experiment designed to identify if water was present that causes the bubble-like shapes involved
heating the specimen for 3 hours at 90 F (Fig. 6). Only minor change occurred, and many boundaries appeared exactly
the same. Only one small area showed a little change in shape. It does not appear to be water that is causing the
bubble shapes, it is more likely to be some kind or resin that might have been used to stabilize the specimen.


Date: March 5, 2022                          Signature
Gem Lepidolite Dragon Spheres · Soul Body Gems, June 2024.
These two reports examine different examples of gem-like lepidolite: a raw zoned piece with a purple lepidolite rim and muscovite core, and a separately tested polished piece.
Two specimens: The raw piece documents lepidolite alongside muscovite. The polished piece was identified as lepidolite. Their results should remain tied to each specimen.
Raw zoned mica: purple and pale zones
The May 8, 2020 report examined a 5.3 cm raw mica specimen (sample 9006). It identifies the purple rim as lepidolite and the pale core as muscovite. The direct current plasma analysis reported about 6.7 wt.% Li₂O in the lepidolite zone and about 0.8–1.2 wt.% Li₂O in the muscovite zone. The report calls the core colorless; the yellow appearance of the material is a visual description, not a separate mineral identification.
Raw specimen report, three pages. Select a page to enlarge.
A second, polished specimen (sample 92857, #13; report completed March 10, 2022) was chemically identified as lepidolite. The laboratory remarked on the unusual cut for a mica. Thin bubble-like features followed cleavage planes. After a mild heating observation, the report considered a stabilizing resin more likely than trapped water, but did not establish that interpretation conclusively.
Polished specimen report, four pages. Select a page to enlarge.
Use this guide alongside the written findings and the original report transcript. It explains the purpose of each analytical figure and preserves the laboratory’s own figure labels. The interpretations apply to the tested specimen; signals alone do not establish the identity of every similar-looking stone.
Elemental spectrum: The peaks record characteristic X-ray signals from elements in the analyzed spot or area. This is an analysis of that location, not automatically of the entire specimen. Any mineral identification or uncertainty named in the laboratory caption is retained below.
Laboratory figure caption: Fig. 2: Energy dispersive spectrum of point 1 in the purplish rim of the specimen. (lepidolite)
Elemental spectrum: The peaks record characteristic X-ray signals from elements in the analyzed spot or area. This is an analysis of that location, not automatically of the entire specimen. Any mineral identification or uncertainty named in the laboratory caption is retained below.
Laboratory figure caption: Fig. 3: Energy dispersive spectrum of point 2 in the colorless core of the specimen. (muscovite)
Electron microscope image: This view shows small-scale regions selected for analysis. Its brightness contrast helps distinguish regions with different compositions; it is not a photograph of their natural colors. Numbered spots connect this view to the analyses listed in the report.
Laboratory figure caption: Fig. 2: Backscattered electron image of the specimen.
Elemental spectrum: The peaks record characteristic X-ray signals from elements in the analyzed spot or area. This is an analysis of that location, not automatically of the entire specimen. Any mineral identification or uncertainty named in the laboratory caption is retained below.
Laboratory figure caption: Fig. 3: Energy dispersive spectral analysis of spot 1 in Fig. 2. (lepidolite)
Elemental spectrum: The peaks record characteristic X-ray signals from elements in the analyzed spot or area. This is an analysis of that location, not automatically of the entire specimen. Any mineral identification or uncertainty named in the laboratory caption is retained below.
Laboratory figure caption: Fig. 4: Energy dispersive spectral analysis of spot 2 in Fig. 2. (lepidolite)
Read the reports as text
This text is transcribed from the laboratory reports so the findings and figure captions can be read without opening the page images. The images remain available above for visual details.
Raw zoned mica report
                                                 Analytical Result Report

Sample id: 9006
Submitted by: Kathreen Bitner
Date submitted: May 4, 2020
Date completed: May 8, 2020
Operating conditions: JEOL JSM-6400 operated at 25 kV acceleration potential, 15 mm working distance, 15 degrees
sample tilt, coated with 250 Å carbon. Using the X-ray fluorescence attacement with 35kv potental in conjunction with
the EDS system


Fig 1: Photograph showing the distinct zonation in the mica specimen, maximum dimension 5.3 cm.


Fig. 2: Energy dispersive spectrum of point 1 in the purplish rim of the specimen. (lepidolite)
Fig. 3: Energy dispersive spectrum of point 2 in the colorless core of the specimen. (muscovite)


Fig. 4: Overlay of the spectra shown in Figs. 2 and 3, scrolled down to the lower energy end of the spectrum.


Summary of findings: This is a very interesting specimen with dramatic color zoning. Two areas were selected for EDS
analysis (Fig. 1). The rim is clearly lepidolite, indicated by the distinctly higher amount of silicon and fluorine (Figs. 2 and
4), whereas the rim shows the typical higher aluminum content and lower fluorine typical for muscovite (Figs. 3 and 4).
Lithium analysis by direct current plasma spectrometry showed that the lepidolite contains about 6.7 wt. % Li 2O,
whereas the muscovite area only shows around 0.8-1.2 wt. % Li 2O.


Date: May 8..2020                        Signature
Polished lepidolite report
                                               Analytical Result Report

Sample id: 92857 (#13)
Submitted by: K. Bitner
Date submitted: Feb. 14, 2022.
Date completed: March 10, 2022.
Operating conditions: An AMRAY 1830 SEM operated at 25 kV acceleration potential, 26 mm working distance, 15
degrees sample tilt, coated with 250 Å carbon. Using the X-ray fluorescence attachment with 35 kV potential in
conjunction with the EDS system.


Fig. 1: Photograph of the specimen. 3.4 cm maximum dimensions.


Fig. 2: Backscattered electron image of the specimen.
Fig. 3: Energy dispersive spectral analysis of spot 1 in Fig. 2. (lepidolite)


Fig. 4: Energy dispersive spectral analysis of spot 2 in Fig. 2. (lepidolite)
Fig. 5: Two sets of photomicrographs showing different focal positions. It shows that the bubble-like features are very
thin. Images were taken in monochrome since it enhances the structures better.


Table 1: Minor and trace element composition of the specimen. (in wt. %).

 Fluorine                                                     7.0
 Iron                                                         0.04
 Manganese                                                    0.23
 Rubidium                                                     1.2
 K/Rb                                                         8
Fig. 6: Two images, the right one was taken 3 hours after heating to 90 C.


Summary of findings: This specimen (Fig. 1) is interesting and very unusual for its cut. This is quite a feat to do with a
mica! Chemically, it clearly is lepidolite (Figs. 2-4 and Table 1). The high fluorine is typical for lepidolite. The Rubidium
content is high which is typical for pegmatites producing lepidolite. The odd bubble-like structures are very interesting.
They are very thin (Fig. 5) and appear to follow the cleavage planes. They lake gas bubbles so they are not fluid
inclusions that were trapped during crystal growth but appear to be water that migrated into the spaces where the
lepidolite had separated a little along cleavage planes. Since the space was very thing, this water or other fluid could
remain in there for a considerable amount of time.

Update: A simple experiment designed to identify if water was present that causes the bubble-like shapes involved
heating the specimen for 3 hours at 90 F (Fig. 6). Only minor change occurred, and many boundaries appeared exactly
the same. Only one small area showed a little change in shape. It does not appear to be water that is causing the
bubble shapes, it is more likely to be some kind or resin that might have been used to stabilize the specimen.


Date: March 5, 2022                          Signature
Raw zoned mica specimen · edited display photo. Original photograph preserved in the report below.
This raw mica specimen has a pale, yellow-appearing center surrounded by a purple rim. Testing separated the two zones: muscovite at the center and lepidolite at the rim.
Finding: The analyzed pale core is muscovite; the purple rim is lepidolite. A visual color name alone would not distinguish the two.
Raw zoned mica: purple and pale zones
The May 8, 2020 report examined a 5.3 cm raw mica specimen (sample 9006). It identifies the purple rim as lepidolite and the pale core as muscovite. The direct current plasma analysis reported about 6.7 wt.% Li₂O in the lepidolite zone and about 0.8–1.2 wt.% Li₂O in the muscovite zone. The report calls the core colorless; the yellow appearance of the material is a visual description, not a separate mineral identification.
Raw specimen report, three pages. Select a page to enlarge.
Use this guide alongside the written findings and the original report transcript. It explains the purpose of each analytical figure and preserves the laboratory’s own figure labels. The interpretations apply to the tested specimen; signals alone do not establish the identity of every similar-looking stone.
Elemental spectrum: The peaks record characteristic X-ray signals from elements in the analyzed spot or area. This is an analysis of that location, not automatically of the entire specimen. Any mineral identification or uncertainty named in the laboratory caption is retained below.
Laboratory figure caption: Fig. 2: Energy dispersive spectrum of point 1 in the purplish rim of the specimen. (lepidolite)
Elemental spectrum: The peaks record characteristic X-ray signals from elements in the analyzed spot or area. This is an analysis of that location, not automatically of the entire specimen. Any mineral identification or uncertainty named in the laboratory caption is retained below.
Laboratory figure caption: Fig. 3: Energy dispersive spectrum of point 2 in the colorless core of the specimen. (muscovite)
Read the report as text
This text is transcribed from the laboratory report so the findings and figure captions can be read without opening the page images. The images remain available above for visual details.
Laboratory report
                                                 Analytical Result Report

Sample id: 9006
Submitted by: Kathreen Bitner
Date submitted: May 4, 2020
Date completed: May 8, 2020
Operating conditions: JEOL JSM-6400 operated at 25 kV acceleration potential, 15 mm working distance, 15 degrees
sample tilt, coated with 250 Å carbon. Using the X-ray fluorescence attacement with 35kv potental in conjunction with
the EDS system


Fig 1: Photograph showing the distinct zonation in the mica specimen, maximum dimension 5.3 cm.


Fig. 2: Energy dispersive spectrum of point 1 in the purplish rim of the specimen. (lepidolite)
Fig. 3: Energy dispersive spectrum of point 2 in the colorless core of the specimen. (muscovite)


Fig. 4: Overlay of the spectra shown in Figs. 2 and 3, scrolled down to the lower energy end of the spectrum.


Summary of findings: This is a very interesting specimen with dramatic color zoning. Two areas were selected for EDS
analysis (Fig. 1). The rim is clearly lepidolite, indicated by the distinctly higher amount of silicon and fluorine (Figs. 2 and
4), whereas the rim shows the typical higher aluminum content and lower fluorine typical for muscovite (Figs. 3 and 4).
Lithium analysis by direct current plasma spectrometry showed that the lepidolite contains about 6.7 wt. % Li 2O,
whereas the muscovite area only shows around 0.8-1.2 wt. % Li 2O.


Date: May 8..2020                        Signature
Raw zoned mica specimen · edited display photo. Original photograph preserved in the report below.
This raw mica specimen has a pale, yellow-appearing center surrounded by a purple rim. Testing separated the two zones: muscovite at the center and lepidolite at the rim.
Finding: The analyzed pale core is muscovite; the purple rim is lepidolite. A visual color name alone would not distinguish the two.
Raw zoned mica: purple and pale zones
The May 8, 2020 report examined a 5.3 cm raw mica specimen (sample 9006). It identifies the purple rim as lepidolite and the pale core as muscovite. The direct current plasma analysis reported about 6.7 wt.% Li₂O in the lepidolite zone and about 0.8–1.2 wt.% Li₂O in the muscovite zone. The report calls the core colorless; the yellow appearance of the material is a visual description, not a separate mineral identification.
Raw specimen report, three pages. Select a page to enlarge.
Use this guide alongside the written findings and the original report transcript. It explains the purpose of each analytical figure and preserves the laboratory’s own figure labels. The interpretations apply to the tested specimen; signals alone do not establish the identity of every similar-looking stone.
Elemental spectrum: The peaks record characteristic X-ray signals from elements in the analyzed spot or area. This is an analysis of that location, not automatically of the entire specimen. Any mineral identification or uncertainty named in the laboratory caption is retained below.
Laboratory figure caption: Fig. 2: Energy dispersive spectrum of point 1 in the purplish rim of the specimen. (lepidolite)
Elemental spectrum: The peaks record characteristic X-ray signals from elements in the analyzed spot or area. This is an analysis of that location, not automatically of the entire specimen. Any mineral identification or uncertainty named in the laboratory caption is retained below.
Laboratory figure caption: Fig. 3: Energy dispersive spectrum of point 2 in the colorless core of the specimen. (muscovite)
Read the report as text
This text is transcribed from the laboratory report so the findings and figure captions can be read without opening the page images. The images remain available above for visual details.
Laboratory report
                                                 Analytical Result Report

Sample id: 9006
Submitted by: Kathreen Bitner
Date submitted: May 4, 2020
Date completed: May 8, 2020
Operating conditions: JEOL JSM-6400 operated at 25 kV acceleration potential, 15 mm working distance, 15 degrees
sample tilt, coated with 250 Å carbon. Using the X-ray fluorescence attacement with 35kv potental in conjunction with
the EDS system


Fig 1: Photograph showing the distinct zonation in the mica specimen, maximum dimension 5.3 cm.


Fig. 2: Energy dispersive spectrum of point 1 in the purplish rim of the specimen. (lepidolite)
Fig. 3: Energy dispersive spectrum of point 2 in the colorless core of the specimen. (muscovite)


Fig. 4: Overlay of the spectra shown in Figs. 2 and 3, scrolled down to the lower energy end of the spectrum.


Summary of findings: This is a very interesting specimen with dramatic color zoning. Two areas were selected for EDS
analysis (Fig. 1). The rim is clearly lepidolite, indicated by the distinctly higher amount of silicon and fluorine (Figs. 2 and
4), whereas the rim shows the typical higher aluminum content and lower fluorine typical for muscovite (Figs. 3 and 4).
Lithium analysis by direct current plasma spectrometry showed that the lepidolite contains about 6.7 wt. % Li 2O,
whereas the muscovite area only shows around 0.8-1.2 wt. % Li 2O.


Date: May 8..2020                        Signature
A specimen supplied as Ruby Kyanite from India was tested to identify its blue host and red grains.
Finding: The bulk is kyanite. The red areas include corundum, which fluoresced red under ultraviolet light. The report also identifies chromium-bearing muscovite (often called fuchsite) and a likely titanium oxide such as rutile.
Sample 92855 (#10), approximately 9 cm, was reported March 9, 2022. The report describes mineral chemistry and a high-pressure metamorphic assemblage; India is the supplied locality, not an origin independently proven by the test.
View the original report
Select a page to enlarge it. 5 pages in report order.
Use this guide alongside the written findings and the original report transcript. It explains the purpose of each analytical figure and preserves the laboratory’s own figure labels. The interpretations apply to the tested specimen; signals alone do not establish the identity of every similar-looking stone.
Electron microscope image: This view shows small-scale regions selected for analysis. Its brightness contrast helps distinguish regions with different compositions; it is not a photograph of their natural colors. Numbered spots connect this view to the analyses listed in the report.
Laboratory figure caption: Fig. 2: Backscattered electron image of the specimen.
Elemental spectrum: The peaks record characteristic X-ray signals from elements in the analyzed spot or area. This is an analysis of that location, not automatically of the entire specimen. Any mineral identification or uncertainty named in the laboratory caption is retained below.
Laboratory figure caption: Fig. 3: Energy dispersive spectral analysis of spot 1 in Fig. 2. (Ti oxide such as rutile)
Elemental spectrum: The peaks record characteristic X-ray signals from elements in the analyzed spot or area. This is an analysis of that location, not automatically of the entire specimen. Any mineral identification or uncertainty named in the laboratory caption is retained below.
Laboratory figure caption: Fig. 4: Energy dispersive spectral analysis of spot 2 in Fig. 2. (muscovite, chromian)
Elemental spectrum: The peaks record characteristic X-ray signals from elements in the analyzed spot or area. This is an analysis of that location, not automatically of the entire specimen. Any mineral identification or uncertainty named in the laboratory caption is retained below.
Laboratory figure caption: Fig. 5: Energy dispersive spectral analysis of spot 3 in Fig. 2. (aluminum silicate – kyanite)
Electron microscope image: This view shows small-scale regions selected for analysis. Its brightness contrast helps distinguish regions with different compositions; it is not a photograph of their natural colors. Numbered spots connect this view to the analyses listed in the report.
Laboratory figure caption: Fig. 6: Backscattered electron image of another area of the specimen.
Elemental spectrum: The peaks record characteristic X-ray signals from elements in the analyzed spot or area. This is an analysis of that location, not automatically of the entire specimen. Any mineral identification or uncertainty named in the laboratory caption is retained below.
Laboratory figure caption: Fig. 7: Energy dispersive spectral analysis of spot 1 in Fig. 6. (corundum)
Element map: This map shows where the named elements occur within the analyzed area. Its colors represent the laboratory’s selected element channels, rather than the specimen’s visible colors. The caption below preserves any color key or distribution noted by the laboratory.
Laboratory figure caption: Fig. 8: X-ray maps of the area shown in Fig. 2: Silicon: green, aluminum: red, titanium: blue.
Read the report as text
This text is transcribed from the laboratory report so the findings and figure captions can be read without opening the page images. The images remain available above for visual details.
Laboratory report
                                               Analytical Result Report

Sample id: 92855 (#10)
Submitted by: K. Bitner
Date submitted: Feb. 14, 2022.
Date completed: March 9, 2022.
Operating conditions: An AMRAY 1830 SEM operated at 25 kV acceleration potential, 26 mm working distance, 15
degrees sample tilt, coated with 250 Å carbon. Using the X-ray fluorescence attachment with 35 kV potential in
conjunction with the EDS system.


Fig. 1: Photograph of the specimen. 9 cm maximum dimensions.


Fig. 2: Backscattered electron image of the specimen.
Fig. 3: Energy dispersive spectral analysis of spot 1 in Fig. 2. (Ti oxide such as rutile)


Fig. 4: Energy dispersive spectral analysis of spot 2 in Fig. 2. (muscovite, chromian)
Fig. 5: Energy dispersive spectral analysis of spot 3 in Fig. 2. (aluminum silicate – kyanite)


Fig. 6: Backscattered electron image of another area of the specimen.
Fig. 7: Energy dispersive spectral analysis of spot 1 in Fig. 6. (corundum)


Fig. 8: X-ray maps of the area shown in Fig. 2: Silicon: green, aluminum: red, titanium: blue.


Fig. 9: image under ultraviolet light showing red fluorescence of the corundum.


Table 1: Minor and trace element composition of the specimen. (in wt. %).
 Calcium                                                     0.14
 Chromium                                                    0.22
 Iron                                                        0.16
 Magnesium                                                   0.13
 Manganese                                                   0.02
 Phosphorus                                                  0.01
 Sodium                                                      0.19
 Titanium                                                    1.15


Summary of findings: This specimen (Fig. 1) is composed mainly of kyanite (Figs. 2 and 5), corundum (Figs. 6 and 7) and
some muscovite. (Figs. 2 and 4) and a titanium oxide species, likely rutile (Figs 2 and 3). The muscovite is chromium-
bearing and frequently called ’fuchsite’). The assemblage with kyanite indicates high pressure and low to medium
temperature during metamorphism. Continent-continent collisional margins would be a good source of material like
this. The X-ray map (Fig. 8) shows the distribution of the main elements clearly. The bulk material is kyanite. The
corundum is UV fluorescent (Fig. 9) which is caused by a small amount of chromium which is present in the material
(Table 1).


Date: March 5, 2022                       Signature
A pale blue banded agate supplied from Namibia was examined to confirm its material and investigate whether the color had been added.
Finding: The tested specimen is essentially quartz (agate). A methylene chloride and acetone leaching test produced no change, and the report says it does not appear to have been impregnated or dyed.
The 2.8 cm specimen, sample 92861 (#12), was reported March 11, 2022. The result applies to this specimen; Namibia is the supplied locality, not a geographic determination from the analysis.
View the original report
Select a page to enlarge it. 2 pages in report order.
Use this guide alongside the written findings and the original report transcript. It explains the purpose of each analytical figure and preserves the laboratory’s own figure labels. The interpretations apply to the tested specimen; signals alone do not establish the identity of every similar-looking stone.
Electron microscope image: This view shows small-scale regions selected for analysis. Its brightness contrast helps distinguish regions with different compositions; it is not a photograph of their natural colors. Numbered spots connect this view to the analyses listed in the report.
Laboratory figure caption: Fig. 2: Backscattered electron image of the specimen.
Elemental spectrum: The peaks record characteristic X-ray signals from elements in the analyzed spot or area. This is an analysis of that location, not automatically of the entire specimen. Any mineral identification or uncertainty named in the laboratory caption is retained below.
Laboratory figure caption: Fig. 3: Energy dispersive spectral analysis of spot 1 in Fig. 2. (quartz)
Read the report as text
This text is transcribed from the laboratory report so the findings and figure captions can be read without opening the page images. The images remain available above for visual details.
Laboratory report
                                               Analytical Result Report

Sample id: 92861 (#12)
Submitted by: K. Bitner
Date submitted: Feb. 14, 2022.
Date completed: March 11, 2022.
Operating conditions: An AMRAY 1830 SEM operated at 25 kV acceleration potential, 26 mm working distance, 15
degrees sample tilt, coated with 250 Å carbon. Using the X-ray fluorescence attachment with 35 kV potential in
conjunction with the EDS system.


Fig. 1: Photograph of the specimen. 2.8 cm maximum dimensions.


Fig. 2: Backscattered electron image of the specimen.
Fig. 3: Energy dispersive spectral analysis of spot 1 in Fig. 2. (quartz)


Table 1: Minor and trace element composition of the specimen. (in wt. %).

 Aluminum                                                         0.4
 Iron                                                             0.02
 Potassium                                                        0.01
 Sodium                                                           0.13
 Titanium                                                         0.01


Summary of findings: This specimen (Fig. 1) is a pretty specimen of agate. Essentially, quartz (Figs. 2 and 3). Minor and
trace elements are shown in Table 1. The elements detected are typical for this material.

A test involving leaching with methylene chloride and acetone did not cause any change, it appears not to have been
impregnated or dyed.


Date: March 11, 2022                           Signature
This small Indian find looked noticeably different from Golden Healer material we had seen from Brazil and Madagascar. We tested a specimen to understand its color and inclusions.
Finding: The tested piece is quartz with a few phlogopite–biotite series mica inclusions. The brown-gold color was attributed to a little iron staining along fractures.
The approximately 6 cm sample 92840 (#10) was reported September 7, 2021. The laboratory considered a possible hydrothermal setting but did not establish a geographic origin. “Golden Healer” is a trade name, so pieces from different sources can have different inclusions and appearances.
View the original report
Select a page to enlarge it. 3 pages in report order.
Use this guide alongside the written findings and the original report transcript. It explains the purpose of each analytical figure and preserves the laboratory’s own figure labels. The interpretations apply to the tested specimen; signals alone do not establish the identity of every similar-looking stone.
Electron microscope image: This view shows small-scale regions selected for analysis. Its brightness contrast helps distinguish regions with different compositions; it is not a photograph of their natural colors. Numbered spots connect this view to the analyses listed in the report.
Laboratory figure caption: Fig. 2: Backscattered electron images of the specimen.
Elemental spectrum: The peaks record characteristic X-ray signals from elements in the analyzed spot or area. This is an analysis of that location, not automatically of the entire specimen. Any mineral identification or uncertainty named in the laboratory caption is retained below.
Laboratory figure caption: Fig. 3: Energy dispersive spectral analysis of spot 1 in Fig. 2. (quartz)
Elemental spectrum: The peaks record characteristic X-ray signals from elements in the analyzed spot or area. This is an analysis of that location, not automatically of the entire specimen. Any mineral identification or uncertainty named in the laboratory caption is retained below.
Laboratory figure caption: Fig. 4: Energy dispersive spectral analysis of spot 2 in Fig. 2. (phlogopite-biotite series)
Element map: This map shows where the named elements occur within the analyzed area. Its colors represent the laboratory’s selected element channels, rather than the specimen’s visible colors. The caption below preserves any color key or distribution noted by the laboratory.
This text is transcribed from the laboratory report so the findings and figure captions can be read without opening the page images. The images remain available above for visual details.
Laboratory report
                                               Analytical Result Report

Sample id: 92840 (#10)
Submitted by: K. Bitner
Date submitted: Aug.2, 2021.
Date completed: Sept. 7, 2021.
Operating conditions: An AMRAY 1830 SEM operated at 25 kV acceleration potential, 26 mm working distance, 15
degrees sample tilt, coated with 250 Å carbon. Using the X-ray fluorescence attachment with 35 kV potential in
conjunction with the EDS system.


Fig. 1: Photograph of the specimen. 6 cm maximum dimension.


Fig. 2: Backscattered electron images of the specimen.
Fig. 3: Energy dispersive spectral analysis of spot 1 in Fig. 2. (quartz)


Fig. 4: Energy dispersive spectral analysis of spot 2 in Fig. 2. (phlogopite-biotite series)
Fig. 4: X-ray map of Fig. 2. Silicon: orange, aluminum: green.


Table 1: Minor and trace element composition of the specimen. (in wt. %).

 Iron                                                            0.12
 Titanium                                                        0.01
 Calcium                                                         0.01
 Sullfur                                                         0.02
 Sulfur                                                          0.14


Summary of findings: This specimen (Fig. 1) is a specimen of quartz (Figs. 2 and 3) with a few inclusions of phlogopite-
biotite series micas (Figs. 2 and 4). The brown color is derived from a little iron staining along fractures. A lot of the
mica flakes appear to be aligned (Fig. 5). It is possible that this specimen was derived from hydrothermal quartz that cut
though schistose, metamorphic rocks.


Date: Sept. 7, 2021                       Signature
Genuine rhodochrosite also occurs in Peruvian material, although some pink or red material from Peru can be offered under confusing market labels. This tested example has a deeper red appearance than the bright pink and red often associated with Argentinian material.
Finding: The tested specimens contain rhodochrosite with areas of different calcium content. The report notes epoxy filler in one porous area, a common support during polishing of softer or fragile material.
Why the locality and identification matter
Our separate Rhodonite from Peru entry concerns a different tested material. Color or a seller's name alone cannot establish whether a Peruvian piece is rhodonite or rhodochrosite. Here, the report compared the specimens with a reference rhodochrosite from Peruvian hydrothermal vein assemblages and found them broadly comparable, with minor variations.
Sample 92841 (#1) was reported February 19, 2022. The results apply to the examined specimens and areas, not every rhodochrosite from Peru.
View the original report
Select a page to enlarge it. Five pages in report order.
Use this guide alongside the written findings and the original report transcript. It explains the purpose of each analytical figure and preserves the laboratory’s own figure labels. The interpretations apply to the tested specimen; signals alone do not establish the identity of every similar-looking stone.
Electron microscope image: This view shows small-scale regions selected for analysis. Its brightness contrast helps distinguish regions with different compositions; it is not a photograph of their natural colors. Numbered spots connect this view to the analyses listed in the report.
Laboratory figure caption: Fig. 2: Backscattered electron images of the specimen.
Elemental spectrum: The peaks record characteristic X-ray signals from elements in the analyzed spot or area. This is an analysis of that location, not automatically of the entire specimen. Any mineral identification or uncertainty named in the laboratory caption is retained below.
Laboratory figure caption: Fig. 3: Energy dispersive spectral analysis of spot 1 in Fig. 2. (rhodochrosite)
Elemental spectrum: The peaks record characteristic X-ray signals from elements in the analyzed spot or area. This is an analysis of that location, not automatically of the entire specimen. Any mineral identification or uncertainty named in the laboratory caption is retained below.
Laboratory figure caption: Fig. 4: Energy dispersive spectral analysis of spot 2 in Fig. 2. (epoxy filler)
Electron microscope image: This view shows small-scale regions selected for analysis. Its brightness contrast helps distinguish regions with different compositions; it is not a photograph of their natural colors. Numbered spots connect this view to the analyses listed in the report.
Laboratory figure caption: Fig. 5: Backscattered electron images of another area of the specimen.
Elemental spectrum: The peaks record characteristic X-ray signals from elements in the analyzed spot or area. This is an analysis of that location, not automatically of the entire specimen. Any mineral identification or uncertainty named in the laboratory caption is retained below.
Laboratory figure caption: Fig. 6: Energy dispersive spectral analysis of spot 2 in Fig. 5. (calcium richer rhodochrosite)
Elemental spectrum: The peaks record characteristic X-ray signals from elements in the analyzed spot or area. This is an analysis of that location, not automatically of the entire specimen. Any mineral identification or uncertainty named in the laboratory caption is retained below.
Laboratory figure caption: Fig. 7: Energy dispersive spectral analysis of spot 2 in Fig. 2. (calcium richer rhodochrosite )
Element map: This map shows where the named elements occur within the analyzed area. Its colors represent the laboratory’s selected element channels, rather than the specimen’s visible colors. The caption below preserves any color key or distribution noted by the laboratory.
Laboratory figure caption: Fig. 8: X-ray maps. Left: area 1: Calcium-red, carbon: green. Right: Manganese: red, calcium: blue
Read the report as text
This text is transcribed from the laboratory report so the findings and figure captions can be read without opening the page images. The images remain available above for visual details.
Laboratory report
                                               Analytical Result Report

Sample id: 92841 (#1)
Submitted by: K. Bitner
Date submitted: Feb. 14, 2022.
Date completed: Feb. 19, 2022.
Operating conditions: An AMRAY 1830 SEM operated at 25 kV acceleration potential, 26 mm working distance, 15
degrees sample tilt, coated with 250 Å carbon. Using the X-ray fluorescence attachment with 35 kV potential in
conjunction with the EDS system.


Fig. 1: Photograph of the specimens. 3-4.5 cm maximum dimension.


Fig. 2: Backscattered electron images of the specimen.
Fig. 3: Energy dispersive spectral analysis of spot 1 in Fig. 2. (rhodochrosite)


Fig. 4: Energy dispersive spectral analysis of spot 2 in Fig. 2. (epoxy filler)
Fig. 5: Backscattered electron images of another area of the specimen.


Fig. 6: Energy dispersive spectral analysis of spot 2 in Fig. 5. (calcium richer rhodochrosite)
Fig. 7: Energy dispersive spectral analysis of spot 2 in Fig. 2. (calcium richer rhodochrosite )


Table 1: Minor and trace element composition of the specimen. (in wt. %).

                                         Area 1                         Area 2                     Ref sample
 Calcium                                 0.91                           3.92                       1.25
 Iron                                    5.60                           3.96                       4.96
 Magnesium                               1.27                           1.50                       1.11
 Zinc                                    0.12                           0.10                       0.10


Fig. 8: X-ray maps. Left: area 1: Calcium-red, carbon: green. Right: Manganese: red, calcium: blue


Summary of findings: These specimens (Fig. 1) are very interesting. They show two distinct compositions: one area is
low calcium (Figs. 2 and 3 and Table 1) whereas the other is showing considerable higher calcium (Figs. 5-7). Area 1, Fig.
2) also shows some epoxy filling where the material was porous (Figs. 2, 4 and 8). The higher calcium area 2 shows
uniform calcium distribution, even though some of the samples show banding, the banding is not related to chemical
differences, it is likely due grain size or fluid inclusions. A sample of rhodochrosite from these hydrothermal vein
assemblages in Peru was also analyzed and the results are shown in Table 1. With some minor variations, it looks quite
comparable to these specimens.


Date: February 19, 2022                       Signature
Amethyst Root was introduced as a newer Brazilian find around 2019. Some pieces from the find were offered with hollandite inclusions; this particular tested specimen instead has striking fingerprint-like patterns.
Finding: The tested piece is natural cut quartz with an amethyst tip. Its fingerprint-like patterns are healed fractures outlined by trains of fluid inclusions. The report identifies no hollandite in the areas described.
The patterns inside
Microscopy shows the fluid inclusion trains along healed fractures. The purple color is concentrated near the termination, consistent with natural amethyst coloration in the report. Sample 92806, approximately 8 cm, was completed July 31, 2021. Brazil and the find's approximate 2019 introduction are supplied background, not independently established by the mineral analysis.
View the original report
Select a page to enlarge it. Three pages in report order.
Use this guide alongside the written findings and the original report transcript. It explains the purpose of each analytical figure and preserves the laboratory’s own figure labels. The interpretations apply to the tested specimen; signals alone do not establish the identity of every similar-looking stone.
Electron microscope image: This view shows small-scale regions selected for analysis. Its brightness contrast helps distinguish regions with different compositions; it is not a photograph of their natural colors. Numbered spots connect this view to the analyses listed in the report.
Laboratory figure caption: Fig. 2: Backscattered electron images of the specimen.
Elemental spectrum: The peaks record characteristic X-ray signals from elements in the analyzed spot or area. This is an analysis of that location, not automatically of the entire specimen. Any mineral identification or uncertainty named in the laboratory caption is retained below.
Laboratory figure caption: Fig. 3: Energy dispersive spectral analysis of spot 1 in Fig. 2. (quartz)
Read the report as text
This text is transcribed from the laboratory report so the findings and figure captions can be read without opening the page images. The images remain available above for visual details.
Laboratory report
                                               Analytical Result Report

Sample id: 92806 (amethyst)
Submitted by: K. Bitner
Date submitted: July 17, 2021.
Date completed: July 31, 2021.
Operating conditions: An AMRAY 1830 SEM operated at 25 kV acceleration potential, 26 mm working distance, 15
degrees sample tilt, coated with 250 Å carbon. Using the X-ray fluorescence attachment with 35 kV potential in
conjunction with the EDS system.


Fig. 1: Photograph of the specimen. 8 cm maximum dimension.


Fig. 2: Backscattered electron images of the specimen.
Fig. 3: Energy dispersive spectral analysis of spot 1 in Fig. 2. (quartz)


Fig. 4: Photomicrographs of healed fractures outlined by fluid inclusion trains. Left: 3 mm field of view, righ: 1 mm field
of view


Table 1: Selected minor and trace elements in the specimen, in wt. %.

 Iron                                          0.02
 Titanium                                      0.004


Summary of findings: This specimen (Fig. 1) is cut quartz (Figs.2 and 3) with amethyst tip. It is natural as it shows the
color dominantly towards the termination and the healed fractures outlined by fluid inclusions (Fig. 4) is typical. Except
for minor iron and titanium (Table 1), the material is clean quartz. A small amount of iron plus effects of natural
radiation exposure, will produce the purple color. The specimen is not radioactive, it was exposed over millions of years
by natural radiation from nearby minerals. The beta radiation from potassium minerals suffices for that.
Date: July 31, 2021   Signature
This distinctive Kazakhstan material was offered as Strawberry Quartz from a small find that our sourcing information describes as mined out. The laboratory examined the red inclusions in the submitted piece.
Finding: The host is quartz. Thin, bladed hematite crystals grew late in the quartz's development and outline a phantom, producing the red color seen in the tested specimen.
The report identifies sample 9144 as “strawberry quartz” and was completed August 4, 2020. The attached file had an unrelated filename, but the report content and sample identification are for this material. Kazakhstan and the find history are supplied background, not geographic determinations from the analysis.
View the original report
Select a page to enlarge it. Two pages in report order.
Use this guide alongside the written findings and the original report transcript. It explains the purpose of each analytical figure and preserves the laboratory’s own figure labels. The interpretations apply to the tested specimen; signals alone do not establish the identity of every similar-looking stone.
Electron microscope image: This view shows small-scale regions selected for analysis. Its brightness contrast helps distinguish regions with different compositions; it is not a photograph of their natural colors. Numbered spots connect this view to the analyses listed in the report.
Laboratory figure caption: Fig. 1: Backscattered electron image (strawberry quartz)
Elemental spectrum: The peaks record characteristic X-ray signals from elements in the analyzed spot or area. This is an analysis of that location, not automatically of the entire specimen. Any mineral identification or uncertainty named in the laboratory caption is retained below.
Laboratory figure caption: Fig. 2: Energy dispersive spectrum of spot 1 in Fig. 1. (quartz)
Elemental spectrum: The peaks record characteristic X-ray signals from elements in the analyzed spot or area. This is an analysis of that location, not automatically of the entire specimen. Any mineral identification or uncertainty named in the laboratory caption is retained below.
Laboratory figure caption: Fig. 3: Energy dispersive spectrum of spot 2 in Fig. 1. (hematite)
Read the report as text
This transcription makes the laboratory findings and figure captions available without opening the page images.
                                                  Analytical Result Report

Sample id: 9144 (strawberry quartz)
Submitted by: K.Bitner
Date submitted: July 31, 2020
Date completed: August 4, 2020
Operating conditions: JEOL JSM-6400 operated at 25 kV acceleration potential, 15 mm working distance, 15 degrees
sample tilt, coated with 250 Å carbon. Using the X-ray fluorescence attachment with 35kv potental in conjunction with
the EDS system.


        2


                      1


Fig. 1: Backscattered electron image (strawberry quartz)


Fig. 2: Energy dispersive spectrum of spot 1 in Fig. 1. (quartz)
Fig. 3: Energy dispersive spectrum of spot 2 in Fig. 1. (hematite)


Fig. 4: Photomicrographs of the hematite inclusions. Left: 1500 microns across field of view, right: 700 microns across.

Summary of findings: This is a beautiful piece! It shows growth of thin bladed hematite crystals during the last stage of
quartz growth, essentially, the hematite is outlining a phantom. The hematite growth was likely rapid, the elongated
crystal shape is suggestive of rapid growth. The hematite bladed are very thin, thus they have the beautiful red color.


Date: August 4 ,2020                         Signature
Rhodochrosite Bracelet · Soul Body Gems, October 2024.
One small sphere can hold an entire mineral story.
What the report found: The tested 28 mm sphere is mainly rhodochrosite, with minor siderite and calcite and very minor magnesite. Its dark areas include sphalerite, with lesser galena and chalcopyrite.
The laboratory also noted silver in the galena and trace elements in associated minerals. The variety packed into this small specimen is what makes the report so fascinating. These findings describe the sphere tested, not every Argentine rhodochrosite.
View the original report
Select a page to enlarge it. The text transcript below provides another way to read the findings.
Use this guide alongside the written findings and the original report transcript. It explains the purpose of each analytical figure and preserves the laboratory’s own figure labels. The interpretations apply to the tested specimen; signals alone do not establish the identity of every similar-looking stone.
Electron microscope image: This view shows small-scale regions selected for analysis. Its brightness contrast helps distinguish regions with different compositions; it is not a photograph of their natural colors. Numbered spots connect this view to the analyses listed in the report.
Laboratory figure caption: Fig. 2: Backscattered electron image (rhodochrosite sphere)
Elemental spectrum: The peaks record characteristic X-ray signals from elements in the analyzed spot or area. This is an analysis of that location, not automatically of the entire specimen. Any mineral identification or uncertainty named in the laboratory caption is retained below.
Laboratory figure caption: Fig. 3: Energy dispersive spectrum of area 1 in Fig. 2. (rhodochrosite with minor siderite and calcite contribution)
Read the report as text
Transcript of the analytical report, including the figure descriptions and findings. The original pages above preserve the visual evidence and tables.
                                               Analytical Result Report

Sample id: 9185 (rhodochrosite sphere)
Submitted by: K. Bitner
Date submitted: Sept. 5, 2020
Date completed: Sept. 9, 2020
Operating conditions: JEOL JSM-6400 operated at 25 kV acceleration potential, 15 mm working distance, 15 degrees
sample tilt, coated with 250 Å carbon. Using the X-ray fluorescence attachment with 35kv potental in conjunction with
the EDS system.


Fig. 1: Two views of the rhodochrosite sphere. Approximatelt 28 mm diameter.


Fig. 2: Backscattered electron image (rhodochrosite sphere)
Fig. 3: Energy dispersive spectrum of area 1 in Fig. 2. (rhodochrosite with minor siderite and calcite contribution)


Fig. 4: Photomicrographs of two views of the rhodochhrosite sphere. Field of viiew is approximately 3 mm.

Blue arrow points to galena, red arrow points to sphalerite, green arrow points to quartz.


Table 1: Major, minor and trace element compositions of the two domaisn in the sphere

 element                                  Rhodochrosite area                        Dark area
 Antimony                                 nd                                        217 ppm
 Arsenic                                  nd                                        60 ppm
 Bismuth                                  50 ppm                                    20 ppm
 Cadmium                                                                            800 ppm
 Calcium                                  1.711 wt. %                               0.9 wt. %
 Copper                                   nd                                        1.12 wt. %
 Iron                                     3.1 wt. %                                 2.9 wt. %
 Lead                                     nd                                        3.77 wt. %
 Magnesium                                0.15 wt. %                                0.05 wt. %
 Manganese                                44.1 wt. %                                1.01 wt. %
 Silicon                                  1.09 wt. %                                25.1 wt. %
 Sulfur                                   3670 ppm                                  13.3 wt. %
 Zinc                                     2200 ppm                                  19.2 wt. %
Summary of findings: This sphere is remarkably interesting. The major portion is rhodochrosite with minor siderite,
calcite and very minor magnesite components. The dark areas are rich in sulfides, notably sphalerite with lesser
amounts of galena and a chalcopyrite. The galena contains some silver. The bismuth is likely due to microscopic
inclusions of bismuthinite in the galena or the other sulfides. Interestingly, bismuth is also present in the rhodochrosite,
likely as beyerite. The sphalerite contains relatively low iron, already evident by the lighter brown color. The sphalerite
also contains some cadmium. Antimony and arsenic may be forming tiny inclusions in the sulfides but are not otherwise
visible.


Date: September 9 ,2020                          Signature
Tanzberry Quartz Angels · Soul Body Gems, September 2024.
The precise inclusions of these pictured discs have not been established by the older report.
The name invites a closer look at what gives this Tanzanian quartz its color.
What the report found: The tested tumbled material is quartz containing abundant rounded red muscovite inclusions and some magnetite.
This assemblage differs from the Kazakhstan strawberry quartz specimen we tested, whose red color came from thin hematite blades. A shared color or trade name does not imply the same included mineral.
Use this guide alongside the written findings and the original report transcript. It explains the purpose of each analytical figure and preserves the laboratory’s own figure labels. The interpretations apply to the tested specimen; signals alone do not establish the identity of every similar-looking stone.
Electron microscope image: This view shows small-scale regions selected for analysis. Its brightness contrast helps distinguish regions with different compositions; it is not a photograph of their natural colors. Numbered spots connect this view to the analyses listed in the report.
Laboratory figure caption: Fig. 1: Backscattered electron image (Tanzberry)
Elemental spectrum: The peaks record characteristic X-ray signals from elements in the analyzed spot or area. This is an analysis of that location, not automatically of the entire specimen. Any mineral identification or uncertainty named in the laboratory caption is retained below.
Laboratory figure caption: Fig. 2: Energy dispersive spectrum of spot 1 in Fig. 1. Quartz.
Elemental spectrum: The peaks record characteristic X-ray signals from elements in the analyzed spot or area. This is an analysis of that location, not automatically of the entire specimen. Any mineral identification or uncertainty named in the laboratory caption is retained below.
Laboratory figure caption: Fig. 3: Energy dispersive spectrum of spot 2 in Fig. 1. muscovite
Read the report as text
Transcript of the analytical report, including the figure descriptions and findings. The original pages above preserve the visual evidence and tables.
Analytical Result Report
Sample id: 9035 (Tanzberry tumbled stones)
Submitted by: K.Bitner
Date submitted: May 29, 2020
Date completed: June 1, 2020
Operating conditions: JEOL JSM-6400 operated at 25 kV acceleration potential, 15 mm working distance, 15 degrees sample tilt, coated with 250 Å carbon. Using the X-ray fluorescence attachment with 35kv potental in conjunction with the EDS system.


Fig. 1: Backscattered electron image (Tanzberry)


Fig. 2: Energy dispersive spectrum of spot 1 in Fig. 1.  Quartz.


Fig. 3: Energy dispersive spectrum of spot 2 in Fig. 1. muscovite


Fig. 4: Photomicrograph of inclusion of red muscovite.  3 mm across the field of view.

Summary of findings:  What a color!  The matrix is quartz and lots of inclusions of rounded red muscovite and some magnetite grains as well.  Trace elements and their concentrations are: iron, 1683 ppm, manganese, 892 ppm, titanium, 390 ppm and chromium, 69 ppm.  Clearly, iron is the dominant chromophore and most likely, it is trivalent.  Intervalence charge transfer reactions between iron and titanium and titanium and manganese likely play a role in bringing out this very attractive color.

Date:   June 1 ,2020                                       Signature
Use this guide alongside the written findings and the original report transcript. It explains the purpose of each analytical figure and preserves the laboratory’s own figure labels. The interpretations apply to the tested specimen; signals alone do not establish the identity of every similar-looking stone.
Electron microscope image: This view shows small-scale regions selected for analysis. Its brightness contrast helps distinguish regions with different compositions; it is not a photograph of their natural colors. Numbered spots connect this view to the analyses listed in the report.
Laboratory figure caption: Fig. 1: Backscattered electron image (Tanzberry)
Elemental spectrum: The peaks record characteristic X-ray signals from elements in the analyzed spot or area. This is an analysis of that location, not automatically of the entire specimen. Any mineral identification or uncertainty named in the laboratory caption is retained below.
Laboratory figure caption: Fig. 2: Energy dispersive spectrum of spot 1 in Fig. 1. Quartz.
Elemental spectrum: The peaks record characteristic X-ray signals from elements in the analyzed spot or area. This is an analysis of that location, not automatically of the entire specimen. Any mineral identification or uncertainty named in the laboratory caption is retained below.
Laboratory figure caption: Fig. 3: Energy dispersive spectrum of spot 2 in Fig. 1. muscovite
Read the report as text
Transcript of the analytical report, including the figure descriptions and findings. The original pages above preserve the visual evidence and tables.
                                                   Analytical Result Report

Sample id: 9035 (Tanzberry tumbled stones)
Submitted by: K.Bitner
Date submitted: May 29, 2020
Date completed: June 1, 2020
Operating conditions: JEOL JSM-6400 operated at 25 kV acceleration potential, 15 mm working distance, 15 degrees
sample tilt, coated with 250 Å carbon. Using the X-ray fluorescence attachment with 35kv potental in conjunction with
the EDS system.


Fig. 1: Backscattered electron image (Tanzberry)


Fig. 2: Energy dispersive spectrum of spot 1 in Fig. 1. Quartz.
Fig. 3: Energy dispersive spectrum of spot 2 in Fig. 1. muscovite


Fig. 4: Photomicrograph of inclusion of red muscovite. 3 mm across the field of view.


Summary of findings: What a color! The matrix is quartz and lots of inclusions of rounded red muscovite and some
magnetite grains as well. Trace elements and their concentrations are: iron, 1683 ppm, manganese, 892 ppm, titanium,
390 ppm and chromium, 69 ppm. Clearly, iron is the dominant chromophore and most likely, it is trivalent. Intervalence
charge transfer reactions between iron and titanium and titanium and manganese likely play a role in bringing out this
very attractive color.

Direct current plasma spectrometry does test positive for a small amount of lithium, about 3 times above quantification
limit, this most likely present mainly in the mica. So it is a slightly lithium-bearing muscovite.


Date: June 1 ,2020                        Signature
Tanzberry Quartz Angels · Soul Body Gems, September 2024.
“Strawberry quartz” can be a market description for different red included quartzes.
What the report found: In this tested Tanzanian sample, the red inclusions are abundant rounded muscovite, accompanied by some magnetite.
The results differ from our tested Kazakhstan specimen, whose thin hematite crystals outline a quartz growth phantom. Identification requires testing each material, regardless of the market name.
Use this guide alongside the written findings and the original report transcript. It explains the purpose of each analytical figure and preserves the laboratory’s own figure labels. The interpretations apply to the tested specimen; signals alone do not establish the identity of every similar-looking stone.
Electron microscope image: This view shows small-scale regions selected for analysis. Its brightness contrast helps distinguish regions with different compositions; it is not a photograph of their natural colors. Numbered spots connect this view to the analyses listed in the report.
Laboratory figure caption: Fig. 1: Backscattered electron image (Tanzberry)
Elemental spectrum: The peaks record characteristic X-ray signals from elements in the analyzed spot or area. This is an analysis of that location, not automatically of the entire specimen. Any mineral identification or uncertainty named in the laboratory caption is retained below.
Laboratory figure caption: Fig. 2: Energy dispersive spectrum of spot 1 in Fig. 1. Quartz.
Elemental spectrum: The peaks record characteristic X-ray signals from elements in the analyzed spot or area. This is an analysis of that location, not automatically of the entire specimen. Any mineral identification or uncertainty named in the laboratory caption is retained below.
Laboratory figure caption: Fig. 3: Energy dispersive spectrum of spot 2 in Fig. 1. muscovite
Read the report as text
Transcript of the analytical report, including the figure descriptions and findings. The original pages above preserve the visual evidence and tables.
                                                   Analytical Result Report

Sample id: 9035 (Tanzberry tumbled stones)
Submitted by: K.Bitner
Date submitted: May 29, 2020
Date completed: June 1, 2020
Operating conditions: JEOL JSM-6400 operated at 25 kV acceleration potential, 15 mm working distance, 15 degrees
sample tilt, coated with 250 Å carbon. Using the X-ray fluorescence attachment with 35kv potental in conjunction with
the EDS system.


Fig. 1: Backscattered electron image (Tanzberry)


Fig. 2: Energy dispersive spectrum of spot 1 in Fig. 1. Quartz.
Fig. 3: Energy dispersive spectrum of spot 2 in Fig. 1. muscovite


Fig. 4: Photomicrograph of inclusion of red muscovite. 3 mm across the field of view.


Summary of findings: What a color! The matrix is quartz and lots of inclusions of rounded red muscovite and some
magnetite grains as well. Trace elements and their concentrations are: iron, 1683 ppm, manganese, 892 ppm, titanium,
390 ppm and chromium, 69 ppm. Clearly, iron is the dominant chromophore and most likely, it is trivalent. Intervalence
charge transfer reactions between iron and titanium and titanium and manganese likely play a role in bringing out this
very attractive color.

Direct current plasma spectrometry does test positive for a small amount of lithium, about 3 times above quantification
limit, this most likely present mainly in the mica. So it is a slightly lithium-bearing muscovite.


Date: June 1 ,2020                        Signature
A vivid teal Brazilian quartz with a distinctive natural mineral association.
What the report found: The laboratory identified quartz with green chromium-bearing muscovite (fuchsite) inclusions, plus minor pyrite and monazite-(Ce). Chromium in the muscovite is the primary source of color.
This material was described to us as a small pocket find from Brazil, and we have not seen it mined again after 2021. That history is our sourcing account; the report verifies the mineral composition of the tested specimen.
View the original report
Select a page to enlarge it. The text transcript below provides another way to read the findings.
Use this guide alongside the written findings and the original report transcript. It explains the purpose of each analytical figure and preserves the laboratory’s own figure labels. The interpretations apply to the tested specimen; signals alone do not establish the identity of every similar-looking stone.
Electron microscope image: This view shows small-scale regions selected for analysis. Its brightness contrast helps distinguish regions with different compositions; it is not a photograph of their natural colors. Numbered spots connect this view to the analyses listed in the report.
Laboratory figure caption: Fig. 1: Backscattered electron image (teal aventurine)
Elemental spectrum: The peaks record characteristic X-ray signals from elements in the analyzed spot or area. This is an analysis of that location, not automatically of the entire specimen. Any mineral identification or uncertainty named in the laboratory caption is retained below.
Laboratory figure caption: Fig. 2: Energy dispersive spectrum of spot 1 in Fig. 1. (Pyrite).
Elemental spectrum: The peaks record characteristic X-ray signals from elements in the analyzed spot or area. This is an analysis of that location, not automatically of the entire specimen. Any mineral identification or uncertainty named in the laboratory caption is retained below.
Laboratory figure caption: Fig. 3: Energy dispersive spectrum of spot 2 in Fig. 1. (monazite-(Ce))
Electron microscope image: This view shows small-scale regions selected for analysis. Its brightness contrast helps distinguish regions with different compositions; it is not a photograph of their natural colors. Numbered spots connect this view to the analyses listed in the report.
Laboratory figure caption: Fig. 4: Backscattered electron image (teal aventurine)
Elemental spectrum: The peaks record characteristic X-ray signals from elements in the analyzed spot or area. This is an analysis of that location, not automatically of the entire specimen. Any mineral identification or uncertainty named in the laboratory caption is retained below.
Laboratory figure caption: Fig. 5: Energy dispersive spectrum of spot 1 in Fig. 4. (quartz).
Elemental spectrum: The peaks record characteristic X-ray signals from elements in the analyzed spot or area. This is an analysis of that location, not automatically of the entire specimen. Any mineral identification or uncertainty named in the laboratory caption is retained below.
Laboratory figure caption: Fig. 6: Energy dispersive spectrum of spot 1 in Fig. 4. (chromian muscovite).
Read the report as text
Transcript of the analytical report, including the figure descriptions and findings. The original pages above preserve the visual evidence and tables.
                                                   Analytical Result Report

Sample id: 9055 (teal Brazilian aventurine)
Submitted by: K. Bitner
Date submitted: June 22, 2020
Date completed: June 27, 2020
Operating conditions: JEOL JSM-6400 operated at 25 kV acceleration potential, 15 mm working distance, 15 degrees
sample tilt, coated with 250 Å carbon. Using the X-ray fluorescence attachment with 35kv potental in conjunction with
the EDS system.


Fig. 1: Backscattered electron image (teal aventurine)


Fig. 2: Energy dispersive spectrum of spot 1 in Fig. 1. (Pyrite).
Fig. 3: Energy dispersive spectrum of spot 2 in Fig. 1. (monazite-(Ce))


Fig. 4: Backscattered electron image (teal aventurine)


Fig. 5: Energy dispersive spectrum of spot 1 in Fig. 4. (quartz).
Fig. 6: Energy dispersive spectrum of spot 1 in Fig. 4. (chromian muscovite).


Fig. 7) : Photomicrographs of the teal aventurine. Left: pyrite exposed at the surface, similar to the one shown in Fig. 1.
Right: monazite-(Ce) (brown) just below the surface. Width of view 2 mm in both images.


Summary of findings: This is a very interesting specimen. Quartz (Figs. 4 and 5) with inclusions of green chromian
muscovite (fuchsite) (Figs 4 and 6) and scattered throughout minor pyrite (Figs. 1 and 2) and monazite-(Ce) (Figs. 1, 3
and 7). The color is primarily caused by the trivalent chromium in the muscovite. A very interesting association!
Material like this fits the term ‘aventurine quartz’. There are several color variants, depending upon the included
mineral that gives it the color. Other minerals that can cause stones with similar effect include for example hematite.

The well-known aventurine glass or gold stone, gold flux and other names is not the same, it is man-made whereas
stones like this one described here are natural. Since this is macrocrystalline quartz and not microcrystalline quartz such
as chalcedony’s agate variety, it cannot be dyed. There is colored synthetic quartz material being produced but they
have the oxides of the pertinent elements (chromium oxide, cobalt oxide etc.) in their crystal structure to give them the
specific color. Those materials are homogeneous and very clear since they do not have mineral inclusions imparting the
color.
Date: June 27 ,2020   Signature
Two convincing blue stones illustrate why appearance cannot confirm turquoise.
What the report found: The laboratory tested an oval and a square cabochon. Blue color transferred during an acid test, and chemical analysis identified both as natural magnesite dyed blue—not turquoise.
Turquoise is a copper-bearing aluminum phosphate. The tested cabochons did not have the expected key elemental composition. This report documents these two specimens and offers a concrete example of dyed material presented under a turquoise name.
View the original report
Select a page to enlarge it. The text transcript below provides another way to read the findings.
Transcript of the analytical report, including the figure descriptions and findings. The original pages above preserve the visual evidence and tables.
                                               Analytical Result Report

Sample id: 9244 (blue cabs)
Submitted by: K. Bitner
Date submitted: Jan. 15, 2021
Date completed: Jan. 19, 2021
Operating conditions: JEOL JSM-6400 operated at 25 kV acceleration potential, 15 mm working distance, 15 degrees
sample tilt, coated with 250 Å carbon. Using the X-ray fluorescence attachment with 35kv potental in conjunction with
the EDS system.


Fig. 1: Photograph of the oval specimen, approximately 3.5x2.4 cm.


Fig. 2: Photograph of the square specimen, approximately 3x3 cm.
Fig. 3: Photomicrograph of the oval specimen. Left: 5 mm field of view, right: 1.2 mm field of view


Fig. 4: Photomicrograph of the square specimen. Left: 5 mm field of view, right: 1.2 mm field of view


Fig. 5: After acid test, note blue dye on the towel.
Table 1: Compositions of the 2 specimens, front and back. (In weight percent)

 element                    Oval specimen front      Oval specimen back         Square specimen    Square specimen
                                                                                front              back
 Magnesium oxide            78.65                    42.79                      77.97              66.45
 Aluminum oxide             0.55                     0.80                       0.27               0.35
 Silicon oxide              2.08                     28.17                      0.34               1.35
 Calcium                    3.32                     8.61                       5.11               7.17
 Iron                       0.13                     5.08                       0.01               0.15
 Manganese                  0.01                     0.01                       0.003              0.004
 Copper                     0.06                     0.03                       0.07               0.05
 Chromium                   0.14                     0.42                       0.04               0.01
 Chlorine                   0.30                     0.19                       0.45               0.47
 Phosphorus                 nd                       nd                         nd                 0.04
 Nickel                     0.04                     0.14                       0.02               0.02


Summary of findings: Very interesting material! The specimens do resemble turquoise (Figs. 1 and 2). Close-up
photographs reveal in the oval specimen cauliflower-like growth which is sometimes seen in turquoise. The back shows
more iron oxide-rich matrix. That would not be unusual for turquoise. However, in both cases, there are odd striations
visible (Figs. 3 and 4), even continuing across boundaries to the next cauliflower-like mass (result of brushing on the
dye?). Acid test revealed slow CO2 emission. Not unusual. What is however unusual is that the blue color comes off!
Oh my! (Fig. 5). Chemical analyses (Table 1) of the samples, both sides, reveal that magnesium is the major element, the
material in booth cases is dies magnesite!

The material is natural magnesite that has been dyed blue. True turquoise is a copper-bearing aluminum phosphate,
and all the key elements are either in very low concentration present or not at all! Magnesite is a common product of
hydrous metamorphism of ultramafic rocks and key elements in such rocks are chromium and nickel, both are
detectable in the specimens.


Date: January 19, 2021                       Signature
Rainbow Moonstone Stretch Bracelet · Soul Body Gems, April 2024.
The market name “rainbow moonstone” can conceal an important feldspar distinction.
What the report found: The tested Indian material is intermediate plagioclase, likely in the andesine-to-labradorite compositional range. Potassium feldspar such as orthoclase or microcline was not observed.
Labradorite belongs to the plagioclase feldspar series; conventional moonstone commonly refers to potassium feldspar, especially orthoclase, though gem trade usage can be broader. This report supports a plagioclase identification for this specimen, not a precise labradorite end-member determination. Quartz, epidote, titanite and a likely chlorite-group mineral were also noted.
Use this guide alongside the written findings and the original report transcript. It explains the purpose of each analytical figure and preserves the laboratory’s own figure labels. The interpretations apply to the tested specimen; signals alone do not establish the identity of every similar-looking stone.
Electron microscope image: This view shows small-scale regions selected for analysis. Its brightness contrast helps distinguish regions with different compositions; it is not a photograph of their natural colors. Numbered spots connect this view to the analyses listed in the report.
Laboratory figure caption: Fig. 1: Backscattered electron image (area 1)
Elemental spectrum: The peaks record characteristic X-ray signals from elements in the analyzed spot or area. This is an analysis of that location, not automatically of the entire specimen. Any mineral identification or uncertainty named in the laboratory caption is retained below.
Laboratory figure caption: Fig. 2: Energy dispersive spectrum of spot 1 in Fig. 1. (plagioclase, likely andesine to labradorite)
Elemental spectrum: The peaks record characteristic X-ray signals from elements in the analyzed spot or area. This is an analysis of that location, not automatically of the entire specimen. Any mineral identification or uncertainty named in the laboratory caption is retained below.
Laboratory figure caption: Fig. 3: Energy dispersive spectrum of spot 2 in Fig. 1. (quartz)
Electron microscope image: This view shows small-scale regions selected for analysis. Its brightness contrast helps distinguish regions with different compositions; it is not a photograph of their natural colors. Numbered spots connect this view to the analyses listed in the report.
Laboratory figure caption: Fig. 4: Backscattered electron image (area 2)
Elemental spectrum: The peaks record characteristic X-ray signals from elements in the analyzed spot or area. This is an analysis of that location, not automatically of the entire specimen. Any mineral identification or uncertainty named in the laboratory caption is retained below.
Laboratory figure caption: Fig. 5: Energy dispersive spectrum of spot 1 in Fig. 4. (plagioclase, likely andesine to labradorite)
Elemental spectrum: The peaks record characteristic X-ray signals from elements in the analyzed spot or area. This is an analysis of that location, not automatically of the entire specimen. Any mineral identification or uncertainty named in the laboratory caption is retained below.
Laboratory figure caption: Fig. 6: Energy dispersive spectrum of spot 2 in Fig. 4. (likely a chlorite group mineral)
Elemental spectrum: The peaks record characteristic X-ray signals from elements in the analyzed spot or area. This is an analysis of that location, not automatically of the entire specimen. Any mineral identification or uncertainty named in the laboratory caption is retained below.
Laboratory figure caption: Fig. 7: Energy dispersive spectrum of spot 2 in Fig. 4. (epidote, with some titanite)
Electron microscope image: This view shows small-scale regions selected for analysis. Its brightness contrast helps distinguish regions with different compositions; it is not a photograph of their natural colors. Numbered spots connect this view to the analyses listed in the report.
Laboratory figure caption: Fig. 8: Backscattered electron image (area 3)
Elemental spectrum: The peaks record characteristic X-ray signals from elements in the analyzed spot or area. This is an analysis of that location, not automatically of the entire specimen. Any mineral identification or uncertainty named in the laboratory caption is retained below.
Laboratory figure caption: Fig. 9: Energy dispersive spectrum of spot 2 in Fig. 5. (epidote)
Elemental spectrum: The peaks record characteristic X-ray signals from elements in the analyzed spot or area. This is an analysis of that location, not automatically of the entire specimen. Any mineral identification or uncertainty named in the laboratory caption is retained below.
Laboratory figure caption: Fig. 10: Energy dispersive spectrum of spot 3 in Fig. 5. (titanite)
Read the report as text
Transcript of the analytical report, including the figure descriptions and findings. The original pages above preserve the visual evidence and tables.
                                                  Analytical Result Report

Sample id: 9145 (rainbow moonstone)
Submitted by: K.Bitner
Date submitted: July 31, 2020
Date completed: August 4, 2020
Operating conditions: JEOL JSM-6400 operated at 25 kV acceleration potential, 15 mm working distance, 15 degrees
sample tilt, coated with 250 Å carbon. Using the X-ray fluorescence attachment with 35kv potental in conjunction with
the EDS system.


Fig. 1: Backscattered electron image (area 1)


Fig. 2: Energy dispersive spectrum of spot 1 in Fig. 1. (plagioclase, likely andesine to labradorite)
Fig. 3: Energy dispersive spectrum of spot 2 in Fig. 1. (quartz)


Fig. 4: Backscattered electron image (area 2)


Fig. 5: Energy dispersive spectrum of spot 1 in Fig. 4. (plagioclase, likely andesine to labradorite)
Fig. 6: Energy dispersive spectrum of spot 2 in Fig. 4. (likely a chlorite group mineral)


Fig. 7: Energy dispersive spectrum of spot 2 in Fig. 4. (epidote, with some titanite)


Fig. 8: Backscattered electron image (area 3)
Fig. 9: Energy dispersive spectrum of spot 2 in Fig. 5. (epidote)


                                                                                  )

Fig. 10: Energy dispersive spectrum of spot 3 in Fig. 5. (titanite)


Summary of findings: This is a complex specimen! It is composed of an intermediate plagioclase, likely in the
compositional range of andesine to labradorite (Figs. 1, 2, 4 and 5). Quartz is present (Figs. 1 and 3) and an interesting
assemblage with chlorite group species (Figs. 4 and 6), epidote (Figs. 4.7.and 8-9), and titanite (Figs. 8 and 10). The
chlorite group species are likely replacing an earlier mineral. Potassium feldspar such as orthoclase or microcline where
not seen in the investigation.


Date: August 4 ,2020                          Signature
Rainbow Moonstone Stretch Bracelet · Soul Body Gems, April 2024.
“Rainbow moonstone” is widely used in the jewelry trade, but the mineral identity deserves precision.
What the report found: The tested sample is intermediate plagioclase, likely andesine to labradorite. The lab did not observe orthoclase or microcline.
Orthoclase is potassium feldspar; labradorite is a member of the plagioclase feldspar series. The report places this sample in the andesine-to-labradorite range rather than assigning a precise species. The rainbow moonstone trade name remains useful for recognition, while the tested mineral identity is more specific.
Use this guide alongside the written findings and the original report transcript. It explains the purpose of each analytical figure and preserves the laboratory’s own figure labels. The interpretations apply to the tested specimen; signals alone do not establish the identity of every similar-looking stone.
Electron microscope image: This view shows small-scale regions selected for analysis. Its brightness contrast helps distinguish regions with different compositions; it is not a photograph of their natural colors. Numbered spots connect this view to the analyses listed in the report.
Laboratory figure caption: Fig. 1: Backscattered electron image (area 1)
Elemental spectrum: The peaks record characteristic X-ray signals from elements in the analyzed spot or area. This is an analysis of that location, not automatically of the entire specimen. Any mineral identification or uncertainty named in the laboratory caption is retained below.
Laboratory figure caption: Fig. 2: Energy dispersive spectrum of spot 1 in Fig. 1. (plagioclase, likely andesine to labradorite)
Elemental spectrum: The peaks record characteristic X-ray signals from elements in the analyzed spot or area. This is an analysis of that location, not automatically of the entire specimen. Any mineral identification or uncertainty named in the laboratory caption is retained below.
Laboratory figure caption: Fig. 3: Energy dispersive spectrum of spot 2 in Fig. 1. (quartz)
Electron microscope image: This view shows small-scale regions selected for analysis. Its brightness contrast helps distinguish regions with different compositions; it is not a photograph of their natural colors. Numbered spots connect this view to the analyses listed in the report.
Laboratory figure caption: Fig. 4: Backscattered electron image (area 2)
Elemental spectrum: The peaks record characteristic X-ray signals from elements in the analyzed spot or area. This is an analysis of that location, not automatically of the entire specimen. Any mineral identification or uncertainty named in the laboratory caption is retained below.
Laboratory figure caption: Fig. 5: Energy dispersive spectrum of spot 1 in Fig. 4. (plagioclase, likely andesine to labradorite)
Elemental spectrum: The peaks record characteristic X-ray signals from elements in the analyzed spot or area. This is an analysis of that location, not automatically of the entire specimen. Any mineral identification or uncertainty named in the laboratory caption is retained below.
Laboratory figure caption: Fig. 6: Energy dispersive spectrum of spot 2 in Fig. 4. (likely a chlorite group mineral)
Elemental spectrum: The peaks record characteristic X-ray signals from elements in the analyzed spot or area. This is an analysis of that location, not automatically of the entire specimen. Any mineral identification or uncertainty named in the laboratory caption is retained below.
Laboratory figure caption: Fig. 7: Energy dispersive spectrum of spot 2 in Fig. 4. (epidote, with some titanite)
Electron microscope image: This view shows small-scale regions selected for analysis. Its brightness contrast helps distinguish regions with different compositions; it is not a photograph of their natural colors. Numbered spots connect this view to the analyses listed in the report.
Laboratory figure caption: Fig. 8: Backscattered electron image (area 3)
Elemental spectrum: The peaks record characteristic X-ray signals from elements in the analyzed spot or area. This is an analysis of that location, not automatically of the entire specimen. Any mineral identification or uncertainty named in the laboratory caption is retained below.
Laboratory figure caption: Fig. 9: Energy dispersive spectrum of spot 2 in Fig. 5. (epidote)
Elemental spectrum: The peaks record characteristic X-ray signals from elements in the analyzed spot or area. This is an analysis of that location, not automatically of the entire specimen. Any mineral identification or uncertainty named in the laboratory caption is retained below.
Laboratory figure caption: Fig. 10: Energy dispersive spectrum of spot 3 in Fig. 5. (titanite)
Read the report as text
Transcript of the analytical report, including the figure descriptions and findings. The original pages above preserve the visual evidence and tables.
                                                  Analytical Result Report

Sample id: 9145 (rainbow moonstone)
Submitted by: K.Bitner
Date submitted: July 31, 2020
Date completed: August 4, 2020
Operating conditions: JEOL JSM-6400 operated at 25 kV acceleration potential, 15 mm working distance, 15 degrees
sample tilt, coated with 250 Å carbon. Using the X-ray fluorescence attachment with 35kv potental in conjunction with
the EDS system.


Fig. 1: Backscattered electron image (area 1)


Fig. 2: Energy dispersive spectrum of spot 1 in Fig. 1. (plagioclase, likely andesine to labradorite)
Fig. 3: Energy dispersive spectrum of spot 2 in Fig. 1. (quartz)


Fig. 4: Backscattered electron image (area 2)


Fig. 5: Energy dispersive spectrum of spot 1 in Fig. 4. (plagioclase, likely andesine to labradorite)
Fig. 6: Energy dispersive spectrum of spot 2 in Fig. 4. (likely a chlorite group mineral)


Fig. 7: Energy dispersive spectrum of spot 2 in Fig. 4. (epidote, with some titanite)


Fig. 8: Backscattered electron image (area 3)
Fig. 9: Energy dispersive spectrum of spot 2 in Fig. 5. (epidote)


                                                                                  )

Fig. 10: Energy dispersive spectrum of spot 3 in Fig. 5. (titanite)


Summary of findings: This is a complex specimen! It is composed of an intermediate plagioclase, likely in the
compositional range of andesine to labradorite (Figs. 1, 2, 4 and 5). Quartz is present (Figs. 1 and 3) and an interesting
assemblage with chlorite group species (Figs. 4 and 6), epidote (Figs. 4.7.and 8-9), and titanite (Figs. 8 and 10). The
chlorite group species are likely replacing an earlier mineral. Potassium feldspar such as orthoclase or microcline where
not seen in the investigation.


Date: August 4 ,2020                          Signature
Blue-green apatite palms from the Lake Baikal collection, with Slyudyanka regional geology, apatite chemistry and handling advice.
Russian Stones: Amazonite, Lake Baikal Apatite, Gilbertite and Paragonite · Soul Body Gems, November 2024.
About this page: A material profile with our collection image and published mineralogical context. Sources describe their own researched specimens; this profile is not a laboratory report for every pictured piece.
Our Lake Baikal collection
Our January 2025 photograph shows a translucent blue-green apatite palm stone held between the fingers. Its rounded polish makes the body colour easy to see, while light passing through thinner areas adds another view of the material. The collection was supplied to Soul Body Gems as Lake Baikal apatite from Russia. That country and regional label belong to our collection record, but they do not establish the exact vein, quarry or formation setting of this particular palm. Lake Baikal’s surroundings include well-studied apatite occurrences, and those studies offer useful context without replacing specimen-specific provenance. We use “Lake Baikal Apatite” as the familiar collection name and explain what the broader mineral name means.
Apatite is a mineral family
Apatite is a group of calcium phosphate minerals whose composition can include fluorine, chlorine or hydroxyl. Fluorapatite is commonly written Ca₅(PO₄)₃F, but a trade label saying apatite does not by itself establish which member or mixture applies to a particular specimen. The minerals share a characteristic structure and can occur in several colours, including blue and green. Their crystals belong to the hexagonal system, although a polished palm may not preserve an obvious crystal outline. Apatite has a Mohs hardness of 5 and is brittle, important practical differences from harder blue-green gems. Similar colour is not proof of similar mineral identity, origin or durability.
The Slyudyanka regional story
Slyudyanka, near the southern end of Lake Baikal in Siberia, is a documented source of apatite. The region contains metamorphic rocks and mineral-bearing veins that have attracted collectors and researchers. The Handbook of Mineralogy lists Slyudyanka among notable fluorapatite localities and describes apatite’s occurrence in calcium-rich metamorphic environments, including marbles and skarns. More recent research distinguishes several apatite settings in the Slyudyanka deposit, including material associated with veins and silicate-carbonate rocks. That variety is important: a regional name does not imply that all apatite there formed in exactly the same way. It also means that colour alone should not be used to select one published geological model for our palm stone.
Why apatite matters to science
Apatite can incorporate small amounts of other elements, making it useful for investigating geological processes. Researchers examine its trace-element composition to compare growth environments and interpret the history of the rocks containing it. Studies of Slyudyanka apatite include work on chemical patterns and on its possible use as a natural reference material for elemental microanalysis. A reference material helps scientists compare and check measurements; that role depends on detailed characterisation, not simply on a attractive colour or a locality name. Our polished collection piece is presented for its mineral and visual interest. It has not been designated an analytical standard, and a research result from another sample is not an analysis of this one.
Viewing the colour and translucency
Observe the stone in soft daylight, then turn it so light reaches the thinner edges. Compare those areas with the thicker centre, where the colour may appear deeper because light travels through more material. Internal features and variations in transparency can become more apparent when the angle changes. A polished surface may reflect a window or lamp, so distinguish those bright reflections from features within the stone. A photograph against a neutral background provides a useful collecting record, while an image held in the hand shows scale and the way the piece is handled. These observations explain appearance, but they cannot establish the chemical cause of the colour without further study.
Caring for a polished palm
Although the surface is smoothly polished, apatite should be protected from impacts and scratches. Keep it separate from quartz and other harder stones during storage or transport. Avoid abrasive cleaning, harsh chemicals, steam and ultrasonic treatment. Gentle wiping is often sufficient; if brief washing is needed, use mild conditions and dry the piece carefully, considering any cracks or associated minerals. Do not assume a palm stone is resistant to damage simply because it feels substantial. Some collectors connect its blue-green appearance with quiet reflection or clarity as a personal practice. Those meanings are individual interpretations rather than medical effects. The regional geology, varied chemistry and visible interaction with light offer their own reasons to enjoy and document the material.
Iridescent fossil ammonite shell material offered from Russia.
What it is
Ammonites were extinct marine cephalopods. Some fossil shells retain iridescent layers that produce changing colors as light interacts with their fine structure. “Ammolite” is a gem trade term; the fossil’s locality and any stabilization or backing should be disclosed for an individual piece.
Source and identification
The notes describe pastel and vivid red-purple examples. Those color impressions belong in the photo record rather than serving as an identification test.
Evidence status: Material profile based on sourcing notes and referenced mineral information. No laboratory report for an individual Soul Body Gems specimen is attached to this page.
High Grade Russian Material · Soul Body Gems, November 2024.
The main photograph shows the shared High Grade Russian Material collection, including several different materials.
Amazonite from Russia.
What it is
Amazonite is a green to blue-green variety of microcline feldspar. Ploskaya Mountain in the Keivy region has a documented history of amazonite production.
Source and identification
Our sourcing notes name Ploskaya Mountain, western Keivy, Murmansk Oblast. We will distinguish the reported source of a particular item from the documented geology of the locality.
Evidence status: Material profile based on sourcing notes and referenced mineral information. No laboratory report for an individual Soul Body Gems specimen is attached to this page.
A green amphibole associated in our notes with Russia.
What it is
Actinolite belongs to the amphibole family and forms a compositional series with tremolite. Some compact, interlocking amphibole aggregates can constitute nephrite jade, but an actinolite specimen is not automatically nephrite.
Source and identification
Our notes give North Karelia as the reported origin. The precise locality and form should be recorded with photographs; fibrous amphibole dust should not be inhaled during cutting or handling of broken material.
Evidence status: Material profile based on sourcing notes and referenced mineral information. No laboratory report for an individual Soul Body Gems specimen is attached to this page.
The cross-patterned variety of andalusite.
What it is
Chiastolite is andalusite with dark inclusions arranged in a cross-like pattern visible on a cross section. The pattern is a natural growth feature, not a painted mark.
Source and identification
The notes list only three localities, but that claim is too restrictive. We are leaving the locality open until the particular collection specimen is documented.
Evidence status: Material profile based on sourcing notes and referenced mineral information. No laboratory report for an individual Soul Body Gems specimen is attached to this page.
High Grade Russian Material · Soul Body Gems, November 2024.
The main photograph shows the shared High Grade Russian Material collection, including several different materials.
A Russian ornamental stone name.
What it is
The supplied description calls this a volcanic rock with carbonate-filled cavities and gives the Enzor-Yakha area of the Polar Urals as its source. “Enzorite” is treated here as a regional or commercial stone name, rather than an approved single mineral species.
Source and identification
A reliable compositional analysis for our own specimen has not been supplied. We will add photographs and a source document before making a more specific mineral claim.
Evidence status: Material profile based on sourcing notes and referenced mineral information. No laboratory report for an individual Soul Body Gems specimen is attached to this page.
A reported association of fuchsite, kyanite, quartz and staurolite from Karelia.
What it is
These are distinct minerals that may appear together in metamorphic rocks. Fuchsite is chromium-bearing muscovite; kyanite and staurolite are aluminum-bearing metamorphic minerals, while quartz is silica.
Source and identification
The exact proportions and even the presence of every named phase in an individual piece require specimen documentation. The present entry preserves the supplier's Karelian association as a starting point.
Evidence status: Material profile based on sourcing notes and referenced mineral information. No laboratory report for an individual Soul Body Gems specimen is attached to this page.
High Grade Russian Material · Soul Body Gems, November 2024.
The main photograph shows the shared High Grade Russian Material collection, including several different materials.
A compact muscovite variety reported from Russia.
What it is
Gilbertite is a historical varietal name for compact muscovite, rather than a separate approved mineral species. The note also mentions quartz and feldspar in the material.
Source and identification
Those accompanying minerals and the Karelian locality are reported sourcing details, not laboratory findings on our specific piece. The unrelated historical biography and medical claims in the raw notes have been omitted.
Evidence status: Material profile based on sourcing notes and referenced mineral information. No laboratory report for an individual Soul Body Gems specimen is attached to this page.
Jadeite is a pyroxene mineral and differs from nephrite, an amphibole-rich jade. Green coloration and translucency can be attractive, but “imperial” is a quality description that should be supported by the piece itself, not inferred from a regional history.
Source and identification
Jadeite occurrences in the Polar Urals are documented. For our pieces, the exact mine, any treatment, and independent identification can be added when records are available.
Evidence status: Material profile based on sourcing notes and referenced mineral information. No laboratory report for an individual Soul Body Gems specimen is attached to this page.
High Grade Russian Material · Soul Body Gems, November 2024.
The main photograph shows the shared High Grade Russian Material collection, including several different materials.
Violet ornamental rock associated with Kataranskii Cape on the Kola Peninsula.
What it is
Kataranskite is a rock name, not a single-mineral gemstone. The purple tones have been studied in relation to manganese-bearing mica and altered feldspar within the rock.
Source and identification
The supplied locality is the Kolvitsa massif near Kataranskii Cape, Murmansk Oblast. Composition varies within a rock, so we will not assign a single formula to every piece.
Evidence status: Material profile based on sourcing notes and referenced mineral information. No laboratory report for an individual Soul Body Gems specimen is attached to this page.
High Grade Russian Material · Soul Body Gems, November 2024.
The main photograph shows the shared High Grade Russian Material collection, including several different materials.
Two distinct pale materials that can be dyed to imitate turquoise.
What it is
Howlite is a calcium borosilicate hydroxide mineral; magnesite is magnesium carbonate. Their similar pale appearance and use in dyed imitations should not blur the mineral distinction.
Source and identification
In the gemstone market, the names are sometimes applied loosely to pale material, especially after dyeing. Mineralogically they are not interchangeable: an individual specimen must be identified as one or the other. The notes filed under “Magnesite” describe howlite. Our separate Turquoise (Dyed) report documents two blue stones that tested as dyed magnesite, not howlite.
Evidence status: Material profile based on sourcing notes and referenced mineral information. No laboratory report for an individual Soul Body Gems specimen is attached to this page.
A platy titanium-rich silicate from Russia.
What it is
Murmanite may resemble a mica because of its layered appearance and cleavage, but it is a different mineral. It occurs in the mineral-rich alkaline complexes of the Kola Peninsula.
Source and identification
The notes identify the Lovozero massif as the reported source and mention associations with other alkaline-complex minerals. Those associations should be checked against the actual specimen when photographs arrive.
Evidence status: Material profile based on sourcing notes and referenced mineral information. No laboratory report for an individual Soul Body Gems specimen is attached to this page.
High Grade Russian Material · Soul Body Gems, November 2024.
The main photograph shows the shared High Grade Russian Material collection, including several different materials.
A vivid red quartz from Russia, revealed under the microscope.
What the report found: The tested material is quartz containing abundant colorless muscovite flakes. Some flakes carry thin hematite coatings; tiny red hematite particles also occur throughout the quartz and give it its color.
Our sourcing notes give Bashkortostan as the locality. The report supports the composition of this specimen; it does not establish that every red quartz sold from the region is identical.
Use this guide alongside the written findings and the original report transcript. It explains the purpose of each analytical figure and preserves the laboratory’s own figure labels. The interpretations apply to the tested specimen; signals alone do not establish the identity of every similar-looking stone.
Electron microscope image: This view shows small-scale regions selected for analysis. Its brightness contrast helps distinguish regions with different compositions; it is not a photograph of their natural colors. Numbered spots connect this view to the analyses listed in the report.
Laboratory figure caption: Fig. 1: Backscattered electron image (red aventurine)
Elemental spectrum: The peaks record characteristic X-ray signals from elements in the analyzed spot or area. This is an analysis of that location, not automatically of the entire specimen. Any mineral identification or uncertainty named in the laboratory caption is retained below.
Laboratory figure caption: Fig. 2: Energy dispersive spectrum of spot 1 in Fig. 1. (muscovite).
Elemental spectrum: The peaks record characteristic X-ray signals from elements in the analyzed spot or area. This is an analysis of that location, not automatically of the entire specimen. Any mineral identification or uncertainty named in the laboratory caption is retained below.
Laboratory figure caption: Fig. 3: Energy dispersive spectrum of spot 2 in Fig. 1. (quartz)
Read the report as text
Transcript of the original analytical report, including figure descriptions and findings.
                                                 Analytical Result Report

Sample id: 9056 (red aventurine)
Submitted by: K.Bitner
Date submitted: June 22, 2020
Date completed: June 27, 2020
Operating conditions: JEOL JSM-6400 operated at 25 kV acceleration potential, 15 mm working distance, 15 degrees
sample tilt, coated with 250 Å carbon. Using the X-ray fluorescence attachment with 35kv potental in conjunction with
the EDS system.


Fig. 1: Backscattered electron image (red aventurine)


Fig. 2: Energy dispersive spectrum of spot 1 in Fig. 1. (muscovite).
Fig. 3: Energy dispersive spectrum of spot 2 in Fig. 1. (quartz)


Fig. 4: Photomicrographs of the red aventurine. In the center is a colorless muscovite flake. Width of view 2 mm.


Summary of findings: Very interesting! The bulk material is quartz (Figs. 1 and 3) and it is full of colorless muscovite
flakes (Figs. 2 and 4) which at time are coated with a thin film of hematite, there are also tiny red hematite particles
throughout the quartz and the hematite is what gives it the color. The orientation of the tiny hematite flakes appears to
outline original quartz grains which then underwent metamorphism. The material is very clean looking at trace
elements, besides iron only a little zirconium, titanium and manganese were detected


Date: June 27 ,2020                         Signature
A Russian name associated in the notes with hornfels-type ornamental rock.
What it is
Hornfels is a contact-metamorphic rock formed when heat alters an existing rock near an intrusion. Its composition depends on the starting rock and alteration history; “hornfels” is a rock-texture and formation term, not a fixed feldspar–quartz recipe.
Source and identification
The pasted notes also discuss an unrelated Rogovik gold-silver ore deposit. That deposit's ore minerals cannot be used to describe an ornamental hornfels piece without proof that it is the same material.
Evidence status: Material profile based on sourcing notes and referenced mineral information. No laboratory report for an individual Soul Body Gems specimen is attached to this page.
Russian Stones: Amazonite, Lake Baikal Apatite, Gilbertite and Paragonite · Soul Body Gems, November 2024.
A sodium-rich mica with reported Russian occurrences.
What it is
Paragonite is a mica mineral distinct from potassium-rich muscovite. It can occur in metamorphic rocks and may be difficult to distinguish by eye from other pale micas.
Source and identification
The notes list Karelian and Ural occurrences but do not establish which locality supplied our specimen. We will attach precise provenance if it becomes available.
Evidence status: Material profile based on sourcing notes and referenced mineral information. No laboratory report for an individual Soul Body Gems specimen is attached to this page.
A fine-grained alkaline igneous rock reported from Russia.
What it is
Tinguaite is a rock subtype, not a single crystal species. It typically includes alkali feldspar, nepheline and aegirine; fine aegirine needles can contribute to a distinctive texture.
Source and identification
The source note names Poachvumchorr Mountain in the Khibiny area of the Kola Peninsula. The reported locality will be tied to photographs and provenance records later.
Evidence status: Material profile based on sourcing notes and referenced mineral information. No laboratory report for an individual Soul Body Gems specimen is attached to this page.
Rhodusite carvings from Russia · September 2025. Supplier identification; these individual carvings were not laboratory tested by Soul Body Gems.
The name rhodusite is associated with magnesio-riebeckite.
What it is
Magnesio-riebeckite is an amphibole. Its blue-to-gray appearance and fibrous or silky habit should not be used alone to identify a piece.
Source and identification
The notes mention Russia among several localities but do not give a specific mine for our material. Handle fibrous specimens carefully and avoid creating or inhaling dust.
Evidence status: Material profile based on sourcing notes and referenced mineral information. No laboratory report for an individual Soul Body Gems specimen is attached to this page.
Sengilite is used as a regional or trade name for a carbonate-rich ornamental material, rather than a single mineral species. Calcite-rich zones and darker inclusions can create distinctive patterns.
Source and identification
The raw notes contain competing descriptions and precise percentages without an attached analysis. We will add a reliable study and specimen photographs before stating those values as facts for our material.
Evidence status: Material profile based on sourcing notes and referenced mineral information. No laboratory report for an individual Soul Body Gems specimen is attached to this page.
High Grade Russian Material · Soul Body Gems, November 2024.
The main photograph shows the shared High Grade Russian Material collection, including several different materials.
Purple stichtite associated with green serpentine, reported from Russia.
What it is
Stichtite is a magnesium-chromium carbonate mineral. It may form with serpentine-group minerals, producing a vivid purple-and-green contrast.
Source and identification
The notes give a range name but spell it inconsistently, so this page records only the broader Altai provenance until an original locality label can be checked.
Evidence status: Material profile based on sourcing notes and referenced mineral information. No laboratory report for an individual Soul Body Gems specimen is attached to this page.
High Grade Russian Material · Soul Body Gems, November 2024.
The main photograph shows the shared High Grade Russian Material collection, including several different materials.
Blue-to-violet diopside variety associated with Russia.
What it is
Violane (also written violan) is a manganese-rich variety associated with diopside-family material; it is often cut as cabochons or decorative objects. The name describes a variety, not a separate approved mineral species.
Source and identification
The Russian locality in the notes is Khakassia. We will keep treatment and exact source claims tied to the individual piece once photographs and provenance are supplied.
Evidence status: Material profile based on sourcing notes and referenced mineral information. No laboratory report for an individual Soul Body Gems specimen is attached to this page.
High Grade Russian Material · Soul Body Gems, November 2024.
The main photograph shows the shared High Grade Russian Material collection, including several different materials.
A colorful copper-rich rock sold under a Russian trade name.
What it is
Zarinite is a commercial name for a mixed copper-and-iron secondary-mineral rock from Altai, not a single mineral species. The reported mixture can include malachite, azurite, iron oxides and other phases.
Source and identification
A list of possible constituents is not a laboratory result for every item. We will describe each finished piece by its observable features and disclose any testing available.
Evidence status: Material profile based on sourcing notes and referenced mineral information. No laboratory report for an individual Soul Body Gems specimen is attached to this page.
High Grade Russian Material · Soul Body Gems, November 2024.
This Russian material is often sold under the “strawberry quartz” name.
What the report found: The specimen tested as quartz full of colorless muscovite flakes, with hematite films and tiny red hematite particles responsible for the color.
We label this material Red Aventurine (Russia) to describe the tested specimen more precisely. “Strawberry quartz” is a variable trade name, not a separate mineral species; another red quartz offered under that name can contain a different inclusion texture. Compare our Kazakhstan and Tanzania reports.
Use this guide alongside the written findings and the original report transcript. It explains the purpose of each analytical figure and preserves the laboratory’s own figure labels. The interpretations apply to the tested specimen; signals alone do not establish the identity of every similar-looking stone.
Electron microscope image: This view shows small-scale regions selected for analysis. Its brightness contrast helps distinguish regions with different compositions; it is not a photograph of their natural colors. Numbered spots connect this view to the analyses listed in the report.
Laboratory figure caption: Fig. 1: Backscattered electron image (red aventurine)
Elemental spectrum: The peaks record characteristic X-ray signals from elements in the analyzed spot or area. This is an analysis of that location, not automatically of the entire specimen. Any mineral identification or uncertainty named in the laboratory caption is retained below.
Laboratory figure caption: Fig. 2: Energy dispersive spectrum of spot 1 in Fig. 1. (muscovite).
Elemental spectrum: The peaks record characteristic X-ray signals from elements in the analyzed spot or area. This is an analysis of that location, not automatically of the entire specimen. Any mineral identification or uncertainty named in the laboratory caption is retained below.
Laboratory figure caption: Fig. 3: Energy dispersive spectrum of spot 2 in Fig. 1. (quartz)
Read the report as text
Transcript of the original analytical report, including figure descriptions and findings.
                                                 Analytical Result Report

Sample id: 9056 (red aventurine)
Submitted by: K.Bitner
Date submitted: June 22, 2020
Date completed: June 27, 2020
Operating conditions: JEOL JSM-6400 operated at 25 kV acceleration potential, 15 mm working distance, 15 degrees
sample tilt, coated with 250 Å carbon. Using the X-ray fluorescence attachment with 35kv potental in conjunction with
the EDS system.


Fig. 1: Backscattered electron image (red aventurine)


Fig. 2: Energy dispersive spectrum of spot 1 in Fig. 1. (muscovite).
Fig. 3: Energy dispersive spectrum of spot 2 in Fig. 1. (quartz)


Fig. 4: Photomicrographs of the red aventurine. In the center is a colorless muscovite flake. Width of view 2 mm.


Summary of findings: Very interesting! The bulk material is quartz (Figs. 1 and 3) and it is full of colorless muscovite
flakes (Figs. 2 and 4) which at time are coated with a thin film of hematite, there are also tiny red hematite particles
throughout the quartz and the hematite is what gives it the color. The orientation of the tiny hematite flakes appears to
outline original quartz grains which then underwent metamorphism. The material is very clean looking at trace
elements, besides iron only a little zirconium, titanium and manganese were detected


Date: June 27 ,2020                         Signature
Lavender Rose Quartz sphere from our November 2025 personal collection release. The report below concerns a separately tested specimen.
Rose quartz can carry a distinctly lavender cast.
What the report found: The specimen is essentially natural quartz with widespread fluid and solid inclusions. The lab detected minor iron and titanium and did not observe dumortierite fibers at the examination scale.
The report suggests its lavender hue may involve structural defects together with iron and titanium effects; it does not assign a definitive single color mechanism. The original report's Table 1 heading says “aquamarine disk,” while the sample ID and findings identify this specimen as rose quartz. The original is shown unaltered below.
Transcript of the original analytical report, including figure descriptions and findings.
                                                Analytical Result Report

Sample id: 9213 (rose quartz)
Submitted by: K. Bitner
Date submitted: Oct. 16, 2020
Date completed: Nov. 2, 2020
Operating conditions: JEOL JSM-6400 operated at 25 kV acceleration potential, 15 mm working distance, 15 degrees
sample tilt, coated with 250 Å carbon. Using the X-ray fluorescence attachment with 35kv potental in conjunction with
the EDS system.


Fig. 1: Photograph of the specimen 30 mm wide.


Fig. 2. Enegry dispersive spectrum of the specimen. Essentially, a pretty clean quartz spectrum.
Fig. 3: Photomicrograph of nclusions in the specimen. 380 microns field of view. Image stacked from 12 images.


Fig. 4: Surface after etching with hydrofluoric acid. 380 microns field of view. Image stacked from 12 images.


Table 1: Trace element compositions of the aquamarine disk

 element
 Iron                                     253 ppm
 Titanium                                 128 ppm


Summary of findings: This is a very interesting specimen. Though essentially quartz (Figs. 1 and 2), it only shows very
minor trace element amounts, notably iron and titanium (Table 1). Fluid and solid inclusions are widespread, especially
along healed fractures. Many rose quartz specimens have inclusions of dumortierite needles which are believed to be
the cause of the color of rose quartz and also explains the asterism seen in some specimens. This specimen does not
show any dumortierite fibers but there have been documented cases of rose quartz which is lacking them. Or they may
be too small to make them visible. The specimen is doubtlessly natural in origin. The color is stronger with a distinctive
lavender hue but may be due to a combination of defects in the structure coupled with effects of iron and titanium,
possibly by intervalence charge transfer reactions. I have seen rose quartz that shows a range of hues from pink to
lavender.
Date: November 2,2020   Signature
Another tested example: blue and lavender bracelet
Sample 1210, completed December 24, 2024, contains both blue-patched and pink-to-lavender quartz beads. The blue material contains a high-aluminum silicate consistent with dumortierite; the pink-to-lavender beads are more manganese-rich and appear more like rose quartz. The laboratory describes dumortierite as a possible cause of the blue color, not a conclusively isolated species in every bead.
View the original report
Select a page to enlarge it. 2 pages; the findings are summarized in accessible text above.
A luminous feldspar sold as Russian Belomerite or Belomorite.
What the report found: The tested specimen is essentially albite with minor anorthite component. It shows schiller from subtle compositional banding and is described in the report as albite peristerite.
The report finds insufficient potassium for orthoclase or anorthoclase. It therefore does not identify this specimen as conventional potassium-feldspar moonstone. A locality can contain more than one feldspar variety; these findings describe the tested piece.
Transcript of the original analytical report, including figure descriptions and findings.
                                               Analytical Result Report

Sample id: 9246 (Russian Belomorite)
Submitted by: K. Bitner
Date submitted: Jan. 15, 2021
Date completed: Jan. 22, 2021
Operating conditions: JEOL JSM-6400 operated at 25 kV acceleration potential, 15 mm working distance, 15 degrees
sample tilt, coated with 250 Å carbon. Using the X-ray fluorescence attachment with 35kv potental in conjunction with
the EDS system.


Fig. 1: Photograph of the specimen, approximately 3.7x3.2x0.5 cm.
Fig. 2: Photograph of the specimen with lighting to show iridescence


Table 1: Compositions of the specimen (In weight percent)

 element
 Silicon dioxide              67.5
 Aluminum oxide               20.41
 Calcium oxide                0.85
 Potassium oxide              0.37
 Sodium oxide                 Ca. 10
 Manganese oxide              0.02
 Iron oxide                   0.01


Summary of findings:

This specimen is essentially albite with minor anorthite content (Fig. 1 and Table 1). It does exhibit some schiller effect
(Fig. 2). Compositionally, it does not have sufficient to make it a potassium feldspar/orthoclase and there it is not a true
moonstone. The potassium content also insufficient to make it an anorthoclase, a sodium-potassium feldspar that often
exhibits striking schiller effects. The specimen is a albite with schiller effect, an albite peristerite as it is often called. The
schiller is a result of compositionally slightly different bands from which the schiller emerges. A location that produces
material like this may also potentially produce true orthoclase or anorthoclase as deposits are generally somewhat
heterogenous.


Date: January 22, 2021                           Signature
The moonstone market name does not establish the feldspar species.
What the report found: This iridescent Russian specimen tested as albite with minor anorthite, not potassium-rich orthoclase or anorthoclase. Its schiller results from slight compositional differences between bands.
The lab calls it albite peristerite. “Moonstone” may be used broadly in gem trade language, but this report gives a more specific mineral identification for the examined specimen.
Transcript of the original analytical report, including figure descriptions and findings.
                                               Analytical Result Report

Sample id: 9246 (Russian Belomorite)
Submitted by: K. Bitner
Date submitted: Jan. 15, 2021
Date completed: Jan. 22, 2021
Operating conditions: JEOL JSM-6400 operated at 25 kV acceleration potential, 15 mm working distance, 15 degrees
sample tilt, coated with 250 Å carbon. Using the X-ray fluorescence attachment with 35kv potental in conjunction with
the EDS system.


Fig. 1: Photograph of the specimen, approximately 3.7x3.2x0.5 cm.
Fig. 2: Photograph of the specimen with lighting to show iridescence


Table 1: Compositions of the specimen (In weight percent)

 element
 Silicon dioxide              67.5
 Aluminum oxide               20.41
 Calcium oxide                0.85
 Potassium oxide              0.37
 Sodium oxide                 Ca. 10
 Manganese oxide              0.02
 Iron oxide                   0.01


Summary of findings:

This specimen is essentially albite with minor anorthite content (Fig. 1 and Table 1). It does exhibit some schiller effect
(Fig. 2). Compositionally, it does not have sufficient to make it a potassium feldspar/orthoclase and there it is not a true
moonstone. The potassium content also insufficient to make it an anorthoclase, a sodium-potassium feldspar that often
exhibits striking schiller effects. The specimen is a albite with schiller effect, an albite peristerite as it is often called. The
schiller is a result of compositionally slightly different bands from which the schiller emerges. A location that produces
material like this may also potentially produce true orthoclase or anorthoclase as deposits are generally somewhat
heterogenous.


Date: January 22, 2021                           Signature
Behind the trade names, the tested feldspar is albite.
What the report found: The composition is essentially albite with minor anorthite content. The specimen displays a schiller effect associated with fine compositional banding.
Its potassium level was too low for the lab to identify orthoclase or anorthoclase. The finding applies to this Russian specimen, not every item sold as Belomerite or Russian moonstone.
Transcript of the original analytical report, including figure descriptions and findings.
                                               Analytical Result Report

Sample id: 9246 (Russian Belomorite)
Submitted by: K. Bitner
Date submitted: Jan. 15, 2021
Date completed: Jan. 22, 2021
Operating conditions: JEOL JSM-6400 operated at 25 kV acceleration potential, 15 mm working distance, 15 degrees
sample tilt, coated with 250 Å carbon. Using the X-ray fluorescence attachment with 35kv potental in conjunction with
the EDS system.


Fig. 1: Photograph of the specimen, approximately 3.7x3.2x0.5 cm.
Fig. 2: Photograph of the specimen with lighting to show iridescence


Table 1: Compositions of the specimen (In weight percent)

 element
 Silicon dioxide              67.5
 Aluminum oxide               20.41
 Calcium oxide                0.85
 Potassium oxide              0.37
 Sodium oxide                 Ca. 10
 Manganese oxide              0.02
 Iron oxide                   0.01


Summary of findings:

This specimen is essentially albite with minor anorthite content (Fig. 1 and Table 1). It does exhibit some schiller effect
(Fig. 2). Compositionally, it does not have sufficient to make it a potassium feldspar/orthoclase and there it is not a true
moonstone. The potassium content also insufficient to make it an anorthoclase, a sodium-potassium feldspar that often
exhibits striking schiller effects. The specimen is a albite with schiller effect, an albite peristerite as it is often called. The
schiller is a result of compositionally slightly different bands from which the schiller emerges. A location that produces
material like this may also potentially produce true orthoclase or anorthoclase as deposits are generally somewhat
heterogenous.


Date: January 22, 2021                           Signature
A sphere marketed as sodalite reveals a complex rock under testing.
What the report found: The laboratory identified sodalite and albite together with nepheline, magnesian iron-bearing calcite, biotite–phlogopite series mica and ilmenite. Quartz was not identified.
The assemblage is consistent with an alkaline, silica-poor intrusive setting. “Sodalite sphere” is a useful retail description, but it does not mean the entire sphere is a single pure mineral.
View the original report
Select a page to enlarge it. The text transcript below provides another way to read the findings.
Use this guide alongside the written findings and the original report transcript. It explains the purpose of each analytical figure and preserves the laboratory’s own figure labels. The interpretations apply to the tested specimen; signals alone do not establish the identity of every similar-looking stone.
Electron microscope image: This view shows small-scale regions selected for analysis. Its brightness contrast helps distinguish regions with different compositions; it is not a photograph of their natural colors. Numbered spots connect this view to the analyses listed in the report.
Laboratory figure caption: Fig. 1: Backscattered electron image (sodalite sphere)
Elemental spectrum: The peaks record characteristic X-ray signals from elements in the analyzed spot or area. This is an analysis of that location, not automatically of the entire specimen. Any mineral identification or uncertainty named in the laboratory caption is retained below.
Laboratory figure caption: Fig. 2: Energy dispersive spectrum of spot 1 in Fig. 1. (magnesian ferroan calcite with minor manganese contribution)
Elemental spectrum: The peaks record characteristic X-ray signals from elements in the analyzed spot or area. This is an analysis of that location, not automatically of the entire specimen. Any mineral identification or uncertainty named in the laboratory caption is retained below.
Laboratory figure caption: Fig. 3: Energy dispersive spectrum of spot 2 in Fig. 1. (biotite-phlogopite)
Elemental spectrum: The peaks record characteristic X-ray signals from elements in the analyzed spot or area. This is an analysis of that location, not automatically of the entire specimen. Any mineral identification or uncertainty named in the laboratory caption is retained below.
Laboratory figure caption: Fig. 4: Energy dispersive spectrum of spot 3 in Fig. 1. (ilmenite)
Elemental spectrum: The peaks record characteristic X-ray signals from elements in the analyzed spot or area. This is an analysis of that location, not automatically of the entire specimen. Any mineral identification or uncertainty named in the laboratory caption is retained below.
Laboratory figure caption: Fig. 5: Energy dispersive spectrum of spot 4 in Fig. 1. (nepheline)
Electron microscope image: This view shows small-scale regions selected for analysis. Its brightness contrast helps distinguish regions with different compositions; it is not a photograph of their natural colors. Numbered spots connect this view to the analyses listed in the report.
Laboratory figure caption: Fig. 6: Backscattered electron image (sodalite sphere)
Elemental spectrum: The peaks record characteristic X-ray signals from elements in the analyzed spot or area. This is an analysis of that location, not automatically of the entire specimen. Any mineral identification or uncertainty named in the laboratory caption is retained below.
Laboratory figure caption: Fig. 7: Energy dispersive spectrum of spot 6 in Fig. 6. (albite)
Electron microscope image: This view shows small-scale regions selected for analysis. Its brightness contrast helps distinguish regions with different compositions; it is not a photograph of their natural colors. Numbered spots connect this view to the analyses listed in the report.
Laboratory figure caption: Fig. 8: Backscattered electron image (sodalite sphere)
Elemental spectrum: The peaks record characteristic X-ray signals from elements in the analyzed spot or area. This is an analysis of that location, not automatically of the entire specimen. Any mineral identification or uncertainty named in the laboratory caption is retained below.
Laboratory figure caption: Fig. 9: Energy dispersive spectrum of spot 3 in Fig. 8. (sodalite)
Read the report as text
Transcript of the original analytical report, including figure descriptions and findings.
                                                Analytical Result Report

Sample id: 9147 (sodalite sphere)
Submitted by: K.Bitner
Date submitted: July 31, 2020
Date completed: August 5, 2020
Operating conditions: JEOL JSM-6400 operated at 25 kV acceleration potential, 15 mm working distance, 15 degrees
sample tilt, coated with 250 Å carbon. Using the X-ray fluorescence attachment with 35kv potental in conjunction with
the EDS system.


Fig. 1: Backscattered electron image (sodalite sphere)


Fig. 2: Energy dispersive spectrum of spot 1 in Fig. 1. (magnesian ferroan calcite with minor manganese contribution)
Fig. 3: Energy dispersive spectrum of spot 2 in Fig. 1. (biotite-phlogopite)


Fig. 4: Energy dispersive spectrum of spot 3 in Fig. 1. (ilmenite)


                                                                               )

Fig. 5: Energy dispersive spectrum of spot 4 in Fig. 1. (nepheline)
Fig. 6: Backscattered electron image (sodalite sphere)


Fig. 7: Energy dispersive spectrum of spot 6 in Fig. 6. (albite)
Fig. 8: Backscattered electron image (sodalite sphere)


Fig. 9: Energy dispersive spectrum of spot 3 in Fig. 8. (sodalite)


Summary of findings: This is a very complex specimen! It stems from an alkalic intrusive, silica deficient, thus no quartz
but instead feldspars (Figs. 1, 5, 6 and 7) and feldspathoids such as nepheline and sodalite (Figs. 8 and 9) are present. In
this case, we see albite, sodalite. Associated minerals include a magnesian ferroan calcite (Figs. 1 and 2) , biotite-
phlogopite series micas (Figs. 1 and 3) , ilmenite (Figs. 1 and 4). Alkalic complexes frequently harbor carbonatite bodies,
the presence of carbonates in this sample suggest that this location could have been one of those bodies.


Date: August 5 ,2020                         Signature
Pink, tan, and nearly white layers tell a more complex story in this Peruvian sphere.
What the report found: The report documents fluorescent and non-fluorescent areas under shortwave ultraviolet light. It identifies opal alongside chalcedony/quartz grains, clay-associated elements and iron-rich coloration.
Iron is the likely cause of the pink color in this specimen. The lab observed that uranium abundance tracks the fluorescent portions; this compositional correlation is not a radiation exposure assessment. The partially crystallized silica offers a view of opal's geological transformation toward chalcedony and quartz.
View the original report
Select a page to enlarge it. The text transcript below provides another way to read the findings.
Transcript of the original analytical report, including figure descriptions and findings.
                                                 Analytical Result Report

Sample id: 9214 (pink opal sphere)
Submitted by: K. Bitner
Date submitted: Oct. 16, 2020
Date completed: Nov. 4, 2020
Operating conditions: JEOL JSM-6400 operated at 25 kV acceleration potential, 15 mm working distance, 15 degrees
sample tilt, coated with 250 Å carbon. Using the X-ray fluorescence attachment with 35kv potental in conjunction with
the EDS system.


Fig. 1: Photograph of the specimen, approximately 37 mm wide. In daylight on the left, in SW UV on the right.


Fig. 2: Photomicrograph grains of the opal sphere under palne polarized light (left) and crossed Nichols (right). 750
microns field of view. A portion of the grains are optically anisotropic (quartz), some are isotropic (opal) and some are
opaque (oxides and oxide-stained clays).
Table 1: Compositions of the different areas in the sphere (remainder is silicon and water)

 element                          Pink non-fluorescent areas       Fluorescent areas               Brown to tan areas
 Iron                             2350 ppm                         350 ppm                         1.56 wt. %
 Manganese                        240 ppm                          105 ppm                         354 ppm
 Uranium                          215 ppm                          850 pm                          150 ppm
 Magnesium                        3.4 wt. %                        4.0 wt. %                       4.1 wt. %
 Aluminum                         3.95 wt. %                       4.36 wt. %                      3.89 wt. %


Summary of findings: A lot is going on in the specimen! There are pink, almost white and tan to brown areas,
fluorescent and non-fluorescent areas (Fig. 1). Interesting to note that in the pink areas, iron is the likely chromophore,
there is not enough manganese present to cause the color (Table 1). Once iron increases to higher concentrations, the
areas turn brown. Uranium abundance coincides very well with the fluorescence. The magnesium and aluminum
contents are likely present in clay species which are finely divided throughout the specimen. An interesting finding is the
fact that some of the opal has converted to chalcedony/quartz (Fig. 2). The bright grains under crossed Nichols are
crystalline quartz whereas the dark grains are isotropic opal. This is common as opal is geologically speaking not stable
for long periods of time and will slowly begin to crystallize. Here is an example of this process!

This specimen likely had its origin from altered volcanic ash, silica typically weathers out and may move a distance and
then precipitate as a silica-rich gel which turns into opal and then into chalcedony/quartz. The clays are likely part of the
weathered volcanic ash. The magnesium content suggests a volcanic as of intermediate to mafic type. Possibly
andesitic to basaltic originally, this also explains the iron content. As is evident, some stratification is still preserved in
the material.


Date: November 4, 2020                           Signature
The purple portion of this Chinese palm stone was identified as anhydrite, accompanied by calcite and phlogopite.
The tested identification: The purple portion of this Chinese palm stone was identified as anhydrite, accompanied by calcite and phlogopite.
The tested palm stone was reported from China. The laboratory describes its purple portion as anhydrite with elevated strontium. The pink portion is magnesium-bearing calcite, and the black mica is phlogopite. Its olive-green phase was not conclusively identified; the report discusses a possible amphibole and calls for more study.
Anhydrite (CaSO₄) and gypsum (CaSO₄·2H₂O) are distinct minerals. Selenite is a variety of gypsum. “Angelite” is a gem trade term for a blue gray anhydrite material from Peru, rather than a separate mineral species. This Chinese purple specimen is accurately identified by its test as anhydrite.
                                               Analytical Result Report

Sample id: 9252 (Purple palm)
Submitted by: K. Bitner
Date submitted: Jan. 15, 2021.
Date completed: Jan. 27, 2021.
Operating conditions: JEOL JSM-6400 operated at 25 kV acceleration potential, 15 mm working distance, 15 degrees
sample tilt, coated with 250 Å carbon. Using the X-ray fluorescence attachment with 35kv potental in conjunction with
the EDS system.


Fig. 1: Photograph of the specimen, approximately 45x44x20 mm.


Table 1: Compositions of the specimen (In weight percent)

 element                  purple                  Olive green             pink                   black
 Silicon dioxide          0.15                    55.92                   0.37                   41.11
 Aluminum oxide           nd                      7.18                    0.23                   11.77
 Calcium oxide            39.5                    14.42                   48.22                  0.22
 Magnesium oxide          0.1                     20.52                   3.11                   25.88
 Sulfur trioxide          57.9                    0.12                    0.11                   0.14
 Iron oxide               0.02                    2.49                    0.27                   3.12
 Strontium oxide          0.66                    nd                      0.13                   0.04
 Titanium oxide           nd                      0.18                    nd                     0.65
 Manganese oxide          nd                      nd                      0.33                   0.08
 Potassium oxide          nd                      0.11                    nd                     11.09
 Vanadium oxide           nd                      nd                      nd                     0.03
 Chlorine                 nd                      0.31                    nd                     nd
Summary of findings: This is a very unusual specimen (Fig. 1)! The light purple material is anhydrite (Table 1). The
strontium content is elevated which is interesting. The olive-green material is problematic, it looks a lot like an epidote
group mineral visually but the high magnesium content is a problem, optically is not a good match either. Rather, it
could be an amphibole group member such as something between pargasite/tremolite. This mineral needs more
scrutiny. Chlorine is notable (Table 1), another link to an original evaporite origin. The pink material is a carbonate,
essentially a calcite with magnesium as the man substituting element and lesser amounts of iron and manganese (Table
1). The black mica is phlogopite. Magnesium is dominant over iron (Table 1), interesting to note a little vanadium is
present. The origin of this material may be a result of skarn formation of an original evaporite-rich sedimentary
sequence in proximity or contact with an igneous intrusion or under strong tectonic conditions at depth.


Date: January 27, 2021                        Signature
A search path for “purple angelite.” The tested purple phase is anhydrite; angelite is a trade name for a particular blue gray anhydrite gem material, not a distinct mineral.
About the market name: A search path for “purple angelite.” The tested purple phase is anhydrite; angelite is a trade name for a particular blue gray anhydrite gem material, not a distinct mineral.
The tested palm stone was reported from China. The laboratory describes its purple portion as anhydrite with elevated strontium. The pink portion is magnesium-bearing calcite, and the black mica is phlogopite. Its olive-green phase was not conclusively identified; the report discusses a possible amphibole and calls for more study.
Anhydrite (CaSO₄) and gypsum (CaSO₄·2H₂O) are distinct minerals. Selenite is a variety of gypsum. “Angelite” is a gem trade term for a blue gray anhydrite material from Peru, rather than a separate mineral species. This Chinese purple specimen is accurately identified by its test as anhydrite.
                                               Analytical Result Report

Sample id: 9252 (Purple palm)
Submitted by: K. Bitner
Date submitted: Jan. 15, 2021.
Date completed: Jan. 27, 2021.
Operating conditions: JEOL JSM-6400 operated at 25 kV acceleration potential, 15 mm working distance, 15 degrees
sample tilt, coated with 250 Å carbon. Using the X-ray fluorescence attachment with 35kv potental in conjunction with
the EDS system.


Fig. 1: Photograph of the specimen, approximately 45x44x20 mm.


Table 1: Compositions of the specimen (In weight percent)

 element                  purple                  Olive green             pink                   black
 Silicon dioxide          0.15                    55.92                   0.37                   41.11
 Aluminum oxide           nd                      7.18                    0.23                   11.77
 Calcium oxide            39.5                    14.42                   48.22                  0.22
 Magnesium oxide          0.1                     20.52                   3.11                   25.88
 Sulfur trioxide          57.9                    0.12                    0.11                   0.14
 Iron oxide               0.02                    2.49                    0.27                   3.12
 Strontium oxide          0.66                    nd                      0.13                   0.04
 Titanium oxide           nd                      0.18                    nd                     0.65
 Manganese oxide          nd                      nd                      0.33                   0.08
 Potassium oxide          nd                      0.11                    nd                     11.09
 Vanadium oxide           nd                      nd                      nd                     0.03
 Chlorine                 nd                      0.31                    nd                     nd
Summary of findings: This is a very unusual specimen (Fig. 1)! The light purple material is anhydrite (Table 1). The
strontium content is elevated which is interesting. The olive-green material is problematic, it looks a lot like an epidote
group mineral visually but the high magnesium content is a problem, optically is not a good match either. Rather, it
could be an amphibole group member such as something between pargasite/tremolite. This mineral needs more
scrutiny. Chlorine is notable (Table 1), another link to an original evaporite origin. The pink material is a carbonate,
essentially a calcite with magnesium as the man substituting element and lesser amounts of iron and manganese (Table
1). The black mica is phlogopite. Magnesium is dominant over iron (Table 1), interesting to note a little vanadium is
present. The origin of this material may be a result of skarn formation of an original evaporite-rich sedimentary
sequence in proximity or contact with an igneous intrusion or under strong tectonic conditions at depth.


Date: January 27, 2021                        Signature
A search path for a stone offered as “purple selenite.” Testing found anhydrite in its purple phase, while selenite is a variety of gypsum.
A mistaken name for this specimen: A search path for a stone offered as “purple selenite.” Testing found anhydrite in its purple phase, while selenite is a variety of gypsum.
The tested palm stone was reported from China. The laboratory describes its purple portion as anhydrite with elevated strontium. The pink portion is magnesium-bearing calcite, and the black mica is phlogopite. Its olive-green phase was not conclusively identified; the report discusses a possible amphibole and calls for more study.
Anhydrite (CaSO₄) and gypsum (CaSO₄·2H₂O) are distinct minerals. Selenite is a variety of gypsum. “Angelite” is a gem trade term for a blue gray anhydrite material from Peru, rather than a separate mineral species. This Chinese purple specimen is accurately identified by its test as anhydrite.
                                               Analytical Result Report

Sample id: 9252 (Purple palm)
Submitted by: K. Bitner
Date submitted: Jan. 15, 2021.
Date completed: Jan. 27, 2021.
Operating conditions: JEOL JSM-6400 operated at 25 kV acceleration potential, 15 mm working distance, 15 degrees
sample tilt, coated with 250 Å carbon. Using the X-ray fluorescence attachment with 35kv potental in conjunction with
the EDS system.


Fig. 1: Photograph of the specimen, approximately 45x44x20 mm.


Table 1: Compositions of the specimen (In weight percent)

 element                  purple                  Olive green             pink                   black
 Silicon dioxide          0.15                    55.92                   0.37                   41.11
 Aluminum oxide           nd                      7.18                    0.23                   11.77
 Calcium oxide            39.5                    14.42                   48.22                  0.22
 Magnesium oxide          0.1                     20.52                   3.11                   25.88
 Sulfur trioxide          57.9                    0.12                    0.11                   0.14
 Iron oxide               0.02                    2.49                    0.27                   3.12
 Strontium oxide          0.66                    nd                      0.13                   0.04
 Titanium oxide           nd                      0.18                    nd                     0.65
 Manganese oxide          nd                      nd                      0.33                   0.08
 Potassium oxide          nd                      0.11                    nd                     11.09
 Vanadium oxide           nd                      nd                      nd                     0.03
 Chlorine                 nd                      0.31                    nd                     nd
Summary of findings: This is a very unusual specimen (Fig. 1)! The light purple material is anhydrite (Table 1). The
strontium content is elevated which is interesting. The olive-green material is problematic, it looks a lot like an epidote
group mineral visually but the high magnesium content is a problem, optically is not a good match either. Rather, it
could be an amphibole group member such as something between pargasite/tremolite. This mineral needs more
scrutiny. Chlorine is notable (Table 1), another link to an original evaporite origin. The pink material is a carbonate,
essentially a calcite with magnesium as the man substituting element and lesser amounts of iron and manganese (Table
1). The black mica is phlogopite. Magnesium is dominant over iron (Table 1), interesting to note a little vanadium is
present. The origin of this material may be a result of skarn formation of an original evaporite-rich sedimentary
sequence in proximity or contact with an igneous intrusion or under strong tectonic conditions at depth.


Date: January 27, 2021                        Signature
An Indian pyrite tower with an unexpected dark end.
What the report found: The metallic area is pyrite. The sharply bounded black area is calcite colored by finely divided pyrite, with notably more zinc than the pyrite area.
Pyrite occurs in many countries. India is the reported source of this particular tower; the laboratory report establishes its composition, not its geographic origin. The tested specimen measured about 66 mm along its longest dimension.
View the original report
Select a page to enlarge it. A text transcript appears below.
Use this guide alongside the written findings and the original report transcript. It explains the purpose of each analytical figure and preserves the laboratory’s own figure labels. The interpretations apply to the tested specimen; signals alone do not establish the identity of every similar-looking stone.
Elemental spectrum: The peaks record characteristic X-ray signals from elements in the analyzed spot or area. This is an analysis of that location, not automatically of the entire specimen. Any mineral identification or uncertainty named in the laboratory caption is retained below.
Laboratory figure caption: Fig. 2: Energy dispersive spectral analysis of pyrite area in Fig. 1.
Elemental spectrum: The peaks record characteristic X-ray signals from elements in the analyzed spot or area. This is an analysis of that location, not automatically of the entire specimen. Any mineral identification or uncertainty named in the laboratory caption is retained below.
Laboratory figure caption: Fig. 3: Energy dispersive spectral analysis of black area in Fig. 1.
Read the report as text
Transcript of the analytical report, including the compositional table.
                                                    Analytical Result Report

Sample id: 9194 (pyrite tower)
Submitted by: K.Bitner
Date submitted: Sept. 9, 2020
Date completed: Sept. 16, 2020
Operating conditions: JEOL JSM-6400 operated at 25 kV acceleration potential, 15 mm working distance, 15 degrees
sample tilt, coated with 250 Å carbon. Using the X-ray fluorescence attachment with 35kv potental in conjunction with
the EDS system.


Fig. 1: Photograph of the pyrite tower. Maximum dimension is 66 mm. Note black end.


Fig. 2: Energy dispersive spectral analysis of pyrite area in Fig. 1.
Fig. 3: Energy dispersive spectral analysis of black area in Fig. 1.


Table 1: compositional results for the pyrite and black calcite areas

 element                                    Pyrite area                              Black area
 Iron                                       46.44 wt. %                              8650 ppm
 Sulfur                                     53.21 wt. %                              6800 ppm
 Manganese                                  44 ppm                                   344 ppm
 Molybdenum                                 48 ppm                                   Not detected
 Nickel                                     240 ppm                                  Not detected
 Arsenic                                    809 ppm                                  Not detected
 Zinc                                       65 ppm                                   3100 ppm
 Calcium                                    Not detected                             53.3 wt. %


Summary of findings: This is a very interesting specimen! A sharp boundary between the pyrite and black material is
very noticeable (Fig. 1). The pyrite is clean with only minor trace elements present (Fig. 1 and table 1). The black
material is calcite (Fig. 3, table 1), colored by finely divided pyrite! Interesting to note is the much higher concentration
of zinc in the calcite compared to the pyrite.


Date: September 16 ,2020                            Signature
A decorative stone from India, often used as natural stone tile, examined beneath its market name.
What the report found: This tested Panther Stone palm is mainly serpentine. It also contains spinel-group mineral grains, magnesium-bearing calcite, and iron-bearing magnesium calcite.
“Panther Stone” is the name used for this material in the market. The laboratory interprets this specimen as a low-grade metamorphic rock formed under water-rich conditions from an ultramafic precursor. Its spinel-group grains have a composition between spinel, chromite, and magnetite; the report does not assign them a single end-member species.
India is the reported source, and the material is also used as decorative natural stone tile. The analytical report identifies components in the submitted palm stone; it does not independently verify the stone's locality or establish the composition of every tile sold under the same trade name.
View the original report
Select a page to enlarge it. A text transcript appears below.
Use this guide alongside the written findings and the original report transcript. It explains the purpose of each analytical figure and preserves the laboratory’s own figure labels. The interpretations apply to the tested specimen; signals alone do not establish the identity of every similar-looking stone.
Electron microscope image: This view shows small-scale regions selected for analysis. Its brightness contrast helps distinguish regions with different compositions; it is not a photograph of their natural colors. Numbered spots connect this view to the analyses listed in the report.
Elemental spectrum: The peaks record characteristic X-ray signals from elements in the analyzed spot or area. This is an analysis of that location, not automatically of the entire specimen. Any mineral identification or uncertainty named in the laboratory caption is retained below.
Laboratory figure caption: Fig. 2: Energy dispersive spectrum of spot 1 in Fig. 1. (spinel group)
Elemental spectrum: The peaks record characteristic X-ray signals from elements in the analyzed spot or area. This is an analysis of that location, not automatically of the entire specimen. Any mineral identification or uncertainty named in the laboratory caption is retained below.
Laboratory figure caption: Fig. 3: Energy dispersive spectrum of spot 3 in Fig. 1. (serpentine group)
Elemental spectrum: The peaks record characteristic X-ray signals from elements in the analyzed spot or area. This is an analysis of that location, not automatically of the entire specimen. Any mineral identification or uncertainty named in the laboratory caption is retained below.
Laboratory figure caption: Fig. 4: Energy dispersive spectrum of spot 5 in Fig. 1. (ferroan magnesian calcite)
Elemental spectrum: The peaks record characteristic X-ray signals from elements in the analyzed spot or area. This is an analysis of that location, not automatically of the entire specimen. Any mineral identification or uncertainty named in the laboratory caption is retained below.
Laboratory figure caption: Fig. 5: Energy dispersive spectrum of spot 6 in Fig. 1. (magnesian calcite)
Read the report as text
                                                  Analytical Result Report

Sample id: 9146 (palm panther stone)
Submitted by: K.Bitner
Date submitted: July 31, 2020
Date completed: August 4, 2020
Operating conditions: JEOL JSM-6400 operated at 25 kV acceleration potential, 15 mm working distance, 15 degrees
sample tilt, coated with 250 Å carbon. Using the X-ray fluorescence attachment with 35kv potental in conjunction with
the EDS system.


Fig. 1: Backscattered electron image (palm panther stone)


                                                                               )

Fig. 2: Energy dispersive spectrum of spot 1 in Fig. 1. (spinel group)
Fig. 3: Energy dispersive spectrum of spot 3 in Fig. 1. (serpentine group)


Fig. 4: Energy dispersive spectrum of spot 5 in Fig. 1. (ferroan magnesian calcite)


Fig. 5: Energy dispersive spectrum of spot 6 in Fig. 1. (magnesian calcite)


)
Summary of findings: A very interesting one! It is mainly composed of serpentine (Figs. 1 and 3), so it is a low-grade
metamorphic rock that formed under hydrous metamorphic conditions from an ultramafic rock originally rich in olivine.
Very intriguing to see the grains of a spinel group mineral (Figs. 1` and 2), compositionally, it is intermediate between
spinel, chromite and magnetite! Carbonates are present as well and consist of a magnesian calcite and a ferroan
magnesian calcite (Figs. 1, 3 and 5).


Date: August 4 ,2020                        Signature
Chrysocolla in Quartz · Soul Body Gems, January 2024.
Chrysocolla in a quartz-rich Peruvian breccia.
What the report found: Quartz-rich breccia, blue and green chrysocolla, and minor malachite.
This approximately 47 mm sphere was reported from Peru. The laboratory describes a quartz-rich breccia with copper mineralization: blue and green chrysocolla occurs in small cavities, with minor malachite. The report suggests malachite formed earlier than the chrysocolla; possible partial replacement is presented as an interpretation, not a confirmed sequence for every area.
“Quantum Quattro” is a market label applied to mixed copper-bearing stones, but it is not an identification established by this test. This specimen has its own composition and is distinct from the other Peruvian chrysocolla entries in our directory. Its tested components should be described directly rather than treated as a single named mineral.
                                                 Analytical Result Report

Sample id: 9251 (Peruvian chrysocolla sphere)
Submitted by: K. Bitner
Date submitted: Jan. 15, 2021.
Date completed: Jan. 26, 2021.
Operating conditions: JEOL JSM-6400 operated at 25 kV acceleration potential, 15 mm working distance, 15 degrees
sample tilt, coated with 250 Å carbon. Using the X-ray fluorescence attachment with 35kv potental in conjunction with
the EDS system.


Fig. 1: Photograph of the specimen, approximately 47 mm diameter


Fig. 2: Close-ups of the specimen. Left: area with several small cavities. Field of view: 5 mm.
Middle: view of a chrysocolla-lined small cavity. Field of view 1.5 mm.
Right: chrysocolla with a little malachite. Field of view: 1.5 mm.
Table 1: Compositions of the specimen (In weight percent)

 element
 Silicon dioxide            37.52
 Aluminum oxide             1.94
 Calcium oxide              0.25
 Magnesium oxide            0.88
 Iron oxide                 0.71
 Copper oxide               35.7
 Zink oxide                 1.21
 Manganese oxide            0.77


Summary of findings: The specimen is a sphere made from a quartz-rich breccia with copper mineralization (Fig. 1).
Some open voids remain (Fig. 2 left) and are filled with rounded masses of blue chrysocolla (Fig. 2 middle). Minor
malachite has been noted coated with blue chrysocolla (Fig. 2 right). Chemically. Copper and silicon oxide are dominant,
but a number of elements are evidently substituting for copper or are inclusions of oxides or other species: zinc,
magnesium, calcium, iron, manganese and aluminum. Some of the chrysocolla is blue, some is green, this is not unusual
for chrysocolla. The earlier copper mineral manifestation here was malachite which was followed by chrysocolla. It is
possible also that the green chrysocolla has partially replaced malachite and some is still present.


Date: January 26, 2021                       Signature
Chrysocolla in Quartz · Soul Body Gems, January 2024.
A market-name search for a tested Peruvian chrysocolla-bearing sphere.
What the report found: Quartz-rich breccia with chrysocolla and minor malachite, rather than a distinct “Quantum Quattro” mineral species.
This approximately 47 mm sphere was reported from Peru. The laboratory describes a quartz-rich breccia with copper mineralization: blue and green chrysocolla occurs in small cavities, with minor malachite. The report suggests malachite formed earlier than the chrysocolla; possible partial replacement is presented as an interpretation, not a confirmed sequence for every area.
“Quantum Quattro” is a market label applied to mixed copper-bearing stones, but it is not an identification established by this test. This specimen has its own composition and is distinct from the other Peruvian chrysocolla entries in our directory. Its tested components should be described directly rather than treated as a single named mineral.
                                                 Analytical Result Report

Sample id: 9251 (Peruvian chrysocolla sphere)
Submitted by: K. Bitner
Date submitted: Jan. 15, 2021.
Date completed: Jan. 26, 2021.
Operating conditions: JEOL JSM-6400 operated at 25 kV acceleration potential, 15 mm working distance, 15 degrees
sample tilt, coated with 250 Å carbon. Using the X-ray fluorescence attachment with 35kv potental in conjunction with
the EDS system.


Fig. 1: Photograph of the specimen, approximately 47 mm diameter


Fig. 2: Close-ups of the specimen. Left: area with several small cavities. Field of view: 5 mm.
Middle: view of a chrysocolla-lined small cavity. Field of view 1.5 mm.
Right: chrysocolla with a little malachite. Field of view: 1.5 mm.
Table 1: Compositions of the specimen (In weight percent)

 element
 Silicon dioxide            37.52
 Aluminum oxide             1.94
 Calcium oxide              0.25
 Magnesium oxide            0.88
 Iron oxide                 0.71
 Copper oxide               35.7
 Zink oxide                 1.21
 Manganese oxide            0.77


Summary of findings: The specimen is a sphere made from a quartz-rich breccia with copper mineralization (Fig. 1).
Some open voids remain (Fig. 2 left) and are filled with rounded masses of blue chrysocolla (Fig. 2 middle). Minor
malachite has been noted coated with blue chrysocolla (Fig. 2 right). Chemically. Copper and silicon oxide are dominant,
but a number of elements are evidently substituting for copper or are inclusions of oxides or other species: zinc,
magnesium, calcium, iron, manganese and aluminum. Some of the chrysocolla is blue, some is green, this is not unusual
for chrysocolla. The earlier copper mineral manifestation here was malachite which was followed by chrysocolla. It is
possible also that the green chrysocolla has partially replaced malachite and some is still present.


Date: January 26, 2021                       Signature
A pink tower from India with a finely mixed mineral texture.
What the report found: Fine silty dolomite with roughly similar amounts of dolomite and silty quartz, plus minor clay minerals. The difference between light and dark pink areas is mainly associated with iron concentration.
The submitted tower measured approximately 84 mm. The laboratory noted a uniformly fine grain and proposed illite as a possible minor clay species. “Pink Dolomite” is the practical directory name for this specimen; the report describes a mixed dolomite–quartz rock rather than a pure dolomite crystal.
View the original report
Select a page to enlarge it. A text transcript appears below.
Use this guide alongside the written findings and the original report transcript. It explains the purpose of each analytical figure and preserves the laboratory’s own figure labels. The interpretations apply to the tested specimen; signals alone do not establish the identity of every similar-looking stone.
Elemental spectrum: The peaks record characteristic X-ray signals from elements in the analyzed spot or area. This is an analysis of that location, not automatically of the entire specimen. Any mineral identification or uncertainty named in the laboratory caption is retained below.
Laboratory figure caption: Fig. 2: Energy dispersive spectral analysis of the light pink brown area in Fig. 1.
Read the report as text
                                                   Analytical Result Report

Sample id: 9193 (pink tower from India)
Submitted by: K.Bitner
Date submitted: Sept. 9, 2020
Date completed: Sept. 16, 2020
Operating conditions: JEOL JSM-6400 operated at 25 kV acceleration potential, 15 mm working distance, 15 degrees
sample tilt, coated with 250 Å carbon. Using the X-ray fluorescence attachment with 35kv potental in conjunction with
the EDS system.


Fig. 1: Photograph of the pink tower. Maximum dimension is 84 mm


Fig. 2: Energy dispersive spectral analysis of the light pink brown area in Fig. 1.
Table 1: compositional results for the light pink and darker pink areas

 element                                   Light pink                                Dark pink
 Iron                                      1200 ppm                                  3700 ppm
 Titanium                                  2080 ppm                                  2000 ppm
 Manganese                                 220 ppm                                   272 ppm
 Potassium                                 650 ppm                                   600 ppm


Summary of findings: This is a beautiful tower! Compositionally, it is fine silty dolomite with similar amounts of
dolomite and silty quartz (Figs. 1 and 2, Table 1). Minor clay species are also present, likely some illite. The color in the
light and dark pink areas is dominantly the result of iron concentration (Table 1). What strikes me is the uniformly fine
grain of the specimen.


Date: September 16 ,2020                           Signature
Polish Flint Spheres · Soul Body Gems, September 2024.
A Polish flint specimen from Sandomierz with delicate natural banding.
What the report found: Very clean flint, approximately 99.8 wt.% silicon dioxide in the reported analysis.
The laboratory describes the banding as resembling Liesegang patterns. Its suggested formation from sedimentary silica gel, possibly related to sponge spicules, is a hypothesis. Tiny bright particles may be a calcium sulfate mineral such as gypsum or anhydrite; the report does not resolve which one.
View the original report
Select a page to enlarge it. A text transcript appears below.
Use this guide alongside the written findings and the original report transcript. It explains the purpose of each analytical figure and preserves the laboratory’s own figure labels. The interpretations apply to the tested specimen; signals alone do not establish the identity of every similar-looking stone.
Electron microscope image: This view shows small-scale regions selected for analysis. Its brightness contrast helps distinguish regions with different compositions; it is not a photograph of their natural colors. Numbered spots connect this view to the analyses listed in the report.
Laboratory figure caption: Fig. 2: Backscattered electron image of the specimen showing some tiny bright particles
Read the report as text
                                               Analytical Result Report

Sample id: 9256 (Polish flint from Sandomierz)
Submitted by: K. Bitner
Date submitted: Jan. 15, 2021.
Date completed: Jan. 29, 2021.
Operating conditions: An AMRAY 1930 SEM, opeprated at 20 kV acceleration potential, 10 mm working distance, 15
degrees sample tilt, coated with 250 Å carbon. Using the X-ray fluorescence attachment with 35kv potental in
conjunction with the EDS system.


Fig. 1: Photograph of the specimen, approximately 32x30x9 mm diameter.


Fig. 2: Backscattered electron image of the specimen showing some tiny bright particles
Table 1: Compositions of the specimen (In weight percent)

 element
 Silicon dioxide           99.8
 Calcium oxide             0.04
 Sulfur trioxide           0.04


Summary of findings: This is very clean flint (Table 1 and Fig. 1). It may have formed from a gel in sediment during
diagenesis, possibly, the silica gel was derived from sponge spicules. The banding resembles Liesegang banding, a result
of differential transport of impurities and ions. Fig. 2 shows some tiny particles under backscattered electron imaging,
they appear to have higher atomic weight than the silica and are possible inclusions of a calcium sulfate mineral such as
gypsum or anhydrite, the only other elements detected.


Date: January 29, 2021                        Signature
Personal Collection Release: Plum Blossom Jade · Soul Body Gems, October 2024.
A Malagasy sphere sold under the name “Plum Blossom Jade.”
What the report found: The dark areas are mainly hematite and magnetite, while the contrasting mass is serpentine. The tested material was magnetic.
The laboratory interprets the serpentine as altered olivine after hydrous metamorphism. A lighter rim has a similar composition to its darker core; the report suggests grain size may explain the visual difference. The analysis did not identify jadeite or nephrite, so “jade” here is a market name rather than the tested mineral identity.
We will add the broader history and background of this material when our research is ready.
View the original report
Select a page to enlarge it. A text transcript appears below.
Use this guide alongside the written findings and the original report transcript. It explains the purpose of each analytical figure and preserves the laboratory’s own figure labels. The interpretations apply to the tested specimen; signals alone do not establish the identity of every similar-looking stone.
Electron microscope image: This view shows small-scale regions selected for analysis. Its brightness contrast helps distinguish regions with different compositions; it is not a photograph of their natural colors. Numbered spots connect this view to the analyses listed in the report.
Laboratory figure caption: Fig. 1: Backscattered electron image (Malagasy sphere)
Elemental spectrum: The peaks record characteristic X-ray signals from elements in the analyzed spot or area. This is an analysis of that location, not automatically of the entire specimen. Any mineral identification or uncertainty named in the laboratory caption is retained below.
Laboratory figure caption: Fig. 2: Energy dispersive spectrum of spot 1 in Fig. 1. (hematite/magnetite).
Elemental spectrum: The peaks record characteristic X-ray signals from elements in the analyzed spot or area. This is an analysis of that location, not automatically of the entire specimen. Any mineral identification or uncertainty named in the laboratory caption is retained below.
Laboratory figure caption: Fig. 3: Energy dispersive spectrum of spot 2 in Fig. 1. (serpentine).
Electron microscope image: This view shows small-scale regions selected for analysis. Its brightness contrast helps distinguish regions with different compositions; it is not a photograph of their natural colors. Numbered spots connect this view to the analyses listed in the report.
Laboratory figure caption: Fig. 4: Backscattered electron image (Malagasy sphere)
Elemental spectrum: The peaks record characteristic X-ray signals from elements in the analyzed spot or area. This is an analysis of that location, not automatically of the entire specimen. Any mineral identification or uncertainty named in the laboratory caption is retained below.
Laboratory figure caption: Fig. 5: Energy dispersive spectrum of spot 2 in Fig. 1. (serpentine).
Read the report as text
                                                 Analytical Result Report

Sample id: 9114 (Plum Blossom Jade sphere)
Submitted by: K.Bitner
Date submitted: June 24, 2020
Date completed: July 6, 2020
Operating conditions: JEOL JSM-6400 operated at 25 kV acceleration potential, 15 mm working distance, 15 degrees
sample tilt, coated with 250 Å carbon. Using the X-ray fluorescence attachment with 35kv potental in conjunction with
the EDS system.


Fig. 1: Backscattered electron image (Malagasy sphere)


Fig. 2: Energy dispersive spectrum of spot 1 in Fig. 1. (hematite/magnetite).
Fig. 3: Energy dispersive spectrum of spot 2 in Fig. 1. (serpentine).


Fig. 4: Backscattered electron image (Malagasy sphere)


Fig. 5: Energy dispersive spectrum of spot 2 in Fig. 1. (serpentine).
Fig. 6: Photograph of the large mass of serpentine in the sphere. Note the lighter-colored rim.


Summary of findings: This is a very interesting sphere! The dark material is composed mainly hematite and magnetite
(noticeably magnetic when tested with a magnet) (Figs 1-3 and 6). The serpentine was originally olivine, a high forsterite
olivine that under hydrous metamorphism converted to serpentine group species. The rim of the serpentine is
noticeably lighter in color through compositionally it is very similar to the core area (Figs. 4 and 5). The color contrast
between rim and core is likely a grain size effect. Smaller grain size is lighter. Trace and minor elements show 1.12 wt.
% calcium, 810 ppm phosphorus, 746 ppm manganese, 289 ppm tungsten and 1500 ppm copper.


Date: July 6 ,2020                       Signature
Was this black tower actually tourmaline?
Test result: No. This submitted specimen was identified as obsidian, not tourmaline.
This black tower was supplied as a Brazilian material and sold to us under the name “black tourmaline.” The laboratory identified the submitted specimen as obsidian with a very homogeneous composition. The report lists trace concentrations of zirconium, strontium, iron, titanium, and calcium.
Why this matters: In our sourcing, Brazilian black towers have repeatedly been presented to us as black tourmaline. We had this one analyzed rather than accepting the label, and the result was unequivocal: obsidian, not tourmaline. This finding directly challenges the identification used for the submitted tower and is a reason to question similar untested offerings. The report does not independently verify its Brazilian origin or analyze every item in that market.
Use this guide alongside the written findings and the original report transcript. It explains the purpose of each analytical figure and preserves the laboratory’s own figure labels. The interpretations apply to the tested specimen; signals alone do not establish the identity of every similar-looking stone.
Electron microscope image: This view shows small-scale regions selected for analysis. Its brightness contrast helps distinguish regions with different compositions; it is not a photograph of their natural colors. Numbered spots connect this view to the analyses listed in the report.
Laboratory figure caption: Fig. 1: Backscattered electron image (black tower)
Elemental spectrum: The peaks record characteristic X-ray signals from elements in the analyzed spot or area. This is an analysis of that location, not automatically of the entire specimen. Any mineral identification or uncertainty named in the laboratory caption is retained below.
Laboratory figure caption: Fig. 2: Energy dispersive spectrum of spot 1 in Fig. 1. (obsidian).
Read the report as text
                                                  Analytical Result Report

Sample id: 9102 (black tower)
Submitted by: K.Bitner
Date submitted: June 24, 2020
Date completed: July 6, 2020
Operating conditions: JEOL JSM-6400 operated at 25 kV acceleration potential, 15 mm working distance, 15 degrees
sample tilt, coated with 250 Å carbon. Using the X-ray fluorescence attachment with 35kv potental in conjunction with
the EDS system.


Fig. 1: Backscattered electron image (black tower)


Fig. 2: Energy dispersive spectrum of spot 1 in Fig. 1. (obsidian).
Summary of findings: A pretty obsidian tower with typical composition (Figs. 1 and 2). Trace elements include 125 ppm
zirconium, 333 ppm strontium, 8000 ppm iron, 1430 ppm titanium and 45000 ppm calcium. Very homogenous
composition.


Date: July 6 ,2020                     Signature
A Brazilian-market black tower identified as obsidian.
Test result: Obsidian, with a very homogeneous composition in the analyzed sample.
This black tower was supplied as a Brazilian material and sold to us under the name “black tourmaline.” The laboratory identified the submitted specimen as obsidian with a very homogeneous composition. The report lists trace concentrations of zirconium, strontium, iron, titanium, and calcium.
Why this matters: In our sourcing, Brazilian black towers have repeatedly been presented to us as black tourmaline. We had this one analyzed rather than accepting the label, and the result was unequivocal: obsidian, not tourmaline. This finding directly challenges the identification used for the submitted tower and is a reason to question similar untested offerings. The report does not independently verify its Brazilian origin or analyze every item in that market.
Use this guide alongside the written findings and the original report transcript. It explains the purpose of each analytical figure and preserves the laboratory’s own figure labels. The interpretations apply to the tested specimen; signals alone do not establish the identity of every similar-looking stone.
Electron microscope image: This view shows small-scale regions selected for analysis. Its brightness contrast helps distinguish regions with different compositions; it is not a photograph of their natural colors. Numbered spots connect this view to the analyses listed in the report.
Laboratory figure caption: Fig. 1: Backscattered electron image (black tower)
Elemental spectrum: The peaks record characteristic X-ray signals from elements in the analyzed spot or area. This is an analysis of that location, not automatically of the entire specimen. Any mineral identification or uncertainty named in the laboratory caption is retained below.
Laboratory figure caption: Fig. 2: Energy dispersive spectrum of spot 1 in Fig. 1. (obsidian).
Read the report as text
                                                  Analytical Result Report

Sample id: 9102 (black tower)
Submitted by: K.Bitner
Date submitted: June 24, 2020
Date completed: July 6, 2020
Operating conditions: JEOL JSM-6400 operated at 25 kV acceleration potential, 15 mm working distance, 15 degrees
sample tilt, coated with 250 Å carbon. Using the X-ray fluorescence attachment with 35kv potental in conjunction with
the EDS system.


Fig. 1: Backscattered electron image (black tower)


Fig. 2: Energy dispersive spectrum of spot 1 in Fig. 1. (obsidian).
Summary of findings: A pretty obsidian tower with typical composition (Figs. 1 and 2). Trace elements include 125 ppm
zirconium, 333 ppm strontium, 8000 ppm iron, 1430 ppm titanium and 45000 ppm calcium. Very homogenous
composition.


Date: July 6 ,2020                     Signature
A dark blue palm stone reported from India, with a mineral identification supported by several lines of testing.
What the report found: The specimen is mainly kyanite. Its chemistry, optical properties, cleavage and parting, and measured density of 3.60 g/cm³ support that identification.
The laboratory did not find evidence of alteration to potassium-bearing mica in the analyzed specimen. It suggests the dark color may be caused by oxide inclusions containing iron, chromium, and titanium; that color explanation is a proposal rather than a separately confirmed identification of each inclusion. The source in India was supplied with the sample, while the report establishes the tested mineral composition.
View the original report
Select a page to enlarge it. A text transcript appears below.
                                                  Analytical Result Report

Sample id: 9254 (dark blue palm kyanite)
Submitted by: K. Bitner
Date submitted: Jan. 15, 2021.
Date completed: Jan. 29, 2021.
Operating conditions: JEOL JSM-6400 operated at 25 kV acceleration potential, 15 mm working distance, 15 degrees
sample tilt, coated with 250 Å carbon. Using the X-ray fluorescence attachment with 35kv potental in conjunction with
the EDS system.


Fig. 1: Photograph of the specimen, approximately 60x43x23 mm.


Fig. 2: Petrographic images of a grain of the specimen in 1.700 refractive index oil. Left: plane polarzied light, right:
crossed Nichols. 750 microns field of view.
Table 1: Compositions of the specimen (In weight percent)

 element
 Silicon dioxide           35.35
 Aluminum oxide            60.88
 Calcium oxide             0.06
 Magnesium oxide           1.18
 Iron oxide                0.32
 Titanium oxide            0.72
 Chromium oxide            0.25


Summary of findings: The specimen (Fig. 1), is mainly composed of an aluminum silicate (Table 1). No evidence of
alteration to mica species was noted (Table 1), as no potassium was detected. The refractive indices are all above 1.7
and the cleavage angles and the parting support the presence of kyanite. The density, 3.60 g/cm 3, also supports kyanite
and not the other polymorphs, sillimanite or andalusite both of which have a density around 3.2—3.3 g/cm 3. The origin
of his specimen is in high pressure metapelitic rocks (which stem from clay-rich sediments, shales…). The dark color is
likely caused by inclusions of dark oxides, iron, chromium, and titanium oxides, possible incorporating magnesium with
is present in the specimen.


Date: January 29, 2021                       Signature
Citrine Star SS Pendants · Soul Body Gems, September 2024.
A natural citrine sphere with a remarkable twelve-rayed asterism.
What the report found: Quartz with microscopic rutile needles; the observed star has twelve rays.
The approximately 23.8 mm sphere was sourced as a Madagascar specimen. The laboratory identified quartz and microscopic rutile needles; the specimen shows a striking 12-rayed star. The report says the star is probably related to twinning of the quartz, and the rutile needles appear aligned perpendicular to the crystal's c-axis. The report describes it as a natural specimen.
The star is best seen when looking down the c-axis. Its full twelve rays are difficult to capture in the report photograph. The locality was supplied with the stone rather than established by the chemical analysis.
Use this guide alongside the written findings and the original report transcript. It explains the purpose of each analytical figure and preserves the laboratory’s own figure labels. The interpretations apply to the tested specimen; signals alone do not establish the identity of every similar-looking stone.
Elemental spectrum: The peaks record characteristic X-ray signals from elements in the analyzed spot or area. This is an analysis of that location, not automatically of the entire specimen. Any mineral identification or uncertainty named in the laboratory caption is retained below.
Laboratory figure caption: Fig. 2: Energy dispersive spectrum of spot 1 in Fig. 2. (rutile)
Elemental spectrum: The peaks record characteristic X-ray signals from elements in the analyzed spot or area. This is an analysis of that location, not automatically of the entire specimen. Any mineral identification or uncertainty named in the laboratory caption is retained below.
Laboratory figure caption: Fig. 3: Energy dispersive spectrum of spot 2 in Fig. 2. (quartz)
Read the report as text
                                                   Analytical Result Report

Sample id: 9189 (small citrine sphere)
Submitted by: K.Bitner
Date submitted: Sept. 9, 2020
Date completed: Sept. 15, 2020
Operating conditions: JEOL JSM-6400 operated at 25 kV acceleration potential, 15 mm working distance, 15 degrees
sample tilt, coated with 250 Å carbon. Using the X-ray fluorescence attachment with 35kv potental in conjunction with
the EDS system.


Fig. 1: Photograph of the sphere showing a beautiful 12-rayed asterism. Diameter of the sphere is 23.8 mm.


                                       2
                                      ×

                                               1
                                             ×

Fig. 3: close-up showing two thin rutile inclusions. Field of view is 600 microns.
Fig. 2: Energy dispersive spectrum of spot 1 in Fig. 2. (rutile)


Fig. 3: Energy dispersive spectrum of spot 2 in Fig. 2. (quartz)


Table 1: Trace element content of the sphere.

 element                                                           concentration
 Titanium                                                          155 ppm
 Aluminum                                                          120 ppm
 Iron                                                              88 ppm


Summary of findings: This is an incredible specimen! The asterism shows a 12-rayed star (not easy to show all rays in
the photograph) which is probably related to twinning of the quartz crystal. The star is best viewed down the c-axis of
the crystal, the microscopic rutile inclusions appear to be aligned in a plane perpendicular to the c-axis. T was tricky to
find a rutile needle penetrating through the surface to get the chemistry determined. Only titanium, iron and aluminum
were detected in quantifiable amounts in the specimen. This is a natural specimen.
Date: September 15 ,2020   Signature
Citrine Star SS Pendants · Soul Body Gems, September 2024.
A star-bearing citrine sphere sourced from Madagascar.
What the report found: Natural quartz, rutile needles, and a twelve-rayed optical star.
The approximately 23.8 mm sphere was sourced as a Madagascar specimen. The laboratory identified quartz and microscopic rutile needles; the specimen shows a striking 12-rayed star. The report says the star is probably related to twinning of the quartz, and the rutile needles appear aligned perpendicular to the crystal's c-axis. The report describes it as a natural specimen.
The star is best seen when looking down the c-axis. Its full twelve rays are difficult to capture in the report photograph. The locality was supplied with the stone rather than established by the chemical analysis.
Use this guide alongside the written findings and the original report transcript. It explains the purpose of each analytical figure and preserves the laboratory’s own figure labels. The interpretations apply to the tested specimen; signals alone do not establish the identity of every similar-looking stone.
Elemental spectrum: The peaks record characteristic X-ray signals from elements in the analyzed spot or area. This is an analysis of that location, not automatically of the entire specimen. Any mineral identification or uncertainty named in the laboratory caption is retained below.
Laboratory figure caption: Fig. 2: Energy dispersive spectrum of spot 1 in Fig. 2. (rutile)
Elemental spectrum: The peaks record characteristic X-ray signals from elements in the analyzed spot or area. This is an analysis of that location, not automatically of the entire specimen. Any mineral identification or uncertainty named in the laboratory caption is retained below.
Laboratory figure caption: Fig. 3: Energy dispersive spectrum of spot 2 in Fig. 2. (quartz)
Read the report as text
                                                   Analytical Result Report

Sample id: 9189 (small citrine sphere)
Submitted by: K.Bitner
Date submitted: Sept. 9, 2020
Date completed: Sept. 15, 2020
Operating conditions: JEOL JSM-6400 operated at 25 kV acceleration potential, 15 mm working distance, 15 degrees
sample tilt, coated with 250 Å carbon. Using the X-ray fluorescence attachment with 35kv potental in conjunction with
the EDS system.


Fig. 1: Photograph of the sphere showing a beautiful 12-rayed asterism. Diameter of the sphere is 23.8 mm.


                                       2
                                      ×

                                               1
                                             ×

Fig. 3: close-up showing two thin rutile inclusions. Field of view is 600 microns.
Fig. 2: Energy dispersive spectrum of spot 1 in Fig. 2. (rutile)


Fig. 3: Energy dispersive spectrum of spot 2 in Fig. 2. (quartz)


Table 1: Trace element content of the sphere.

 element                                                           concentration
 Titanium                                                          155 ppm
 Aluminum                                                          120 ppm
 Iron                                                              88 ppm


Summary of findings: This is an incredible specimen! The asterism shows a 12-rayed star (not easy to show all rays in
the photograph) which is probably related to twinning of the quartz crystal. The star is best viewed down the c-axis of
the crystal, the microscopic rutile inclusions appear to be aligned in a plane perpendicular to the c-axis. T was tricky to
find a rutile needle penetrating through the surface to get the chemistry determined. Only titanium, iron and aluminum
were detected in quantifiable amounts in the specimen. This is a natural specimen.
Date: September 15 ,2020   Signature
What is inside this sugilite piece—and was it assembled?
What the report found: A thin colorful vein appearing to be sugilite within its natural matrix, with a resin or epoxy coating over the block.
The team sawed the approximately 13 × 10 × 5 mm specimen in half to examine its interior. The coating may have been applied for stabilization. The report describes a composite appearance at first, then notes that the main block appears to be the natural matrix of the sugilite veins, including a second thin vein inside. It does not conclude that an unrelated backing rock was glued to a sugilite slice.
Our sourcing information places the raw material in South Africa and its processing in China. The report calls the submitted piece “Sugilite from China,” which can describe that processing route; it does not itself trace the mine of origin.
View the original report
Select a page to enlarge it. A text transcript appears below.
                                                Analytical Result Report

Sample id: 9256 (Sugilite from China)
Submitted by: K. Bitner
Date submitted: Jan. 15, 2021.
Date completed: Jan. 29, 2021.
Operating conditions: An AMRAY 1930 SEM, opeprated at 20 kV acceleration potential, 10 mm working distance, 15
degrees sample tilt, coated with 250 Å carbon. Using the X-ray fluorescence attachment with 35kv potental in
conjunction with the EDS system.


Fig. 1: Photograph of the specimen, approximately 13x10x5 mm diameter.

                                                               resin
                                                               sugilite

                                                               rock matrix

                                                               Resin

                                                              Sugilite vein

                                                              resin

Fig. 2: Photograph of the specimen after sawing it in half to show the interior. 10 mm width of specimen.
Table 1: Compositions of the specimen (In weight percent)

 element                   Colored side             Black side
 Silicon dioxide           7.41                     2.47
 Aluminum oxide            0.51                     0.46
 Calcium oxide             0.40                     0.45
 Iron oxide (Fe2O3)        5.99                     26.75
 Manganese oxide           2.83                     1.15
 (MnO)
 Chlorine                  0.91                     0.86
 Potassium oxide           0.67                     0.07
 Magnesium oxide                                    1.05
 Titanium oxide                                     0.04


Summary of findings: This is a very strange specimen (Fig.1). The analytical data (Table 1) have low totals and front and
back of the specimen differ greatly, especially in the iron oxide content. It appears that this is a composite specimen
with a slice of what appears to be sugilite. Attached to a backing and covered with some resin of epoxy. That explains
the low totals. The X-ray beam could penetrate to some extent and the characteristic X-rays, especially the more
energetic ones from the heavier elements such as iron, could make it through the coating material.

A view of the interior after sawing the specimen in half shows more detail what is going on. It appears that the colorful
top surface is a thin vein of sugilite, coated with a textured resin or epoxy layer. The main pat of the block appears to eb
thee natural matrix of the sugilite veins, there is even s thin second vein present in the middle. The entire block is
coated with a thin layer of resin or epoxy, possibly to stabilize the specimen.


Date: January 30, 2021                         Signature
Sugilite Sterling Silver Pendants · Soul Body Gems, December 2023.
A Brazilian stone whose pattern records several stages of mineral growth.
What the report found: Hydrothermal quartz, local hematite inclusions, dark chalcedony, later fine quartz and chalcedony infill, and an area interpreted as former opal now converted to chalcedony.
The specimen measures approximately 12.5 cm high. The report interprets possible fracturing between stages and suggests the later fractures may relate to dehydration of the former opal. The different colors and patches are a record of changing fluids and growth conditions, rather than one uniform quartz mass.
Our Brazilian sourcing has found very little of this material available in recent years. We have not confirmed whether its deposit is exhausted.
View the original report
Select a page to enlarge it. A text transcript appears below.
                                               Analytical Result Report

Sample id: 9215 (Mosaic quartz from Brazil)
Submitted by: K. Bitner
Date submitted: Oct. 16, 2020
Date completed: Nov. 6, 2020
Operating conditions: JEOL JSM-6400 operated at 25 kV acceleration potential, 15 mm working distance, 15 degrees
sample tilt, coated with 250 Å carbon. Using the X-ray fluorescence attachment with 35kv potental in conjunction with
the EDS system.


Fig. 1: Photograph of the six areas of thespecimen. Hegighht of the speciemn is about 12.5 cm.
Table 1: Compositions of the different areas in the shiva (remainder is silicon)

 element              Area 1          Area 2        Area 3         Area 4          Area 5          Area 6
 Iron                 6140 ppm        5150 ppm      400 ppm        650 ppm         380 ppm         370 ppm
 Manganese                            360 ppm       390 ppm                                        220 ppm
 Titanium             420 ppm         360 ppm       250 ppm        2650 ppm                        360 ppm
 Calcium                              420 ppm       300 ppm        1.35 wt. %                      280 ppm
 Potassium                            1.36 wt. %                                                   7200 ppm
 Aluminum             7400 ppm        2.16 wt. %                                                   1.7 wt. %


Summary of findings: This specimen recorded a lot of its history! It started out as a vein of hydrothermal quartz.
Intergrown, in part euhedral crystals (the round tag with #3 sits right on top of a cross section of a quartz crystal! In
some of the quartz crystals, fine-grained red hematite was included during crystal growth (area 5 in Fig. 1). Next was an
infilling of dark, faintly banded chalcedony on the quartz crystals (area 3 in Fig. 1). This initial infilling was only a thin
layer, but it was followed by finer-grained quartz with higher manganese and calcium content (areas 2 and 6 in Fig. 1).
Note that in both areas potassium and aluminum are elevated, this is likely due to some clays such as illite or fine-
grained sericite. It is possible that there was some fracturing of the vein contents before this infilling. This fracturing
could have opened a pathway to those fluids. Infilling of the area 4 (Fig. 1) was likely next, this fluid brought much more
calcium into the vein. The infilling is fine-grained, essentially chalcedony. The last steep was originally an opal infilling in
area 1 which now has converted to chalcedony. The fracturing evident likely is a result of the opal dehydration.


Date: November 6, 2020                             Signature
A lavender and white fluorite from a mine near the Brazil–Argentina border.
What the report found: Fluorite with approximately 120 ppm yttrium in the purple zone and 300 ppm in the white/colorless zone.
The boundary between purple and white is rich in fluid and solid inclusions, with calcite apparently dominant. A sharper boundary within the purple zone has a thin quartz coating. The white area formed later and appears to have grown rapidly, leaving elongate crystals and abundant inclusions.
The mine locality is supplied from our sourcing records; the report analyzes the submitted fluorite rather than verifying its geographic origin. It is fluorite with trace yttrium, not a separate mineral species named “yttrium fluorite.” The green specimen is separately tested and has a higher yttrium concentration.
View the original report
Select a page to enlarge it. A text transcript appears below.
Use this guide alongside the written findings and the original report transcript. It explains the purpose of each analytical figure and preserves the laboratory’s own figure labels. The interpretations apply to the tested specimen; signals alone do not establish the identity of every similar-looking stone.
Electron microscope image: This view shows small-scale regions selected for analysis. Its brightness contrast helps distinguish regions with different compositions; it is not a photograph of their natural colors. Numbered spots connect this view to the analyses listed in the report.
Laboratory figure caption: Fig. 2: Backscattered electron image of the white to colorless portion of the fluorite
Elemental spectrum: The peaks record characteristic X-ray signals from elements in the analyzed spot or area. This is an analysis of that location, not automatically of the entire specimen. Any mineral identification or uncertainty named in the laboratory caption is retained below.
Laboratory figure caption: Fig. 3: Energy dispersive spectrum of area 1 in Fig. 2
Electron microscope image: This view shows small-scale regions selected for analysis. Its brightness contrast helps distinguish regions with different compositions; it is not a photograph of their natural colors. Numbered spots connect this view to the analyses listed in the report.
Laboratory figure caption: Fig. 4: Backscattered electron image of the purple portion of the fluorite
Elemental spectrum: The peaks record characteristic X-ray signals from elements in the analyzed spot or area. This is an analysis of that location, not automatically of the entire specimen. Any mineral identification or uncertainty named in the laboratory caption is retained below.
Laboratory figure caption: Fig. 5: Energy dispersive spectrum of area 1 in Fig. 4
Electron microscope image: This view shows small-scale regions selected for analysis. Its brightness contrast helps distinguish regions with different compositions; it is not a photograph of their natural colors. Numbered spots connect this view to the analyses listed in the report.
Laboratory figure caption: Fig. 6: Backscattered electron image of the cloudy portion of the fluorite.
Elemental spectrum: The peaks record characteristic X-ray signals from elements in the analyzed spot or area. This is an analysis of that location, not automatically of the entire specimen. Any mineral identification or uncertainty named in the laboratory caption is retained below.
Laboratory figure caption: Fig. 7: Energy dispersive spectrum of area 1 in Fig. 6. Scaled to show the trace eleemnts Y and Yb’s presence.
Read the report as text
                                                 Analytical Result Report

Sample id: 9023 Fluorite
Submitted by: Kathreen Bitner
Date submitted: May 19, 2020
Date completed: May 21, 2020
Operating conditions: JEOL JSM-6400 operated at 25 kV acceleration potential, 15 mm working distance, 15 degrees
sample tilt, coated with 250 Å carbon. Using the X-ray fluorescence attacement with 35kv potental in conjunction with
the EDS system


Fig 1: Photomicrographs showing boundary from purple to white (left: 2.5 mm across, middle: 0.7 mm across, right: 0.7
mm across. The right image is a thinner boundary within the purple fluorite and the boundary is coated by thing quartz
particles wheres the diffuse boundary of the purple to white is rich in fluid and solid inclusions (calcite).


Fig. 2: Backscattered electron image of the white to colorless portion of the fluorite
Fig. 3: Energy dispersive spectrum of area 1 in Fig. 2


Fig. 4: Backscattered electron image of the purple portion of the fluorite


Fig. 5: Energy dispersive spectrum of area 1 in Fig. 4
Fig. 6: Backscattered electron image of the cloudy portion of the fluorite.


Fig. 7: Energy dispersive spectrum of area 1 in Fig. 6. Scaled to show the trace eleemnts Y and Yb’s presence.
Fig. 8: Photograph of the white to colorlesss portion, arrows indicate radiating elongate fluorite grains growth direction.


Summary of findings:

A very interesting specimen! There are two types of distinct boundaries: a diffuse one between the purple and
white/colorless parts and a thinner, sharp one within the purple fluorite (Fig. 1). The diffuse boundary is rich in fluid
inclusions and some solid inclusions, seemingly calcite is dominant (Fig. 1). The sharp boundary within the purple
fluorite (Fig. 1) is coated along the boundary with a thin layer of quartz. The cloudy patches are areas rich in fluid and
solid inclusions. Chemically, the fluorite is clean (Figs. 3, 5, 7), trace elements are more abundant in the white/colorless
portion than in the purple part (300 ppm versus 120 ppm yttrium). No evidence of pronounced chemical zoning within
each color is lacking (Figs. 2,4,6). A scaled spectrum is shown in Fig. 7. There is also a slightly higher titanium content in
the white and cloudy portions (up to 1500 ppm versus 300-500 ppm in the purple and colorless portions.

The white to colorless portion is evidently later in growth than the purple part and it appears to have grown rapidly.
Evidence of elongated crystals emanating in comb texture from the purple portion indicate rapid growth. Boundaries
between the crystal grains are often outlined by inclusions and microfractures. The observed heterogeneities attest to
rapid growth and competition between crystals during formation, resulting in many inclusions and growth interferences.


Date: May 21.2020                          Signature
A pale green fluorite from the Brazil–Argentina border mine.
What the report found: Fluorite with about 1,100 ppm yttrium, the most abundant measured trace element in this specimen.
The laboratory described this specimen as clean and relatively homogeneous in trace-element composition. It noted a narrow band with more fluid inclusions, possibly reflecting changing growth conditions. Ytterbium was detected near the quantification limit; iron and manganese were below detection.
“Yttrium-bearing” describes a measured trace element within fluorite. It does not make this a separate species called “yttrium fluorite.” The mine location comes from our sourcing information, not the chemistry. The lavender and white sample is a different tested specimen with lower measured yttrium.
View the original report
Select a page to enlarge it. A text transcript appears below.
Use this guide alongside the written findings and the original report transcript. It explains the purpose of each analytical figure and preserves the laboratory’s own figure labels. The interpretations apply to the tested specimen; signals alone do not establish the identity of every similar-looking stone.
Electron microscope image: This view shows small-scale regions selected for analysis. Its brightness contrast helps distinguish regions with different compositions; it is not a photograph of their natural colors. Numbered spots connect this view to the analyses listed in the report.
Laboratory figure caption: Fig. 1: Backscattered electron image (pale green fluorite)
Elemental spectrum: The peaks record characteristic X-ray signals from elements in the analyzed spot or area. This is an analysis of that location, not automatically of the entire specimen. Any mineral identification or uncertainty named in the laboratory caption is retained below.
Laboratory figure caption: Fig. 2: Energy dispersive spectrum of spot 1 in Fig. 1. (fluorite).
Electron microscope image: This view shows small-scale regions selected for analysis. Its brightness contrast helps distinguish regions with different compositions; it is not a photograph of their natural colors. Numbered spots connect this view to the analyses listed in the report.
Laboratory figure caption: Fig. 2: Backscattered electron image of the white to colorless portion of the fluorite
Elemental spectrum: The peaks record characteristic X-ray signals from elements in the analyzed spot or area. This is an analysis of that location, not automatically of the entire specimen. Any mineral identification or uncertainty named in the laboratory caption is retained below.
Laboratory figure caption: Fig. 3: Energy dispersive spectrum of area 1 in Fig. 2
Electron microscope image: This view shows small-scale regions selected for analysis. Its brightness contrast helps distinguish regions with different compositions; it is not a photograph of their natural colors. Numbered spots connect this view to the analyses listed in the report.
Laboratory figure caption: Fig. 4: Backscattered electron image of the purple portion of the fluorite
Elemental spectrum: The peaks record characteristic X-ray signals from elements in the analyzed spot or area. This is an analysis of that location, not automatically of the entire specimen. Any mineral identification or uncertainty named in the laboratory caption is retained below.
Laboratory figure caption: Fig. 5: Energy dispersive spectrum of area 1 in Fig. 4
Electron microscope image: This view shows small-scale regions selected for analysis. Its brightness contrast helps distinguish regions with different compositions; it is not a photograph of their natural colors. Numbered spots connect this view to the analyses listed in the report.
Laboratory figure caption: Fig. 6: Backscattered electron image of the cloudy portion of the fluorite.
Elemental spectrum: The peaks record characteristic X-ray signals from elements in the analyzed spot or area. This is an analysis of that location, not automatically of the entire specimen. Any mineral identification or uncertainty named in the laboratory caption is retained below.
Laboratory figure caption: Fig. 7: Energy dispersive spectrum of area 1 in Fig. 6. Scaled to show the trace eleemnts Y and Yb’s presence.
Read the report as text
                                                   Analytical Result Report

Sample id: 9057 (green fluorite)
Submitted by: K.Bitner
Date submitted: June 22, 2020
Date completed: June 27, 2020
Operating conditions: JEOL JSM-6400 operated at 25 kV acceleration potential, 15 mm working distance, 15 degrees
sample tilt, coated with 250 Å carbon. Using the X-ray fluorescence attachment with 35kv potental in conjunction with
the EDS system.


Fig. 1: Backscattered electron image (pale green fluorite)


                                                                               )

Fig. 2: Energy dispersive spectrum of spot 1 in Fig. 1. (fluorite).
Fig. 3: Zoomed-in view of Fig. 2 showing yttrium peaks


Summary of findings: This is a nice clean fluorite specimen. It appears to be very homogenous with respect to trace
elements. The most abundant one is yttrium (1100 ppm) (Figs 1 and 2), minor amounts of titanium (300 ppm). There is
a band of slightly higher density of fluid inclusions noticeable which is a few mm thick cutting through the specimen.
This likely a growth phenomenon possible related to changes in conditions of formation such as a slight drop in pressure.
Ytterbium was detectable but ranged close to the limit of quantification. Iron and manganese were below detection
limit.


Date: June 27 ,2020                       Signature
Lavender fluorite comparison
Sample 9023, completed May 21, 2020, is the lavender specimen documented on our Lavender Fluorite page. It contains trace yttrium: approximately 300 ppm in the white/colorless portion and 120 ppm in the purple portion. The report describes fluid and solid inclusions, quartz along a sharp boundary, and evidence of rapid growth. This is a separate specimen from the green fluorite report above.
Additional lavender specimen report — sample 9023
Select a page to enlarge it. A text transcript appears below.
                                                 Analytical Result Report

Sample id: 9023 Fluorite
Submitted by: Kathreen Bitner
Date submitted: May 19, 2020
Date completed: May 21, 2020
Operating conditions: JEOL JSM-6400 operated at 25 kV acceleration potential, 15 mm working distance, 15 degrees
sample tilt, coated with 250 Å carbon. Using the X-ray fluorescence attacement with 35kv potental in conjunction with
the EDS system


Fig 1: Photomicrographs showing boundary from purple to white (left: 2.5 mm across, middle: 0.7 mm across, right: 0.7
mm across. The right image is a thinner boundary within the purple fluorite and the boundary is coated by thing quartz
particles wheres the diffuse boundary of the purple to white is rich in fluid and solid inclusions (calcite).


Fig. 2: Backscattered electron image of the white to colorless portion of the fluorite
Fig. 3: Energy dispersive spectrum of area 1 in Fig. 2


Fig. 4: Backscattered electron image of the purple portion of the fluorite


Fig. 5: Energy dispersive spectrum of area 1 in Fig. 4
Fig. 6: Backscattered electron image of the cloudy portion of the fluorite.


Fig. 7: Energy dispersive spectrum of area 1 in Fig. 6. Scaled to show the trace eleemnts Y and Yb’s presence.
Fig. 8: Photograph of the white to colorlesss portion, arrows indicate radiating elongate fluorite grains growth direction.


Summary of findings:

A very interesting specimen! There are two types of distinct boundaries: a diffuse one between the purple and
white/colorless parts and a thinner, sharp one within the purple fluorite (Fig. 1). The diffuse boundary is rich in fluid
inclusions and some solid inclusions, seemingly calcite is dominant (Fig. 1). The sharp boundary within the purple
fluorite (Fig. 1) is coated along the boundary with a thin layer of quartz. The cloudy patches are areas rich in fluid and
solid inclusions. Chemically, the fluorite is clean (Figs. 3, 5, 7), trace elements are more abundant in the white/colorless
portion than in the purple part (300 ppm versus 120 ppm yttrium). No evidence of pronounced chemical zoning within
each color is lacking (Figs. 2,4,6). A scaled spectrum is shown in Fig. 7. There is also a slightly higher titanium content in
the white and cloudy portions (up to 1500 ppm versus 300-500 ppm in the purple and colorless portions.

The white to colorless portion is evidently later in growth than the purple part and it appears to have grown rapidly.
Evidence of elongated crystals emanating in comb texture from the purple portion indicate rapid growth. Boundaries
between the crystal grains are often outlined by inclusions and microfractures. The observed heterogeneities attest to
rapid growth and competition between crystals during formation, resulting in many inclusions and growth interferences.


Date: May 21.2020                          Signature
A sphere where vivid blue apatite meets green and light brown chert.
What the report found: The blue portion is apatite; the green to light brown matrix is chert.
The sphere measures about 66 mm. The laboratory measured relatively modest iron and manganese in the blue area despite its saturated color and suggested that structural defects may enhance that blue. It associated the chert's green-to-brown color variation with different oxidation states of iron. The color mechanism in the apatite is presented as a likely explanation, not as a separately established cause for every blue apatite.
View the original report
Select a page to enlarge it. A text transcript appears below.
Use this guide alongside the written findings and the original report transcript. It explains the purpose of each analytical figure and preserves the laboratory’s own figure labels. The interpretations apply to the tested specimen; signals alone do not establish the identity of every similar-looking stone.
Elemental spectrum: The peaks record characteristic X-ray signals from elements in the analyzed spot or area. This is an analysis of that location, not automatically of the entire specimen. Any mineral identification or uncertainty named in the laboratory caption is retained below.
Laboratory figure caption: Fig. 2: Energy dispersive spectral analysis of the blue area in Fig. 1.
Read the report as text
                                                   Analytical Result Report

Sample id: 9194 (Blue Apatite)
Submitted by: K.Bitner
Date submitted: Sept. 9, 2020
Date completed: Sept. 16, 2020
Operating conditions: JEOL JSM-6400 operated at 25 kV acceleration potential, 15 mm working distance, 15 degrees
sample tilt, coated with 250 Å carbon. Using the X-ray fluorescence attachment with 35kv potental in conjunction with
the EDS system.


Fig. 1: Photograph of the Apatite sphere. Maximum dimension is 66 mm.


Fig. 2: Energy dispersive spectral analysis of the blue area in Fig. 1.
Table 1: compositional results for the blue and green areas

 element                                  Blue area                                 Green area
 Iron                                     410 ppm                                   7.1 wt. %
 Sulfur                                   100 ppm                                   400 ppm
 Manganese                                140 ppm                                   120 ppm
 Phosphorus                               17.3 wt. %                                Not detected
 Silicon                                  1.22 wt. %                                38.55 wt. %
 Calcium                                  39.2 wt. %                                400 ppm


Summary of findings: A very interesting specimen! Deep blue apatite (Figs 1-2 and Table 1) with greenish to light
brown chert Fig. 1 and table 1). Despite the deep blue color, chromophoric trace elements such as iron and manganese
are not very high. This something we have found in our work on apatite group species, the color intensity does not
correlate well with chromophore concentrations. Thus, some defect in the structure likely enhances the color intensity.
The cherty material and its color range from green to light brown is a result of the oxidation state of iron, divalent iron
makes it green, trivalent makes it brown.


Date: September 16 ,2020                          Signature
Snowflake Fluorite Stretch Bracelets · Soul Body Gems, September 2024.
Are the white “snowflakes” in this blue fluorite scolecite?
Test result: The elongated white crystals examined in this tower are quartz, not identified as scolecite. A carbonate mineral occurs on some terminations, likely calcite, though the exact carbonate was not established.
The approximately 65 mm fluorite tower has relatively few measured trace elements. The lab notes that the quartz may have replaced an earlier mineral, but it did not identify such a precursor. The visible white pattern alone cannot confirm scolecite, and this report supports quartz for the analyzed inclusions in this specimen.
That distinction matters because “Snowflake Fluorite” is a visual market name, not proof of a particular white inclusion. This result applies to the tested tower; another specimen would need its own examination.
View the original report
Select a page to enlarge it. A text transcript appears below.
Use this guide alongside the written findings and the original report transcript. It explains the purpose of each analytical figure and preserves the laboratory’s own figure labels. The interpretations apply to the tested specimen; signals alone do not establish the identity of every similar-looking stone.
Elemental spectrum: The peaks record characteristic X-ray signals from elements in the analyzed spot or area. This is an analysis of that location, not automatically of the entire specimen. Any mineral identification or uncertainty named in the laboratory caption is retained below.
Laboratory figure caption: Fig. 2: Energy dispersive spectral analysis of the fluorite in Fig. 1.
Elemental spectrum: The peaks record characteristic X-ray signals from elements in the analyzed spot or area. This is an analysis of that location, not automatically of the entire specimen. Any mineral identification or uncertainty named in the laboratory caption is retained below.
Laboratory figure caption: Fig. 3: Energy dispersive spectral analysis white inclusions in Fig. 1.
Read the report as text
                                               Analytical Result Report

Sample id: 9197 (fluorite tower)
Submitted by: K.Bitner
Date submitted: Sept. 9, 2020
Date completed: Sept. 17, 2020
Operating conditions: JEOL JSM-6400 operated at 25 kV acceleration potential, 15 mm working distance, 15 degrees
sample tilt, coated with 250 Å carbon. Using the X-ray fluorescence attachment with 35kv potental in conjunction with
the EDS system.


Fig. 1: Photograph of the fluorite tower. Maximum dimension is 65 mm. Close-up of the white material at the base is on
the right.


Fig. 2: Photomicrograph of the inclusions, a rhombohedral carbonate mineral on quartz. 1mm field of view.
Fig. 2: Energy dispersive spectral analysis of the fluorite in Fig. 1.


Fig. 3: Energy dispersive spectral analysis white inclusions in Fig. 1.


Table 1: compositional results for trace elements in the fluorite

 element                                     Blue area
 Iron                                        342 ppm
 Manganese                                   78 ppm
 Yttrium                                     88 ppm


Summary of findings: A very interesting piece! (Fig. 1). The fluorite is relatively clean, only minor trace elements are
present (Fig. 2, Table 1). Rare earth elements are present at close to the detection limit but cannot be accurately
quantified. Cerium is most noticeable. Yttrium is the most abundant element of the rare earth group affiliates. The
white inclusions are interesting, the elongated crystals are quartz, but they may have replaced an earlier mineral. In
some cases, carbonate crystals are perched on the terminations (Fig. 2). It is likely calcite but could be another
carbonate. None of them were exposed at the surface.
Date: September 17 ,2020   Signature
What the report found: Quartz with chromium-bearing muscovite (fuchsite) inclusions, plus minor other grains.
These green tumbled stones were sourced from the Tanzanian mine that also supplied the red Tanzberry material. The laboratory identified quartz with inclusions of chromium-bearing muscovite (fuchsite). It also observed some plagioclase and a few black spinel-group grains, probably chromite. The report measured 1,440 ppm chromium, 575 ppm iron, and 420 ppm titanium in the teal material.
The green and red Tanzberry (Red) are different tested assemblages: the red material contains red muscovite and magnetite in quartz. “Green Strawberry Quartz” is a market name sometimes used for the green material, but it obscures the actual fuchsite-bearing composition and should not be confused with the red strawberry quartz material.
Use this guide alongside the written findings and the original report transcript. It explains the purpose of each analytical figure and preserves the laboratory’s own figure labels. The interpretations apply to the tested specimen; signals alone do not establish the identity of every similar-looking stone.
Electron microscope image: This view shows small-scale regions selected for analysis. Its brightness contrast helps distinguish regions with different compositions; it is not a photograph of their natural colors. Numbered spots connect this view to the analyses listed in the report.
Laboratory figure caption: Fig. 1: Backscattered electron image (green stone)
Elemental spectrum: The peaks record characteristic X-ray signals from elements in the analyzed spot or area. This is an analysis of that location, not automatically of the entire specimen. Any mineral identification or uncertainty named in the laboratory caption is retained below.
Laboratory figure caption: Fig. 2: Energy dispersive spectrum of spot 1 in Fig. 1. Quartz.
Elemental spectrum: The peaks record characteristic X-ray signals from elements in the analyzed spot or area. This is an analysis of that location, not automatically of the entire specimen. Any mineral identification or uncertainty named in the laboratory caption is retained below.
Laboratory figure caption: Fig. 3: Energy dispersive spectrum of spot 2 in Fig. 1. Chromian muscovite (fuchsite)
Read the report as text
                                                  Analytical Result Report

Sample id: 9034 (green tumbled stones)
Submitted by: K.Bitner
Date submitted: May 29, 2020
Date completed: June 1, 2020
Operating conditions: JEOL JSM-6400 operated at 25 kV acceleration potential, 15 mm working distance, 15 degrees
sample tilt, coated with 250 Å carbon. Using the X-ray fluorescence attachment with 35kv potental in conjunction with
the EDS system.


Fig. 1: Backscattered electron image (green stone)


Fig. 2: Energy dispersive spectrum of spot 1 in Fig. 1. Quartz.
Fig. 3: Energy dispersive spectrum of spot 2 in Fig. 1. Chromian muscovite (fuchsite)


Fig. 4: Photomicrograph of inclusion of chromian muscovite . 3 mm across the field of view.


Summary of findings:

Those are very pretty tumbled stones! Quartz with inclusions of chromian muscovite (‘fuchsite’). The chromophoric
elements of teal material shows 1440 ppm chromium, 575 ppm iron and 420 ppm titanium. These are the
chromophoric elements. I have also seen some plagioclase inclusions and a few black grains of a spinel group mineral,
likely chromite.


Date: June 1 ,2020                        Signature
The tested mineral assemblage behind a green Tanzberry trade name.
What the report found: Quartz with chromium-bearing muscovite (fuchsite) inclusions, plus minor other grains.
These green tumbled stones were sourced from the Tanzanian mine that also supplied the red Tanzberry material. The laboratory identified quartz with inclusions of chromium-bearing muscovite (fuchsite). It also observed some plagioclase and a few black spinel-group grains, probably chromite. The report measured 1,440 ppm chromium, 575 ppm iron, and 420 ppm titanium in the teal material.
The green and red Tanzberry (Red) are different tested assemblages: the red material contains red muscovite and magnetite in quartz. “Green Strawberry Quartz” is a market name sometimes used for the green material, but it obscures the actual fuchsite-bearing composition and should not be confused with the red strawberry quartz material.
Use this guide alongside the written findings and the original report transcript. It explains the purpose of each analytical figure and preserves the laboratory’s own figure labels. The interpretations apply to the tested specimen; signals alone do not establish the identity of every similar-looking stone.
Electron microscope image: This view shows small-scale regions selected for analysis. Its brightness contrast helps distinguish regions with different compositions; it is not a photograph of their natural colors. Numbered spots connect this view to the analyses listed in the report.
Laboratory figure caption: Fig. 1: Backscattered electron image (green stone)
Elemental spectrum: The peaks record characteristic X-ray signals from elements in the analyzed spot or area. This is an analysis of that location, not automatically of the entire specimen. Any mineral identification or uncertainty named in the laboratory caption is retained below.
Laboratory figure caption: Fig. 2: Energy dispersive spectrum of spot 1 in Fig. 1. Quartz.
Elemental spectrum: The peaks record characteristic X-ray signals from elements in the analyzed spot or area. This is an analysis of that location, not automatically of the entire specimen. Any mineral identification or uncertainty named in the laboratory caption is retained below.
Laboratory figure caption: Fig. 3: Energy dispersive spectrum of spot 2 in Fig. 1. Chromian muscovite (fuchsite)
Read the report as text
                                                  Analytical Result Report

Sample id: 9034 (green tumbled stones)
Submitted by: K.Bitner
Date submitted: May 29, 2020
Date completed: June 1, 2020
Operating conditions: JEOL JSM-6400 operated at 25 kV acceleration potential, 15 mm working distance, 15 degrees
sample tilt, coated with 250 Å carbon. Using the X-ray fluorescence attachment with 35kv potental in conjunction with
the EDS system.


Fig. 1: Backscattered electron image (green stone)


Fig. 2: Energy dispersive spectrum of spot 1 in Fig. 1. Quartz.
Fig. 3: Energy dispersive spectrum of spot 2 in Fig. 1. Chromian muscovite (fuchsite)


Fig. 4: Photomicrograph of inclusion of chromian muscovite . 3 mm across the field of view.


Summary of findings:

Those are very pretty tumbled stones! Quartz with inclusions of chromian muscovite (‘fuchsite’). The chromophoric
elements of teal material shows 1440 ppm chromium, 575 ppm iron and 420 ppm titanium. These are the
chromophoric elements. I have also seen some plagioclase inclusions and a few black grains of a spinel group mineral,
likely chromite.


Date: June 1 ,2020                        Signature
A market-name search: this green material is quartz with fuchsite, not the red strawberry quartz assemblage.
What the report found: Quartz with chromium-bearing muscovite (fuchsite) inclusions, plus minor other grains.
These green tumbled stones were sourced from the Tanzanian mine that also supplied the red Tanzberry material. The laboratory identified quartz with inclusions of chromium-bearing muscovite (fuchsite). It also observed some plagioclase and a few black spinel-group grains, probably chromite. The report measured 1,440 ppm chromium, 575 ppm iron, and 420 ppm titanium in the teal material.
The green and red Tanzberry (Red) are different tested assemblages: the red material contains red muscovite and magnetite in quartz. “Green Strawberry Quartz” is a market name sometimes used for the green material, but it obscures the actual fuchsite-bearing composition and should not be confused with the red strawberry quartz material.
Use this guide alongside the written findings and the original report transcript. It explains the purpose of each analytical figure and preserves the laboratory’s own figure labels. The interpretations apply to the tested specimen; signals alone do not establish the identity of every similar-looking stone.
Electron microscope image: This view shows small-scale regions selected for analysis. Its brightness contrast helps distinguish regions with different compositions; it is not a photograph of their natural colors. Numbered spots connect this view to the analyses listed in the report.
Laboratory figure caption: Fig. 1: Backscattered electron image (green stone)
Elemental spectrum: The peaks record characteristic X-ray signals from elements in the analyzed spot or area. This is an analysis of that location, not automatically of the entire specimen. Any mineral identification or uncertainty named in the laboratory caption is retained below.
Laboratory figure caption: Fig. 2: Energy dispersive spectrum of spot 1 in Fig. 1. Quartz.
Elemental spectrum: The peaks record characteristic X-ray signals from elements in the analyzed spot or area. This is an analysis of that location, not automatically of the entire specimen. Any mineral identification or uncertainty named in the laboratory caption is retained below.
Laboratory figure caption: Fig. 3: Energy dispersive spectrum of spot 2 in Fig. 1. Chromian muscovite (fuchsite)
Read the report as text
                                                  Analytical Result Report

Sample id: 9034 (green tumbled stones)
Submitted by: K.Bitner
Date submitted: May 29, 2020
Date completed: June 1, 2020
Operating conditions: JEOL JSM-6400 operated at 25 kV acceleration potential, 15 mm working distance, 15 degrees
sample tilt, coated with 250 Å carbon. Using the X-ray fluorescence attachment with 35kv potental in conjunction with
the EDS system.


Fig. 1: Backscattered electron image (green stone)


Fig. 2: Energy dispersive spectrum of spot 1 in Fig. 1. Quartz.
Fig. 3: Energy dispersive spectrum of spot 2 in Fig. 1. Chromian muscovite (fuchsite)


Fig. 4: Photomicrograph of inclusion of chromian muscovite . 3 mm across the field of view.


Summary of findings:

Those are very pretty tumbled stones! Quartz with inclusions of chromian muscovite (‘fuchsite’). The chromophoric
elements of teal material shows 1440 ppm chromium, 575 ppm iron and 420 ppm titanium. These are the
chromophoric elements. I have also seen some plagioclase inclusions and a few black grains of a spinel group mineral,
likely chromite.


Date: June 1 ,2020                        Signature
A spotted sphere sourced from China, examined beneath its “Leopard Skin Jasper” trade name.
What the report found: A silica-rich material (83.5 wt.% SiO₂) with notable aluminum and potassium, consistent with a more complex volcanic-derived rock than a uniform silica mass.
The laboratory proposes that the material may have formed from felsic volcanic ash, later solidified through interaction with water and liberated silica. It describes a possible larger clast with feldspar-like crystals and notes rubidium consistent with potassium-rich minerals. These origin details are interpretations, while the reported elemental composition is the direct measurement.
China is the supplied locality for this sphere; the analysis itself does not independently establish geographic source.
View the original report
Select a page to enlarge it. A text transcript appears below.
                                                  Analytical Result Report

Sample id: 9255 (leopard skin jasper sphere)
Submitted by: K. Bitner
Date submitted: Jan. 15, 2021.
Date completed: Jan. 29, 2021.
Operating conditions: JEOL JSM-6400 operated at 25 kV acceleration potential, 15 mm working distance, 15 degrees
sample tilt, coated with 250 Å carbon. Using the X-ray fluorescence attachment with 35kv potental in conjunction with
the EDS system.


Fig. 1: Photograph of the specimen, approximately 62 mm diameter.


Fig. 2: Petrographic images of a grain of the specimen in 1.700 refractive index oil. Left: plane polarzied light, right:
crossed Nichols. 750 microns field of view.
Table 1: Compositions of the specimen (In weight percent)

 element
 Silicon dioxide            83.5
 Aluminum oxide             9.89
 Calcium oxide              0.22
 Potassium oxide            4.11
 Iron oxide                 0.63
 Titanium oxide             0.04
 Manganese oxide            0.04
 Rubidium oxide             0.05
 Zirconium oxide            0.01


Summary of findings: This is an interesting specimen (Fig. 1) which documents its history well. One may think that such
material would essentially be silicon oxide, but it contains a lot of aluminum and potassium oxide. This suggests an
origin from a felsic volcanic eruption, possibly from an ashfall. The right image in Fig. 1 shows near the top a brownish
round mass with white particles in it, this looks like a larger clast with feldspar crystals! After deposition and interaction
with water, silica was liberated which caused it to become solid. Also, interesting to note is the elevated presence of
rubidium which substitutes for potassium in potassium feldspars and micas. This is consistent with an origin from a
felsic melt, rhyolitic or andesitic for example. Th


Date: January 29, 2021                         Signature
Aquaprase is the trade name used for these white, green, blue, and brown specimens examined in October 2025.
Finding: The white and green specimens are essentially quartz/chalcedony. The report detected small amounts of additional minerals and color-related elements in the other areas, rather than one uniform composition across every color.
The green stone contained iron and a small iron-mineral inclusion described as likely magnetite. Some voids showed resin filling. In a blue area, the researcher found some chrysocolla among quartz, with chromium and iron possibly in mica flakes. Brown areas were richer in iron; the green areas showed more chromium and iron than copper.
Tested group: Sample 1530 (#1 white and green stones), report completed October 16, 2025. “Aquaprase” is a market name; the findings apply to the pieces examined here.
View the original report
Select a page to enlarge it. Four pages and a text transcript.
Use this guide alongside the written findings and the original report transcript. It explains the purpose of each analytical figure and preserves the laboratory’s own figure labels. The interpretations apply to the tested specimen; signals alone do not establish the identity of every similar-looking stone.
Electron microscope image: This view shows small-scale regions selected for analysis. Its brightness contrast helps distinguish regions with different compositions; it is not a photograph of their natural colors. Numbered spots connect this view to the analyses listed in the report.
Laboratory figure caption: Fig.2: Backscattered electron image of an area of the white hexagonal specimen in Fig. 1.
Elemental spectrum: The peaks record characteristic X-ray signals from elements in the analyzed spot or area. This is an analysis of that location, not automatically of the entire specimen. Any mineral identification or uncertainty named in the laboratory caption is retained below.
Laboratory figure caption: Fig. 3: Energy dispersive spectrum of spot 1 in Fig. 2. (quartz)
Electron microscope image: This view shows small-scale regions selected for analysis. Its brightness contrast helps distinguish regions with different compositions; it is not a photograph of their natural colors. Numbered spots connect this view to the analyses listed in the report.
Laboratory figure caption: Fig. 4: Backscattered electron image of an area of the green hexagonal specimen in Fig. 1.
Elemental spectrum: The peaks record characteristic X-ray signals from elements in the analyzed spot or area. This is an analysis of that location, not automatically of the entire specimen. Any mineral identification or uncertainty named in the laboratory caption is retained below.
Laboratory figure caption: Fig. 6: Energy dispersive spectrum of spot 1 in Fig. 3. (quartz)
Elemental spectrum: The peaks record characteristic X-ray signals from elements in the analyzed spot or area. This is an analysis of that location, not automatically of the entire specimen. Any mineral identification or uncertainty named in the laboratory caption is retained below.
Laboratory figure caption: Fig. 6: Energy dispersive spectrum of spot 2 in Fig. 3. (some iron oxide)
Elemental spectrum: The peaks record characteristic X-ray signals from elements in the analyzed spot or area. This is an analysis of that location, not automatically of the entire specimen. Any mineral identification or uncertainty named in the laboratory caption is retained below.
Laboratory figure caption: Fig. 7: Energy dispersive spectrum of spot 4 in Fig. 3. (resin)
Electron microscope image: This view shows small-scale regions selected for analysis. Its brightness contrast helps distinguish regions with different compositions; it is not a photograph of their natural colors. Numbered spots connect this view to the analyses listed in the report.
Laboratory figure caption: Fig. 8: Backscattered electron images of areas and fragments with different colors exposed. Left: a blue area in the heart-sghaped piece. Middle: brown area in the broken green and brown hexagon. Right: green area in the green and brown hexagon.
Read the report as text
Analytical Result Report
Sample id: 1530 (#1 white & green stones - Aquaprase)
Submitted by: Soul Body Gems
Date completed: 10-16-2025
Operating conditions: An AMRAY 1830 SEM operated at 25 kV acceleration potential, 24 mm working distance, 0 degrees sample tilt, coated with 250 Å carbon, and also using the attached XRF unit operated at 30 kV.
Fig. 1:  Photograph of the specimen.  3.5 cm maximum dimension.
Fig.2: Backscattered electron image of an area of the white hexagonal specimen in Fig. 1.
Fig. 3: Energy dispersive spectrum of spot 1 in Fig. 2. (quartz)
Fig. 4: Backscattered electron image of an area of the green hexagonal specimen in Fig. 1.
Fig. 6: Energy dispersive spectrum of spot 1 in Fig. 3. (quartz)
Fig. 6: Energy dispersive spectrum of spot 2 in Fig. 3. (some iron oxide)
Fig. 7: Energy dispersive spectrum of spot 4 in Fig. 3. (resin)
Fig. 8: Backscattered electron images of areas and fragments with different colors exposed.  Left: a blue area in the heart-sghaped piece.  Middle:  brown area in the broken green  and brown hexagon.  Right: green area in the green and brown hexagon.
Table 1: Minor and trace elements of chromophoric properties in the specimens shown in Fig. 8 (in wt. %).
Element | Blue area | Brown area | Green area
Chromium | 0.45-0.79 | 0.24-0.35 | 1.12-2.99
Copper | 0.19-0.43 | 1.21-2.03 | 0.04-0.25
Iron | 1.59-2.58 | 6.92-7.97 | 1.05-1.55
Summary of findings:  These are pretty specimens (Fig. 1).  The white one is essentially quartz/chalcedony (Figs. 2 and 3).  The green one is also quartz/chalcedony but contains a little iron which gives it the green color (Figs. 4 and 5).  A small inclusion of an iron mineral was detected (Figs. 4 and 6).  It is likely magnetite.  There is also some resin pilling present in some voids (Figs. 4 and 7).  Selected  colored areas in blue, brown and green were analyzed and the results are shown in Table 1.  These chromophoric elements are only present in the colored parts, in the white or colorless parts they are not detectable.  Thus, in the blue portions, some chrysocolla is present among the quartz and some chromium and iron as well, possibly in mica flakes.  The brown areas are dominated by iron which makes sense but some copper and chromium are also present and in the green areas, chromium and iron are more abundant than copper.
Date:    10-16-2025                      Signature
These results are the property of Soul Body Gems, Alexander Falster, and the Maine Mineral & Gem Museum. Any mention requires full acknowledgment.
Aquaprase SS Pendants · Soul Body Gems, August 2024.
Three pieces supplied as Indian kämmererite were studied separately: a shiva carving, a sphere, and a hexagon.
Across the reports: Purple kämmererite was identified, while the minerals accompanying it differed among the three specimens. The reports analyze the submitted pieces; they do not independently prove a mine locality.
Shiva carving · sample 9215
Completed November 5, 2020. The purple streaks fit kämmererite. White streaks were predominantly diopside; the dark area was a fine-grained intergrowth of chromite-rich spinel and diopside.
Shiva report · two pages. Select either page to enlarge.
Use this guide alongside the written findings and the original report transcript. It explains the purpose of each analytical figure and preserves the laboratory’s own figure labels. The interpretations apply to the tested specimen; signals alone do not establish the identity of every similar-looking stone.
Electron microscope image: This view shows small-scale regions selected for analysis. Its brightness contrast helps distinguish regions with different compositions; it is not a photograph of their natural colors. Numbered spots connect this view to the analyses listed in the report.
Laboratory figure caption: Fig. 3: Backscattered electron image of the green area in Fig. 1, yellow arrow.
Elemental spectrum: The peaks record characteristic X-ray signals from elements in the analyzed spot or area. This is an analysis of that location, not automatically of the entire specimen. Any mineral identification or uncertainty named in the laboratory caption is retained below.
Laboratory figure caption: Fig. 4: Energy dispersive spectrum of spot 1 in Fig. 3. (chlorite group mineral)
Elemental spectrum: The peaks record characteristic X-ray signals from elements in the analyzed spot or area. This is an analysis of that location, not automatically of the entire specimen. Any mineral identification or uncertainty named in the laboratory caption is retained below.
Laboratory figure caption: Fig. 4: Energy dispersive spectrum of spot 3 in Fig. 3. (garnet group, chromian pyrope-grossular)
Read the report as text
Analytical Result Report
Sample id: 9215 (Kämmererite shiva)
Submitted by: K. Bitner
Date submitted: Oct. 16, 2020
Date completed: Nov. 5, 2020
Operating conditions: JEOL JSM-6400 operated at 25 kV acceleration potential, 15 mm working distance, 15 degrees sample tilt, coated with 250 Å carbon. Using the X-ray fluorescence attachment with 35kv potental in conjunction with the EDS system.
Fig. 1: Photograph of the specimen, showing prominent dark mass.   Dimension of the shiva are approximately 32x21 mm.
Fig. 2: Photomicrograph of kämmererite flakes under plane polarized light (left) and crossed Nichols (right), showing low first order gray birefringence.  750 microns field of view.
Table 1: Compositions of the different areas in the shiva (remainder is silicon)
element | Dark area | Purple area | White area
Iron | 3.1 wt. % | 580 ppm | 360 ppm
Manganese | 980 ppm | 87 ppm | 125 ppm
Nickel | 1900 ppm | 160 pm | n.d.
Titanium | 430 ppm | 210 ppm | 75 ppm
Chromium | 6.2 wt. % | 4.35 wt. % | 120 ppm
Calcium | 4500 ppm | 5500 ppm | 23.8 wt. %
Magnesium | 30.4 wt. % | 22.65 wt. % | 17.0 wt. %
Aluminum | 7.65 wt. % | 15.85 wt. % | 7800 ppm
Summary of findings:  A very interesting specimen with lots of interesting areas.  The dark area (Fig. 1, Table 1) is a fine-grained, intimate intergrowth of chromite-rich spinel and diopside.  The spinel is a solid solution between chromite, common spinel and pleonast).  The white streaks in the purple/white material (Fig. 1, Table 1) is dominantly diopside.  The purple streaks (Figs. 1 and 2, table 1) is kämmererite.  The composition as well as the optical and physical behavior (first order gray birefringence, pleochroism, cleavage) are a good fit for kämmererite.
Date:   November 5, 2020                                       Signature
Sphere · sample 9242
Completed January 16, 2021. Small purple patches were kämmererite within a white-to-pale-green matrix dominated by tremolite, with some diopside remnants. Serpentine and brucite were sought but not found in this sphere.
Operating conditions: JEOL JSM-6400 operated at 25 kV acceleration potential, 15 mm working distance, 15 degrees sample tilt, coated with 250 Å carbon. Using the X-ray fluorescence attachment with 35kv potental in conjunction with the EDS system.
Fig. 1: Photograph of the specimen, approximately 4 cm in diameter, showing the different areas..
Fig. 2: Photomicrograph of amphibole flakes under plane polarized light (left) and crossed Nichols (right). 750 microns field of view.
Table 1: Compositions of the different areas in the specimen (in wt. % element).
element
purple area
white area
Pale green area
Silicon
14.7
27.02
27.36
Aluminum
6.76
0.75
1.18
Magnesium
11.18
14.64
14.71
Calcium
0.74
10.02
10.19
Iron
1.16
0.2
0.45
Titanium
0.02
0.04
0.06
Chromium
4.44
0.02
0.11
Manganese
0.05
0.02
0.45
Summary of findings: This is very interesting. Small patches of kämmererite in a white to pale-green matrix (Fig. 1). Small fragments show amphibole cleavage (Fig. 2), though some fragments with pyroxene-like cleavage traces were also seen, though much rarer. Table 1 shows compositional data, and it is evident, that the white and green areas are essentially the same mineral, only minor differences exist, notably in iron content. The white and pale green areas are dominantly tremolite, supported by composition and optical properties. Remnants of diopside are apparently still present. Diopside can undergrade retrograde metamorphism and turn into tremolite. Hydroxyl addition is the main difference. These reactions are slow and may not come to completion, thus, coexisting amphiboles and pyroxenes are not unusual. Serpentine and brucite were searched for in the sphere but were not found.
The source of the material is more calcium-rich than other locations producing kämmererite but host rocks for kämmererite can be calcium and magnesium-rich in some cases.
Date: January 16, 2021 Signature
Hexagon · sample 9260
Completed February 5, 2021. The thick purple portion fits kämmererite, a chromium-bearing clinochlore variety. The green material contains a chlorite-group mineral and chromian pyrope-grossular garnet.
Analytical Result Report
Sample id: 9260 (Kämmererite hexagon)
Submitted by: K. Bitner
Date submitted: Jan. 15, 2021
Date completed: Feb. 5, 2021
Operating conditionsAMRAY 1830 SEM operated at 25 kV acceleration potential, 24 mm working distance, 35 degrees sample tilt, coated with 250 Å carbon. Using the X-ray fluorescence attachment with 35kv potental in conjunction with the EDS system.
Fig. 1: Photograph of the specimen, approximately 5 cm in diameter.
Fig. 2: Petrographic photomocrograph of the green material.  Left: plane polarized light, right: crossed Nichols.  750 microns field of view.
Fig. 3: Backscattered electron image of the green area in Fig. 1, yellow arrow.
Fig. 4: Energy dispersive spectrum of spot 1 in Fig. 3. (chlorite group mineral)
Fig. 4: Energy dispersive spectrum of spot 3 in Fig. 3. (garnet group, chromian pyrope-grossular)
Table 1: Compositions of the different areas in the specimen (in wt. % element).
element | purple area
Silicon | 13.97
Aluminum | 9.15
Magnesium | 15.63
Calcium | 0.65
Iron | 0.72
Titanium | 0.02
Chromium | 3.75
Manganese | 0.02
Nickel | 0.12
Summary of findings:  This is a rich specimen (Fig. 1)!  To see a thick specimen of kämmmererite is not very common.  The composition agrees with a clinochlore variety which is the group kämmmererite belongs to.  The green material is interesting, it appears overall fairly soft, but some granular hard material is present (Fig. 2).  The grains are isotropic which suggests a garnet.  Further study revealed the green material to be a mixture of a chlorite group mineral and a garnet, a chromian pyrope-grossular type (Figs. 3-5).
Date:   February 5, 2021                                       Signature
We distinguish this Indian-supplied group from kämmererite offered from Turkey; a shared mineral name does not make their associated minerals identical.
Oregon Sunstone Gem Facet · Soul Body Gems, August 2024.
Seven specimens labeled Oregon sunstones were analyzed together in a December 13, 2024 report.
Finding: All seven tested as plagioclase feldspar, essentially labradorite. Copper was detectable in each, ranging from 0.007 to 0.019 wt. % in the report’s table.
The researcher described thin copper films along lattice planes that cause color and, in some pieces, a metallic flash. Their similar spectra suggested a common eruptive event. The report documents the composition of the submitted seven stones; the geographic origin stated in the sample label is not independently established by this analysis.
View the original report
Select a page to enlarge it. Three pages and a text transcript.
Use this guide alongside the written findings and the original report transcript. It explains the purpose of each analytical figure and preserves the laboratory’s own figure labels. The interpretations apply to the tested specimen; signals alone do not establish the identity of every similar-looking stone.
Electron microscope image: This view shows small-scale regions selected for analysis. Its brightness contrast helps distinguish regions with different compositions; it is not a photograph of their natural colors. Numbered spots connect this view to the analyses listed in the report.
Laboratory figure caption: Fig.2: Backscattered electron image of an area of one the specimen.
Elemental spectrum: The peaks record characteristic X-ray signals from elements in the analyzed spot or area. This is an analysis of that location, not automatically of the entire specimen. Any mineral identification or uncertainty named in the laboratory caption is retained below.
Laboratory figure caption: Fig. 3: Energy dispersive spectrum of spot 1 in Fig. 2. (plagioclase)
Elemental spectrum: The peaks record characteristic X-ray signals from elements in the analyzed spot or area. This is an analysis of that location, not automatically of the entire specimen. Any mineral identification or uncertainty named in the laboratory caption is retained below.
Laboratory figure caption: Fig. 4: Energy dispersive spectrum overlays of all specimens. Note identical composition (plagioclase).
Read the report as text
Analytical Result Report
Sample id: 1195 (7 Oregon sunstones)
Submitted by: Soul Body Gems
Date completed: 12-13-2024
Operating conditions: An AMRAY 1830 SEM operated at 25 kV acceleration potential, 24 mm working distance, 0 degrees sample tilt, coated with 250 Å carbon, and also using the attached XRF unit operated at 30 kV.
Fig. 1:  Photograph of the specimens.  1.3 cm maximum dimensions
Fig.2: Backscattered electron image of an area of one the specimen.
Fig. 3: Energy dispersive spectrum of spot 1 in Fig. 2. (plagioclase)
Fig. 4: Energy dispersive spectrum overlays of all specimens.  Note identical composition (plagioclase).
Table 1: Trace elements (in wt. %) which have chromophoric properties in the 7 specimens.
Element | 1 | 2 | 3 | 4 | 5 | 6 | 7
Copper | 0.013 | 0.012 | 0.018 | 0.014 | 0.019 | 0.018 | 0.007
Iron | 0.23 | 0.24 | 0.23 | 0.26 | 0.21 | 0.21 | 0.28
Manganese | 0.006 | 0.007 | 0.006 | 0.004 | 0.003 | 0.004 | 0.005
Titanium | 0.02 | 0.02 | 0.020 | 0.01 | 0.01 | 0.03 | 0.02
Summary of findings:  These specimens (Fig. 1) are very pretty.  Chemically, they are all plagioclases, essentially labradorite (Figs.  2-4). Note the very similar spectra for all stones (Fig. 4), this suggests that they all came from the same eruptive event.  What is very unusual is the copper content, though not high, it is definitely detectable and quantifiable.    There are thin films of copper along lattice planes that cause the color and a metallic flash in some cases.
Copper does occur in some basalts (For example the Keweenawan basalts of upper Michigan, NJ basalts, Svalbard basalts) but in most cases, the plagioclase of the basalt is not gemmy nor very large.  Very beautiful and unusual material!
Date:    12-13-2024                      Signature
Power Ruby bracelets · Soul Body Gems, February 2025
The bracelet photograph shows our February 2025 collection under the Power Ruby trade name. The laboratory report below concerns the separately tested obelisk, sample 9047; it is retained here as the documented analysis of that specimen.
Finding: The specimen is mostly serpentine-group material, with amesite dominant and antigorite around small grains of corundum. Smoky quartz was not identified in this specimen.
“Ruby in Smoky Quartz” is a misleading market description for the tested piece. The report identifies corundum grains, but it does not independently determine whether those grains qualify as gemological ruby. The pink and brown areas differ in iron and titanium content; the report suggests these account for their contrasting colors.
Tested specimen: Sample 9047, report completed June 5, 2020. These findings describe this obelisk, not every item sold as “Power Ruby.”
View the original report
Select a page to enlarge it. Three report pages, with a text transcript below.
Use this guide alongside the written findings and the original report transcript. It explains the purpose of each analytical figure and preserves the laboratory’s own figure labels. The interpretations apply to the tested specimen; signals alone do not establish the identity of every similar-looking stone.
Electron microscope image: This view shows small-scale regions selected for analysis. Its brightness contrast helps distinguish regions with different compositions; it is not a photograph of their natural colors. Numbered spots connect this view to the analyses listed in the report.
Laboratory figure caption: Fig. 1: Backscattered electron image (carved opal). This is in the pink area
Elemental spectrum: The peaks record characteristic X-ray signals from elements in the analyzed spot or area. This is an analysis of that location, not automatically of the entire specimen. Any mineral identification or uncertainty named in the laboratory caption is retained below.
Laboratory figure caption: Fig. 2: Energy dispersive spectrum of spot 1 in Fig. 1. (amesite, serpentine group).
Electron microscope image: This view shows small-scale regions selected for analysis. Its brightness contrast helps distinguish regions with different compositions; it is not a photograph of their natural colors. Numbered spots connect this view to the analyses listed in the report.
Laboratory figure caption: Fig. 3: Backscattered electron image (obelisk). This is in the brown area.
Elemental spectrum: The peaks record characteristic X-ray signals from elements in the analyzed spot or area. This is an analysis of that location, not automatically of the entire specimen. Any mineral identification or uncertainty named in the laboratory caption is retained below.
Laboratory figure caption: Fig. 4: Energy dispersive spectrum of spot 1 in Fig. 3. (amesit, serpentine groupe).
Elemental spectrum: The peaks record characteristic X-ray signals from elements in the analyzed spot or area. This is an analysis of that location, not automatically of the entire specimen. Any mineral identification or uncertainty named in the laboratory caption is retained below.
Laboratory figure caption: Fig. 5: Energy dispersive spectrum of spot 2 in Fig. 3. (corundum).
Elemental spectrum: The peaks record characteristic X-ray signals from elements in the analyzed spot or area. This is an analysis of that location, not automatically of the entire specimen. Any mineral identification or uncertainty named in the laboratory caption is retained below.
Laboratory figure caption: Fig. 6: Energy dispersive spectrum of spot 1 in Fig. 3. (antigorite).
Read the report as text
Analytical Result Report
Sample id: 9047 (pink and brown obelisk)
Submitted by: K.Bitner
Date submitted: June 4, 2020
Date completed: June 5, 2020
Operating conditions: JEOL JSM-6400 operated at 25 kV acceleration potential, 15 mm working distance, 15 degrees sample tilt, coated with 250 Å carbon. Using the X-ray fluorescence attachment with 35kv potental in conjunction with the EDS system.
Fig. 1: Backscattered electron image (carved opal).  This is in the pink area
Fig. 2: Energy dispersive spectrum of spot 1 in Fig. 1.  (amesite, serpentine group).
Fig. 3: Backscattered electron image (obelisk).  This is in the brown area.
Fig. 4: Energy dispersive spectrum of spot 1 in Fig. 3.  (amesit, serpentine groupe).
Fig. 5: Energy dispersive spectrum of spot 2 in Fig. 3.  (corundum).
Fig. 6: Energy dispersive spectrum of spot 1 in Fig. 3.  (antigorite).
Table 1: Trace elements by X-ray fluorescence.
element | pink area, ppm | brown area, ppm
Fe | 1328 | 2148
Ti | 860 | 7200
Mn | 35 | 60
Summary of findings:  This is an interesting specimen!  The material is largely composed of serpentine group minerals.  Amesite is dominant (Figs. 1-4).  Some grains of corundum (Figs. 4 and 5)  were note and they have antigorite (Figs 4 and 6) radiating from it, suggesting a reaction.  The brown area is much more enriched in iron and titanium than the pink area.  The pink is likely caused by a little trivalent iron whereas the brown is likely caused by the much higher content of trivalent iron, possibly coupled with titanium (Table 1).
Date:   June 5 ,2020                                       Signature
A pink-and-brown carved obelisk sold under the trade name “Power Ruby” was analyzed to identify its mineral components.
Finding: The specimen is mostly serpentine-group material, with amesite dominant and antigorite around small grains of corundum. Smoky quartz was not identified in this specimen.
“Ruby in Smoky Quartz” is a misleading market description for the tested piece. The report identifies corundum grains, but it does not independently determine whether those grains qualify as gemological ruby. The pink and brown areas differ in iron and titanium content; the report suggests these account for their contrasting colors.
Tested specimen: Sample 9047, report completed June 5, 2020. These findings describe this obelisk, not every item sold as “Power Ruby.”
View the original report
Select a page to enlarge it. Three report pages, with a text transcript below.
Use this guide alongside the written findings and the original report transcript. It explains the purpose of each analytical figure and preserves the laboratory’s own figure labels. The interpretations apply to the tested specimen; signals alone do not establish the identity of every similar-looking stone.
Electron microscope image: This view shows small-scale regions selected for analysis. Its brightness contrast helps distinguish regions with different compositions; it is not a photograph of their natural colors. Numbered spots connect this view to the analyses listed in the report.
Laboratory figure caption: Fig. 1: Backscattered electron image (carved opal). This is in the pink area
Elemental spectrum: The peaks record characteristic X-ray signals from elements in the analyzed spot or area. This is an analysis of that location, not automatically of the entire specimen. Any mineral identification or uncertainty named in the laboratory caption is retained below.
Laboratory figure caption: Fig. 2: Energy dispersive spectrum of spot 1 in Fig. 1. (amesite, serpentine group).
Electron microscope image: This view shows small-scale regions selected for analysis. Its brightness contrast helps distinguish regions with different compositions; it is not a photograph of their natural colors. Numbered spots connect this view to the analyses listed in the report.
Laboratory figure caption: Fig. 3: Backscattered electron image (obelisk). This is in the brown area.
Elemental spectrum: The peaks record characteristic X-ray signals from elements in the analyzed spot or area. This is an analysis of that location, not automatically of the entire specimen. Any mineral identification or uncertainty named in the laboratory caption is retained below.
Laboratory figure caption: Fig. 4: Energy dispersive spectrum of spot 1 in Fig. 3. (amesit, serpentine groupe).
Elemental spectrum: The peaks record characteristic X-ray signals from elements in the analyzed spot or area. This is an analysis of that location, not automatically of the entire specimen. Any mineral identification or uncertainty named in the laboratory caption is retained below.
Laboratory figure caption: Fig. 5: Energy dispersive spectrum of spot 2 in Fig. 3. (corundum).
Elemental spectrum: The peaks record characteristic X-ray signals from elements in the analyzed spot or area. This is an analysis of that location, not automatically of the entire specimen. Any mineral identification or uncertainty named in the laboratory caption is retained below.
Laboratory figure caption: Fig. 6: Energy dispersive spectrum of spot 1 in Fig. 3. (antigorite).
Read the report as text
Analytical Result Report
Sample id: 9047 (pink and brown obelisk)
Submitted by: K.Bitner
Date submitted: June 4, 2020
Date completed: June 5, 2020
Operating conditions: JEOL JSM-6400 operated at 25 kV acceleration potential, 15 mm working distance, 15 degrees sample tilt, coated with 250 Å carbon. Using the X-ray fluorescence attachment with 35kv potental in conjunction with the EDS system.
Fig. 1: Backscattered electron image (carved opal).  This is in the pink area
Fig. 2: Energy dispersive spectrum of spot 1 in Fig. 1.  (amesite, serpentine group).
Fig. 3: Backscattered electron image (obelisk).  This is in the brown area.
Fig. 4: Energy dispersive spectrum of spot 1 in Fig. 3.  (amesit, serpentine groupe).
Fig. 5: Energy dispersive spectrum of spot 2 in Fig. 3.  (corundum).
Fig. 6: Energy dispersive spectrum of spot 1 in Fig. 3.  (antigorite).
Table 1: Trace elements by X-ray fluorescence.
element | pink area, ppm | brown area, ppm
Fe | 1328 | 2148
Ti | 860 | 7200
Mn | 35 | 60
Summary of findings:  This is an interesting specimen!  The material is largely composed of serpentine group minerals.  Amesite is dominant (Figs. 1-4).  Some grains of corundum (Figs. 4 and 5)  were note and they have antigorite (Figs 4 and 6) radiating from it, suggesting a reaction.  The brown area is much more enriched in iron and titanium than the pink area.  The pink is likely caused by a little trivalent iron whereas the brown is likely caused by the much higher content of trivalent iron, possibly coupled with titanium (Table 1).
Date:   June 5 ,2020                                       Signature
Ruby is the red gem variety of corundum. This overview will grow as we add more background, photographs, and tested material.
Several different mixed-mineral pieces in our archive contain corundum, but they are not interchangeable examples. The reports identify minerals in the individual specimens; neither report alone grades the corundum grains as faceted ruby gems.
In sample 92855 (#10), the bulk is kyanite and red grains include chromium-bearing corundum. The report also records chromian muscovite and a likely titanium oxide. Read the Ruby Kyanite findings and transcript →
These are distinct tested mineral associations; similar market names do not establish identical composition.
Variation 3 · Ruby Clinochlore
The April 20, 2022 specimen with printed sample ID 92905 contains corundum, likely clinochlore, spinel and accessory minerals. Read the Ruby Clinochlore findings →
Select a page to enlarge it. 5 pages; findings are summarized in accessible text above.
The August 16, 2022 disk with printed sample ID 92937 contains XRD-confirmed kyanite, corundum/ruby, chlorite-group material and muscovite. Read the Chinese disk findings →
Select a page to enlarge it. 6 pages; findings are summarized in accessible text above.
Use this guide alongside the written findings and the original report transcript. It explains the purpose of each analytical figure and preserves the laboratory’s own figure labels. The interpretations apply to the tested specimen; signals alone do not establish the identity of every similar-looking stone.
Electron microscope image: This view shows small-scale regions selected for analysis. Its brightness contrast helps distinguish regions with different compositions; it is not a photograph of their natural colors. Numbered spots connect this view to the analyses listed in the report.
Laboratory figure caption: Fig. 1: Backscattered electron image (carved opal). This is in the pink area
Elemental spectrum: The peaks record characteristic X-ray signals from elements in the analyzed spot or area. This is an analysis of that location, not automatically of the entire specimen. Any mineral identification or uncertainty named in the laboratory caption is retained below.
Laboratory figure caption: Fig. 2: Energy dispersive spectrum of spot 1 in Fig. 1. (amesite, serpentine group).
Electron microscope image: This view shows small-scale regions selected for analysis. Its brightness contrast helps distinguish regions with different compositions; it is not a photograph of their natural colors. Numbered spots connect this view to the analyses listed in the report.
Laboratory figure caption: Fig. 3: Backscattered electron image (obelisk). This is in the brown area.
Elemental spectrum: The peaks record characteristic X-ray signals from elements in the analyzed spot or area. This is an analysis of that location, not automatically of the entire specimen. Any mineral identification or uncertainty named in the laboratory caption is retained below.
Laboratory figure caption: Fig. 4: Energy dispersive spectrum of spot 1 in Fig. 3. (amesit, serpentine groupe).
Elemental spectrum: The peaks record characteristic X-ray signals from elements in the analyzed spot or area. This is an analysis of that location, not automatically of the entire specimen. Any mineral identification or uncertainty named in the laboratory caption is retained below.
Laboratory figure caption: Fig. 5: Energy dispersive spectrum of spot 2 in Fig. 3. (corundum).
Elemental spectrum: The peaks record characteristic X-ray signals from elements in the analyzed spot or area. This is an analysis of that location, not automatically of the entire specimen. Any mineral identification or uncertainty named in the laboratory caption is retained below.
Laboratory figure caption: Fig. 6: Energy dispersive spectrum of spot 1 in Fig. 3. (antigorite).
Electron microscope image: This view shows small-scale regions selected for analysis. Its brightness contrast helps distinguish regions with different compositions; it is not a photograph of their natural colors. Numbered spots connect this view to the analyses listed in the report.
Laboratory figure caption: Fig. 2: Backscattered electron image of the specimen.
Elemental spectrum: The peaks record characteristic X-ray signals from elements in the analyzed spot or area. This is an analysis of that location, not automatically of the entire specimen. Any mineral identification or uncertainty named in the laboratory caption is retained below.
Laboratory figure caption: Fig. 3: Energy dispersive spectral analysis of spot 1 in Fig. 2. (Ti oxide such as rutile)
Elemental spectrum: The peaks record characteristic X-ray signals from elements in the analyzed spot or area. This is an analysis of that location, not automatically of the entire specimen. Any mineral identification or uncertainty named in the laboratory caption is retained below.
Laboratory figure caption: Fig. 4: Energy dispersive spectral analysis of spot 2 in Fig. 2. (muscovite, chromian)
Elemental spectrum: The peaks record characteristic X-ray signals from elements in the analyzed spot or area. This is an analysis of that location, not automatically of the entire specimen. Any mineral identification or uncertainty named in the laboratory caption is retained below.
Laboratory figure caption: Fig. 5: Energy dispersive spectral analysis of spot 3 in Fig. 2. (aluminum silicate – kyanite)
Electron microscope image: This view shows small-scale regions selected for analysis. Its brightness contrast helps distinguish regions with different compositions; it is not a photograph of their natural colors. Numbered spots connect this view to the analyses listed in the report.
Laboratory figure caption: Fig. 6: Backscattered electron image of another area of the specimen.
Elemental spectrum: The peaks record characteristic X-ray signals from elements in the analyzed spot or area. This is an analysis of that location, not automatically of the entire specimen. Any mineral identification or uncertainty named in the laboratory caption is retained below.
Laboratory figure caption: Fig. 7: Energy dispersive spectral analysis of spot 1 in Fig. 6. (corundum)
Element map: This map shows where the named elements occur within the analyzed area. Its colors represent the laboratory’s selected element channels, rather than the specimen’s visible colors. The caption below preserves any color key or distribution noted by the laboratory.
Laboratory figure caption: Fig. 8: X-ray maps of the area shown in Fig. 2: Silicon: green, aluminum: red, titanium: blue.
Electron microscope image: This view shows small-scale regions selected for analysis. Its brightness contrast helps distinguish regions with different compositions; it is not a photograph of their natural colors. Numbered spots connect this view to the analyses listed in the report.
Laboratory figure caption: Fig. 2: Backscattered electron image of an area of the specimen.
Elemental spectrum: The peaks record characteristic X-ray signals from elements in the analyzed spot or area. This is an analysis of that location, not automatically of the entire specimen. Any mineral identification or uncertainty named in the laboratory caption is retained below.
Laboratory figure caption: Fig. 3: Energy dispersive spectral analysis of spot 1 in Fig. 2 (chlorite group)
Elemental spectrum: The peaks record characteristic X-ray signals from elements in the analyzed spot or area. This is an analysis of that location, not automatically of the entire specimen. Any mineral identification or uncertainty named in the laboratory caption is retained below.
Laboratory figure caption: Fig. 4: Energy dispersive spectral analysis of spot 2 in Fig. 2 (high magnesium pyroxene/amphibole)
Electron microscope image: This view shows small-scale regions selected for analysis. Its brightness contrast helps distinguish regions with different compositions; it is not a photograph of their natural colors. Numbered spots connect this view to the analyses listed in the report.
Laboratory figure caption: Fig. 5: Backscattered electron image of another area of the specimen.
Elemental spectrum: The peaks record characteristic X-ray signals from elements in the analyzed spot or area. This is an analysis of that location, not automatically of the entire specimen. Any mineral identification or uncertainty named in the laboratory caption is retained below.
Laboratory figure caption: Fig. 6: Energy dispersive spectral analysis of spot 1 in Fig. 5 (zircon)
Elemental spectrum: The peaks record characteristic X-ray signals from elements in the analyzed spot or area. This is an analysis of that location, not automatically of the entire specimen. Any mineral identification or uncertainty named in the laboratory caption is retained below.
Laboratory figure caption: Fig. 7: Energy dispersive spectral analysis of spot 2 in Fig. 5 (corundum).
Elemental spectrum: The peaks record characteristic X-ray signals from elements in the analyzed spot or area. This is an analysis of that location, not automatically of the entire specimen. Any mineral identification or uncertainty named in the laboratory caption is retained below.
Laboratory figure caption: Fig. 8: Energy dispersive spectral analysis of spot 3 in Fig. 5 (spinel).
Element map: This map shows where the named elements occur within the analyzed area. Its colors represent the laboratory’s selected element channels, rather than the specimen’s visible colors. The caption below preserves any color key or distribution noted by the laboratory.
Laboratory figure caption: Fig. 8: X-ray maps showing mganesium in red, aluminum in green and silicon in blue.
Elemental spectrum: The peaks record characteristic X-ray signals from elements in the analyzed spot or area. This is an analysis of that location, not automatically of the entire specimen. Any mineral identification or uncertainty named in the laboratory caption is retained below.
Laboratory figure caption: Fig. 3: Energy dispersive spectral analysis of spot 1 in Fig. 2 (chlorite group species)
Elemental spectrum: The peaks record characteristic X-ray signals from elements in the analyzed spot or area. This is an analysis of that location, not automatically of the entire specimen. Any mineral identification or uncertainty named in the laboratory caption is retained below.
Laboratory figure caption: Fig. 4: Energy dispersive spectral analysis of spot 2 in Fig. 2 (aluminum silicate)
Elemental spectrum: The peaks record characteristic X-ray signals from elements in the analyzed spot or area. This is an analysis of that location, not automatically of the entire specimen. Any mineral identification or uncertainty named in the laboratory caption is retained below.
Laboratory figure caption: Fig. 5: Energy dispersive spectral analysis of spot 3 in Fig. 2 (muscovite)
Elemental spectrum: The peaks record characteristic X-ray signals from elements in the analyzed spot or area. This is an analysis of that location, not automatically of the entire specimen. Any mineral identification or uncertainty named in the laboratory caption is retained below.
Laboratory figure caption: Fig. 6: Energy dispersive spectral analysis of spot 5 in Fig. 2 (zircon)
Electron microscope image: This view shows small-scale regions selected for analysis. Its brightness contrast helps distinguish regions with different compositions; it is not a photograph of their natural colors. Numbered spots connect this view to the analyses listed in the report.
Laboratory figure caption: Fig. 7: Backscattered electron image of another area of the specimen.
Elemental spectrum: The peaks record characteristic X-ray signals from elements in the analyzed spot or area. This is an analysis of that location, not automatically of the entire specimen. Any mineral identification or uncertainty named in the laboratory caption is retained below.
Laboratory figure caption: Fig. 8: Energy dispersive spectral analysis of spot 6 in Fig. 2 (muscovite)
Electron microscope image: This view shows small-scale regions selected for analysis. Its brightness contrast helps distinguish regions with different compositions; it is not a photograph of their natural colors. Numbered spots connect this view to the analyses listed in the report.
Laboratory figure caption: Fig. 9: Backscattered electron image of another area of the specimen. Dark object on top is a marker arrow.
Elemental spectrum: The peaks record characteristic X-ray signals from elements in the analyzed spot or area. This is an analysis of that location, not automatically of the entire specimen. Any mineral identification or uncertainty named in the laboratory caption is retained below.
Laboratory figure caption: Fig. 10: Energy dispersive spectral analysis of spot 1 in Fig. 9 (corundum/ruby).
Element map: This map shows where the named elements occur within the analyzed area. Its colors represent the laboratory’s selected element channels, rather than the specimen’s visible colors. The caption below preserves any color key or distribution noted by the laboratory.
Laboratory figure caption: Fig. 11: X-ray map of the area shown in Fig. 9. Aluminum: yellow, magnesium: red, silicon: green.
Read the Power Ruby obelisk laboratory report as text
Analytical Result Report
Sample id: 9047 (pink and brown obelisk)
Submitted by: K.Bitner
Date submitted: June 4, 2020
Date completed: June 5, 2020
Operating conditions: JEOL JSM-6400 operated at 25 kV acceleration potential, 15 mm working distance, 15 degrees sample tilt, coated with 250 Å carbon. Using the X-ray fluorescence attachment with 35kv potental in conjunction with the EDS system.
Fig. 1: Backscattered electron image (carved opal).  This is in the pink area
Fig. 2: Energy dispersive spectrum of spot 1 in Fig. 1.  (amesite, serpentine group).
Fig. 3: Backscattered electron image (obelisk).  This is in the brown area.
Fig. 4: Energy dispersive spectrum of spot 1 in Fig. 3.  (amesit, serpentine groupe).
Fig. 5: Energy dispersive spectrum of spot 2 in Fig. 3.  (corundum).
Fig. 6: Energy dispersive spectrum of spot 1 in Fig. 3.  (antigorite).
Table 1: Trace elements by X-ray fluorescence.
element | pink area, ppm | brown area, ppm
Fe | 1328 | 2148
Ti | 860 | 7200
Mn | 35 | 60
Summary of findings:  This is an interesting specimen!  The material is largely composed of serpentine group minerals.  Amesite is dominant (Figs. 1-4).  Some grains of corundum (Figs. 4 and 5)  were note and they have antigorite (Figs 4 and 6) radiating from it, suggesting a reaction.  The brown area is much more enriched in iron and titanium than the pink area.  The pink is likely caused by a little trivalent iron whereas the brown is likely caused by the much higher content of trivalent iron, possibly coupled with titanium (Table 1).
Date:   June 5 ,2020                                       Signature
Read the Ruby Kyanite from India laboratory report as text
This text is transcribed from the laboratory report so the findings and figure captions can be read without opening the page images. The images remain available above for visual details.
Laboratory report
                                               Analytical Result Report

Sample id: 92855 (#10)
Submitted by: K. Bitner
Date submitted: Feb. 14, 2022.
Date completed: March 9, 2022.
Operating conditions: An AMRAY 1830 SEM operated at 25 kV acceleration potential, 26 mm working distance, 15
degrees sample tilt, coated with 250 Å carbon. Using the X-ray fluorescence attachment with 35 kV potential in
conjunction with the EDS system.


Fig. 1: Photograph of the specimen. 9 cm maximum dimensions.


Fig. 2: Backscattered electron image of the specimen.
Fig. 3: Energy dispersive spectral analysis of spot 1 in Fig. 2. (Ti oxide such as rutile)


Fig. 4: Energy dispersive spectral analysis of spot 2 in Fig. 2. (muscovite, chromian)
Fig. 5: Energy dispersive spectral analysis of spot 3 in Fig. 2. (aluminum silicate – kyanite)


Fig. 6: Backscattered electron image of another area of the specimen.
Fig. 7: Energy dispersive spectral analysis of spot 1 in Fig. 6. (corundum)


Fig. 8: X-ray maps of the area shown in Fig. 2: Silicon: green, aluminum: red, titanium: blue.


Fig. 9: image under ultraviolet light showing red fluorescence of the corundum.


Table 1: Minor and trace element composition of the specimen. (in wt. %).
 Calcium                                                     0.14
 Chromium                                                    0.22
 Iron                                                        0.16
 Magnesium                                                   0.13
 Manganese                                                   0.02
 Phosphorus                                                  0.01
 Sodium                                                      0.19
 Titanium                                                    1.15


Summary of findings: This specimen (Fig. 1) is composed mainly of kyanite (Figs. 2 and 5), corundum (Figs. 6 and 7) and
some muscovite. (Figs. 2 and 4) and a titanium oxide species, likely rutile (Figs 2 and 3). The muscovite is chromium-
bearing and frequently called ’fuchsite’). The assemblage with kyanite indicates high pressure and low to medium
temperature during metamorphism. Continent-continent collisional margins would be a good source of material like
this. The X-ray map (Fig. 8) shows the distribution of the main elements clearly. The bulk material is kyanite. The
corundum is UV fluorescent (Fig. 9) which is caused by a small amount of chromium which is present in the material
(Table 1).


Date: March 5, 2022                       Signature
Read the Ruby Clinochlore laboratory report as text
The following text and tables are transcribed from the original laboratory document. Figure captions identify the report images; the laboratory interpretations and limitations are preserved.
Laboratory report 1
Analytical Result Report
Sample id: 92905 (#5) ‘Ruby
Submitted by: K. Bitner
Date submitted: April 4, 2022.
Date completed: April 20, 2022.
Operating conditions: An AMRAY 1830 SEM operated at 25 kV acceleration potential, 26 mm working distance, 15 degrees sample tilt, coated with 250 Å carbon. Using the X-ray fluorescence attachment with 35 kV potential in conjunction with the EDS system.
Fig. 1: Photograph of the specimen. 7 cm maximum dimensions.
Fig. 2: Backscattered electron image of an area of the specimen.
Fig. 3: Energy dispersive spectral analysis of spot 1 in Fig. 2 (chlorite group)
Fig. 4: Energy dispersive spectral analysis of spot 2 in Fig. 2 (high magnesium pyroxene/amphibole)
Fig. 5: Backscattered electron image of another area of the specimen.
Fig. 6: Energy dispersive spectral analysis of spot 1 in Fig. 5 (zircon)
Fig. 7: Energy dispersive spectral analysis of spot 2 in Fig. 5 (corundum).
Fig. 8: Energy dispersive spectral analysis of spot 3 in Fig. 5 (spinel).
Fig. 8: X-ray maps showing mganesium in red, aluminum in green and silicon in blue.
Table 1: Minor and trace element composition of the specimen. (in wt. %).
Laboratory data as recorded in the report
Element
Reported value
Chromium
0.22
Iron
0.08
Titanium
0.88
Vanadium
0.13
Summary of findings: This specimen (Fig. 1) is very interesting! It is composed of a number of mineral species: a chlorite group member, likely clinochlore (Figs. 2 and 4), spinel (Figs. 5 and 8), corundum (Figs. 5 and 7), a magnesium-rich pyroxene or amphibole (enstatite or anthophyllite) (Figs. 2 and 4), the presence of aluminum indicates possibly anthophyllite would be the best fit, and minor zircon. (Figs. 5 and 6). The whole assemblage is highly aluminum and magnesium enriched and suggests a source in a metamorphic environment with a protolith of mixed pelitic , ultramafic or possibly carbonate rocks. Under these conditions, phlogopite would be an expected mineral but it was not found in the areas investigated.
Date: April 20, 2022 Signature
Read the Kyanite Ruby Clinochlore from China laboratory report as text
The following text and tables are transcribed from the original laboratory document. Figure captions identify the report images; the laboratory interpretations and limitations are preserved.
Laboratory report 1
Analytical Result Report
Sample id: 92937 (#8, ruby/kyanite disk)
Submitted by: K. Bitner
Date submitted: July 14, 2022.
Date completed: August 16, 2022.
Operating conditions: An AMRAY 1830 SEM operated at 25 kV acceleration potential, 26 mm working distance, 15 degrees sample tilt, coated with 250 Å carbon. Using the X-ray fluorescence attachment with 35 kV potential in conjunction with the EDS system. A Bruker D2 Phaser X-ray diffractometer was used and operated at 30 kV and 10 mA.
Fig. 1: Photograph of the specimen. Approximately 12 cm maximum dimensions.
Fig. 2: Backscattered electron image of an area of the specimen.
Fig. 3: Energy dispersive spectral analysis of spot 1 in Fig. 2 (chlorite group species)
Fig. 4: Energy dispersive spectral analysis of spot 2 in Fig. 2 (aluminum silicate)
Fig. 5: Energy dispersive spectral analysis of spot 3 in Fig. 2 (muscovite)
Fig. 6: Energy dispersive spectral analysis of spot 5 in Fig. 2 (zircon)
Fig. 7: Backscattered electron image of another area of the specimen.
Fig. 8: Energy dispersive spectral analysis of spot 6 in Fig. 2 (muscovite)
Fig. 9: Backscattered electron image of another area of the specimen. Dark object on top is a marker arrow.
Fig. 10: Energy dispersive spectral analysis of spot 1 in Fig. 9 (corundum/ruby).
Fig. 11: X-ray map of the area shown in Fig. 9. Aluminum: yellow, magnesium: red, silicon: green.
Table 1: Minor and trace element composition of the specimen. (in wt. %).
Laboratory data as recorded in the report
Element
Reported value
Chromium
0.15
Iron
0.6
Magnesium
7.0
Potassium
2.1
Titanium
0.6
Zirconium
0.1
Summary of findings: This specimen (Fig. 1) is composed of chlorite group species such as clinochlore (Figs. 2 and 3), kyanite (confirmed by X-ray diffraction) (Figs. 2 and 4), muscovite (Figs. 2,5,7, and 8), corundum/ruby 9Figs. 9-11 )and zircon(Figs. 2 and 6). Some apatite is also present. Some of the kyanite is partially replaced by muscovite but some is still left which was revealed by XRD.
The corundum/ruby fluoresces the typical red (Fig. 12).
Acicular Shattuckite in Calcite with Dioptase · October 2025 collection photograph; identification and locality are supplied descriptions.
Blue shattuckite needles, green dioptase, and pale calcite make a striking reported association from the Democratic Republic of the Congo.
Provenance: Our sourcing notes describe a short-lived 2016 find in the DRC. We have not independently documented that discovery date or tested a Soul Body Gems specimen, so the date and the identity of each component should be read as reported provenance, not a laboratory conclusion about every piece.
Science and form
Acicular means needle-like. Shattuckite is a blue copper silicate; dioptase is a vivid green copper silicate; calcite is calcium carbonate. These minerals can occur together in copper-rich deposits. Their visible arrangement is compelling, but appearance alone cannot establish a precise formation sequence, the full composition, or a specimen's mine of origin.
Meaning and intention
In metaphysical traditions, shattuckite is associated with honest expression and intuition, dioptase with compassion, and calcite with steadiness. People may use this combination as a personal reminder to communicate with care and remain grounded. These are symbolic interpretations rather than measured properties or medical effects.
Queen conch: the ocean's layered architecture, warm pink shell, and a reminder to value its living source.
Natural history: The queen conch is a marine mollusk now classified as Aliger gigas (formerly Lobatus gigas). It lives in the Caribbean region, including the Florida Keys. Its shell develops as the animal grows, with a characteristic pink inner lip.
Science and responsible sourcing
Queen conch has been used in ornament and carving, but wild populations have faced heavy harvest pressure. NOAA lists the species as threatened under the U.S. Endangered Species Act. Any future shell jewelry or carving listing should state its provenance and applicable trade documentation; this educational profile does not imply that Soul Body Gems currently offers queen conch material.
Meaning and intention
Its spiral can symbolize unfolding growth, while the pink and ocean tones may invite reflection on tenderness, compassion, and renewal. These are personal and cultural associations, not health claims.
Peridot's fresh green color comes from its iron-bearing olivine chemistry. In some Pakistani stones, a miniature world of fine, dark needles gives the gem a distinctive internal character.
What GIA observed: A 2026 Gems & Gemology Micro-World article documents needle-like ludwigite inclusions in a 7.44 ct Pakistani peridot. Among them was an unusually cylindrical cavity containing liquid and a movable gas bubble: a two-phase inclusion. GIA studied that stone; Soul Body Gems did not submit the stones pictured or sold by us as part of this report.
Peridot: a gem of earth and light
Peridot is the gem variety of olivine and is known for its green hues, from yellow-green to deeper olive. The amount and setting of iron influence the color. Inclusions can add character and, when properly identified alongside other evidence, help a gemologist consider its origin. Similar-looking needles should not be identified by appearance alone.
The ludwigite detail
Some descriptions refer to the ludwigite–vonsenite mineral series, but the cited GIA observation calls the needles ludwigite. We do not infer vonsenite in a particular stone without a specimen-specific analysis. The observed inclusions are geological details, not a grading defect by default; their effect on beauty and durability depends on the individual gem.
“Tai Chi Quartz” is a market name attached to this Chinese carved tower, also sold as Taiji Stone and sometimes as jade or anhydrite. The laboratory findings tell a different geological story.
Finding: Sample 9250 showed high-magnesium calcite. The darker areas approach, but do not reach, stoichiometric dolomite. Quartz grains and likely organic components are also present. No sulfur was detected, so the specimen is not anhydrite. The researcher described it as silty, high-magnesium calcite-bearing limestone, possibly grading toward fine-grained marble.
Why it matters: Neither “quartz” nor “jade” is an accurate name for the whole tested carving. The report describes quartz grains within a carbonate-rich rock, not a quartz or jade specimen. These results apply to this submitted piece, not to everything sold under either trade name.
Tested specimen: Chinese tower submitted January 15, 2021; report completed January 25, 2021. See also Taiji Stone for the alternate market name.
View the original report
Select a page to enlarge it. 2 pages; findings are summarized in accessible text above.
The following text and tables are transcribed from the original laboratory document. Figure captions identify the report images; the laboratory interpretations and limitations are preserved.
Laboratory report 1
Analytical Result Report
Sample id: 9250 (Chinese tower -said to be anhydrite)
Submitted by: K. Bitner
Date submitted: Jan. 15, 2021.
Date completed: Jan. 25, 2021.
Operating conditions: JEOL JSM-6400 operated at 25 kV acceleration potential, 15 mm working distance, 15 degrees sample tilt, coated with 250 Å carbon. Using the X-ray fluorescence attachment with 35kv potental in conjunction with the EDS system.
Fig. 1: Photograph of the specimen, approximately 6 cm tall.
Fig. 2: Petrographic photomicrographs of the acid-insoluble residue of the specimen. Left: plane polarized light, right: with crossed Nichols. Width of view: 750 microns.
Fig. 3: Effervescence of the specimen in contact with 10 % hydrochloric acid showing bubbles of carbon dioxide being released.
Table 1: Compositions of the specimen (In weight percent)
Laboratory data as recorded in the report
element
Light gray area
Dark gray area
Silicon dioxide
8.5
11.36
Aluminum oxide
0.70
1.04
Calcium oxide
38.7
30.5
Magnesium oxide
7.53
15.4
Iron oxide
0.07
0.09
Sulfur trioxide
Not detected
Not detected
Summary of findings: Surprise, the specimen (Fig. 1) is not anhydrite! It contains nor detectable sulfur!
It is a high magnesium calcite; the dark areas are getting close to dolomite but do not quite make it to stoichiometric dolomite. The sample still effervesces with cold diluted acid which dolomite does not do easily. There are silt-size particles of quartz present as well (Fig. 2). The darker color of some of the bands is likely due to organic components. A pretty specimen but just not anhydrite.
In summary, this could be called a silty, high-magnesium calcite-bearing limestone or a slightly metamorphosed one that is grading into fine-grained marble.
The December collection uses the spelling Taji Stone; this is the Taiji Stone profile.
Taiji Stone is another market name for the same Chinese tower in our Tai Chi Quartz entry. One laboratory report serves both names.
Finding: The submitted specimen is a silty, high-magnesium calcite-bearing limestone, possibly grading toward fine-grained marble. Quartz grains are present; no sulfur was detected. It was not identified as anhydrite or jade.
Read the fuller interpretation under Tai Chi Quartz. The findings apply to the submitted sample, not every item bearing this market name.
View the original report
Select a page to enlarge it. 2 pages; findings are summarized in accessible text above.
The following text and tables are transcribed from the original laboratory document. Figure captions identify the report images; the laboratory interpretations and limitations are preserved.
Laboratory report 1
Analytical Result Report
Sample id: 9250 (Chinese tower -said to be anhydrite)
Submitted by: K. Bitner
Date submitted: Jan. 15, 2021.
Date completed: Jan. 25, 2021.
Operating conditions: JEOL JSM-6400 operated at 25 kV acceleration potential, 15 mm working distance, 15 degrees sample tilt, coated with 250 Å carbon. Using the X-ray fluorescence attachment with 35kv potental in conjunction with the EDS system.
Fig. 1: Photograph of the specimen, approximately 6 cm tall.
Fig. 2: Petrographic photomicrographs of the acid-insoluble residue of the specimen. Left: plane polarized light, right: with crossed Nichols. Width of view: 750 microns.
Fig. 3: Effervescence of the specimen in contact with 10 % hydrochloric acid showing bubbles of carbon dioxide being released.
Table 1: Compositions of the specimen (In weight percent)
Laboratory data as recorded in the report
element
Light gray area
Dark gray area
Silicon dioxide
8.5
11.36
Aluminum oxide
0.70
1.04
Calcium oxide
38.7
30.5
Magnesium oxide
7.53
15.4
Iron oxide
0.07
0.09
Sulfur trioxide
Not detected
Not detected
Summary of findings: Surprise, the specimen (Fig. 1) is not anhydrite! It contains nor detectable sulfur!
It is a high magnesium calcite; the dark areas are getting close to dolomite but do not quite make it to stoichiometric dolomite. The sample still effervesces with cold diluted acid which dolomite does not do easily. There are silt-size particles of quartz present as well (Fig. 2). The darker color of some of the bands is likely due to organic components. A pretty specimen but just not anhydrite.
In summary, this could be called a silty, high-magnesium calcite-bearing limestone or a slightly metamorphosed one that is grading into fine-grained marble.
Date: January 25, 2021 Signature
This small batch of green-and-brown spheres from Brazil came without an established market name. We call it Mystery Stone until a defensible geological description can replace the nickname.
Finding: Sample 9198 is quartz-rich in both colored areas: over 95% quartz in the green area and near 90% in the brown area, according to the report. The brown has more aluminum and less silicon. The researcher observed light-colored aluminum-rich clays and a granular texture.
The green color was considered likely associated with chlorite-group clay. The brown was interpreted as possible oxidation of iron-bearing material. A quartz-cemented, altered feldspar-rich clastic rock was offered as an explanation, rather than a confirmed formal rock name. We preserve that uncertainty.
Tested specimen: Green-and-brown sphere from Brazil, sample 9198; report completed September 17, 2020. One figure caption in the report says “fluorite tower,” while the sample ID and findings concern the green-and-brown sphere; we reproduce the original document without silently changing its caption.
View the original report
Select a page to enlarge it. 2 pages; findings are summarized in accessible text above.
The following text and tables are transcribed from the original laboratory document. Figure captions identify the report images; the laboratory interpretations and limitations are preserved.
Laboratory report 1
Analytical Result Report
Sample id: 9198 (green and brown sphere from Brazil)
Submitted by: K.Bitner
Date submitted: Sept. 9, 2020
Date completed: Sept. 17, 2020
Operating conditions: JEOL JSM-6400 operated at 25 kV acceleration potential, 15 mm working distance, 15 degrees sample tilt, coated with 250 Å carbon. Using the X-ray fluorescence attachment with 35kv potental in conjunction with the EDS system.
Fig. 1: Photograph of the fluorite tower. Maximum dimension is 50 mm.
Fig. 2: Photomicrograph of the green and brown areas. 4 mm field of view.
Table 1: Compositional results for trace elements in the fluorite
Laboratory data as recorded in the report
element
Green area
Brown area
Silicon
44.5 wt. %
40.2 wt. %
Aluminum
1.22 wt. %
5.2 wt. %
Iron
5900 ppm
2000 ppm
Titanium
4800 ppm
800 ppm
Zirconium
850 ppm
890 ppm
Manganese
90 ppm
Not detected
Summary of findings: This a very odd one (Figs. 1 and 2). Chemically, they are similar, the green area is richer in silicon but lower in aluminum. It is essentially over 95 % quartz; the brown area differs by having higher aluminum content and lower silicon, but it still is close to 90% quartz (Table 1). It appears that there are aluminum-rich clays present which appear light colored in Figs. 1 and 2. The texture appears granular in both colors. The iron content is higher in the green area, the green is likely caused by a chlorite group clay. The brown is likely a result of oxidation of the green, reduced iron in the chlorite to trivalent iron compounds such as hematite. One explanation that would make sense is that this represented a feldspar-rich clastic rock in which the feldspars were altered to kaolinite and other clay species, then the rock was cemented by quartz. Since more aluminum is present in the brown area likely indicates that more feldspars were present which then altered. Thus, the material may have been more porous and permitted oxidation to proceed more intensely than in the green area. I don’t believe it was a volcanic rock that was silicified because of the clastic testure and abundance of quartz grains.
Blue Halite (Turkey) · October 2025 collection. Locality is supplied information; this pictured material was not individually tested.
Blue rock salt from Iğdır Province, Turkey: a vivid example of how defects and tiny structures within a crystal can transform the light we see.
Science: Halite is sodium chloride (NaCl). Published work on natural blue halite describes color centers and tiny sodium-rich clusters as possible contributors to blue and violet tones. The precise mechanism can vary among specimens, and we have not tested an SBG piece from this locality.
Our sourcing notes place this material in the Iğdır region, where halite occurs around Tuzluca. The locality and natural origin should be documented for any particular listing rather than inferred from color alone. Halite is water-soluble, so keep a specimen dry and handle it gently.
Meaning and intention
In metaphysical practice, some people associate blue halite with quiet reflection, intuition, and the third eye. It may be a personal focus for meditation or dream journaling. These are symbolic associations, not measured effects or medical claims.
This ring specimen, supplied to us as Australian material was examined to identify the deep-colored material. “Euphora-like Stormy” is a descriptive comparison, while the report identifies the minerals in this particular ring.
Finding: Sample 92933 contains lepidolite and albite in distinct domains. X-ray mapping showed potassium-rich and sodium-rich areas. The researcher noted high rubidium and manganese; manganese contributes to the unusually deep color of the lepidolite.
Specimen: Ring about 3.5 cm across, report completed January 13, 2023. The result applies to this ring. The separately tested Euphoralite “Storm” tower, sample 92935, was later compared with this ring by XRF.
Storm comparison: In the XRF report for tower sample 92935, the researcher found its trace-element composition and appearance very similar to this Australian ring and thought the two likely came from the same location. This is evidence of a close material match, not independent verification of either geographic origin. View the Storm tower entry.
View the original report
Select a page to enlarge it. Three pages; findings are summarized in accessible text above.
Use this guide alongside the written findings and the original report transcript. It explains the purpose of each analytical figure and preserves the laboratory’s own figure labels. The interpretations apply to the tested specimen; signals alone do not establish the identity of every similar-looking stone.
Electron microscope image: This view shows small-scale regions selected for analysis. Its brightness contrast helps distinguish regions with different compositions; it is not a photograph of their natural colors. Numbered spots connect this view to the analyses listed in the report.
Laboratory figure caption: Fig. 2 Backscattered electron image of an area of the specimen shown in Fig.1.
Elemental spectrum: The peaks record characteristic X-ray signals from elements in the analyzed spot or area. This is an analysis of that location, not automatically of the entire specimen. Any mineral identification or uncertainty named in the laboratory caption is retained below.
Laboratory figure caption: Fig. 3: Energy dispersive spectral analysis of spot 1 in Fig. 2 (lepidolite)
Elemental spectrum: The peaks record characteristic X-ray signals from elements in the analyzed spot or area. This is an analysis of that location, not automatically of the entire specimen. Any mineral identification or uncertainty named in the laboratory caption is retained below.
Laboratory figure caption: Fig. 4: Energy dispersive spectral analysis of spot 2 in Fig. 2 (albite).
Element map: This map shows where the named elements occur within the analyzed area. Its colors represent the laboratory’s selected element channels, rather than the specimen’s visible colors. The caption below preserves any color key or distribution noted by the laboratory.
Laboratory figure caption: Fig. 5: X-ray map of the area shown in Fig. 2. potassium: purple, sodium: yellow.
Read the laboratory document as text
Text and tables from the laboratory document are provided below. Consult the adjacent findings for the interpretation of each tested specimen.
Laboratory document 1
Analytical Result Report
Sample id: 92933 (ring)
Submitted by: K. Bitner
Date submitted: Jan. 13, 2023.
Date completed: Jan. 13, 2023.
Operating conditions: An AMRAY 1830 SEM operated at 25 kV acceleration potential, 26 mm working distance, 15 degrees sample tilt, coated with 250 Å carbon. Using the X-ray fluorescence attachment with 35 kV potential in conjunction with the EDS system.
A Bruker Titan X-ray fluorescence spectrometer was also used and operated with 50, 25 and 10 kV.
Fig. 1: Photograph of the specimen. Approximately 3.5 cm maximum dimension
Fig. 2 Backscattered electron image of an area of the specimen shown in Fig.1.
Fig. 3: Energy dispersive spectral analysis of spot 1 in Fig. 2 (lepidolite)
Fig. 4: Energy dispersive spectral analysis of spot 2 in Fig. 2 (albite).
.
Fig. 5: X-ray map of the area shown in Fig. 2. potassium: purple, sodium: yellow.
Table 1: Minor and trace element composition of the specimen. (in wt. %).
Laboratory data as recorded in the report
Element
Reported value
Calcium
0.5
Iron
0.1
Manganese
1.4
Rubidium
1.6
Titanium
0.02
Zinc
0.1
Summary of findings: This specimen is interesting (Fig. 1). The material of the stone consists of lepidolite (Figs. 2 and 4) and albite (Figs. 2 and 4). The X-ray map (Fig. 5) shows some of each domain. Table 1 shows some minor and trace elements. Notable is the very high content of rubidium and the similar content of manganese. Manganese is the chromophore of this very deeply colored lepidolite which is not common. Lepidolite only occurs in very evolved granitic pegmatites of the orogenic kind, those that form under mountain building conditions.
Date: January 13, 2023 Signature
Laboratory document 2
                                                Analytical Result Report

Sample id: 92935 (tower)
Submitted by: K. Bitner
Date submitted: Jan. 23, 2023.
Date completed: Jan. 24, 2023.
Operating conditions:

A Bruker Titan X-ray fluorescence spectrometer was also used and operated with 50, 25 and 10 kV.


Fig. 1: Photograph of the specimen. Approximately 5 cm maximum dimension


Table 1: Minor and trace element composition of the specimen. (in wt. %).

 Bismuth                                                0.11
 Calcium                                                0.08
 Gallium                                                0.03
 Iron                                                    0.12
 Manganese                                             1.60
 Rubidium                                               3.11
 Tin                                                     0.12
 Titanium                                               0.09
 Zinc                                                    0.12


Summary of findings: This specimen is very similar in composition (Tabel1) and appearance to the ring with the long
oval stone (Fig. 1)of very similar material. So similar that I would say that both came from the same location.
Date:  January 24, 2023                    Signature
This Australian ring specimen was examined to identify the deep-colored material. “Euphora-like Stormy” is a descriptive comparison, while the report identifies the minerals in this particular ring.
Finding: Sample 92933 contains lepidolite and albite in distinct domains. X-ray mapping showed potassium-rich and sodium-rich areas. The researcher noted high rubidium and manganese; manganese contributes to the unusually deep color of the lepidolite.
Specimen: Ring about 3.5 cm across, report completed January 13, 2023. The result applies to this ring. The separately tested Euphoralite “Storm” tower, sample 92935, was later compared with this ring by XRF.
Storm comparison: In the XRF report for tower sample 92935, the researcher found its trace-element composition and appearance very similar to this Australian ring and thought the two likely came from the same location. This is evidence of a close material match, not independent verification of either geographic origin. View the Storm tower entry.
View the original report
Select a page to enlarge it. Three pages; findings are summarized in accessible text above.
Use this guide alongside the written findings and the original report transcript. It explains the purpose of each analytical figure and preserves the laboratory’s own figure labels. The interpretations apply to the tested specimen; signals alone do not establish the identity of every similar-looking stone.
Electron microscope image: This view shows small-scale regions selected for analysis. Its brightness contrast helps distinguish regions with different compositions; it is not a photograph of their natural colors. Numbered spots connect this view to the analyses listed in the report.
Laboratory figure caption: Fig. 2 Backscattered electron image of an area of the specimen shown in Fig.1.
Elemental spectrum: The peaks record characteristic X-ray signals from elements in the analyzed spot or area. This is an analysis of that location, not automatically of the entire specimen. Any mineral identification or uncertainty named in the laboratory caption is retained below.
Laboratory figure caption: Fig. 3: Energy dispersive spectral analysis of spot 1 in Fig. 2 (lepidolite)
Elemental spectrum: The peaks record characteristic X-ray signals from elements in the analyzed spot or area. This is an analysis of that location, not automatically of the entire specimen. Any mineral identification or uncertainty named in the laboratory caption is retained below.
Laboratory figure caption: Fig. 4: Energy dispersive spectral analysis of spot 2 in Fig. 2 (albite).
Element map: This map shows where the named elements occur within the analyzed area. Its colors represent the laboratory’s selected element channels, rather than the specimen’s visible colors. The caption below preserves any color key or distribution noted by the laboratory.
Laboratory figure caption: Fig. 5: X-ray map of the area shown in Fig. 2. potassium: purple, sodium: yellow.
Read the laboratory document as text
Text and tables from the laboratory document are provided below. Consult the adjacent findings for the interpretation of each tested specimen.
Laboratory document 1
Analytical Result Report
Sample id: 92933 (ring)
Submitted by: K. Bitner
Date submitted: Jan. 13, 2023.
Date completed: Jan. 13, 2023.
Operating conditions: An AMRAY 1830 SEM operated at 25 kV acceleration potential, 26 mm working distance, 15 degrees sample tilt, coated with 250 Å carbon. Using the X-ray fluorescence attachment with 35 kV potential in conjunction with the EDS system.
A Bruker Titan X-ray fluorescence spectrometer was also used and operated with 50, 25 and 10 kV.
Fig. 1: Photograph of the specimen. Approximately 3.5 cm maximum dimension
Fig. 2 Backscattered electron image of an area of the specimen shown in Fig.1.
Fig. 3: Energy dispersive spectral analysis of spot 1 in Fig. 2 (lepidolite)
Fig. 4: Energy dispersive spectral analysis of spot 2 in Fig. 2 (albite).
.
Fig. 5: X-ray map of the area shown in Fig. 2. potassium: purple, sodium: yellow.
Table 1: Minor and trace element composition of the specimen. (in wt. %).
Laboratory data as recorded in the report
Element
Reported value
Calcium
0.5
Iron
0.1
Manganese
1.4
Rubidium
1.6
Titanium
0.02
Zinc
0.1
Summary of findings: This specimen is interesting (Fig. 1). The material of the stone consists of lepidolite (Figs. 2 and 4) and albite (Figs. 2 and 4). The X-ray map (Fig. 5) shows some of each domain. Table 1 shows some minor and trace elements. Notable is the very high content of rubidium and the similar content of manganese. Manganese is the chromophore of this very deeply colored lepidolite which is not common. Lepidolite only occurs in very evolved granitic pegmatites of the orogenic kind, those that form under mountain building conditions.
Date: January 13, 2023 Signature
Laboratory document 2
                                                Analytical Result Report

Sample id: 92935 (tower)
Submitted by: K. Bitner
Date submitted: Jan. 23, 2023.
Date completed: Jan. 24, 2023.
Operating conditions:

A Bruker Titan X-ray fluorescence spectrometer was also used and operated with 50, 25 and 10 kV.


Fig. 1: Photograph of the specimen. Approximately 5 cm maximum dimension


Table 1: Minor and trace element composition of the specimen. (in wt. %).

 Bismuth                                                0.11
 Calcium                                                0.08
 Gallium                                                0.03
 Iron                                                    0.12
 Manganese                                             1.60
 Rubidium                                               3.11
 Tin                                                     0.12
 Titanium                                               0.09
 Zinc                                                    0.12


Summary of findings: This specimen is very similar in composition (Tabel1) and appearance to the ring with the long
oval stone (Fig. 1)of very similar material. So similar that I would say that both came from the same location.
Date:  January 24, 2023                    Signature
Albite Peristerite collection photo; the report below concerns the submitted ring specimen.
A bright white feldspar ring supplied from Tanzania was offered as moonstone. Its flash prompted a closer look at which feldspar was actually present.
Finding: The report identifies the bulk as sodium-rich plagioclase between albite and oligoclase, with minor potassium feldspar. The researcher calls the iridescent material albite-peristerite, not moonstone per se. Calcium was too low for labradorite.
Tested specimen: Sample 92955, ring approximately 5 cm at its widest, report completed March 23, 2023. Tanzania is the supplied locality; the report analyzes composition, not mine origin. A visible flash alone does not settle the mineral identification.
Explore the wider distinction in our forthcoming Journal comparison of moonstone, labradorite, and peristerite.
View the original report
Select a page to enlarge it. Three pages; findings are summarized in accessible text above.
Use this guide alongside the written findings and the original report transcript. It explains the purpose of each analytical figure and preserves the laboratory’s own figure labels. The interpretations apply to the tested specimen; signals alone do not establish the identity of every similar-looking stone.
Electron microscope image: This view shows small-scale regions selected for analysis. Its brightness contrast helps distinguish regions with different compositions; it is not a photograph of their natural colors. Numbered spots connect this view to the analyses listed in the report.
Laboratory figure caption: Fig. 2 Backscattered electron image of an area of the specimen shown in Fig.1.
Elemental spectrum: The peaks record characteristic X-ray signals from elements in the analyzed spot or area. This is an analysis of that location, not automatically of the entire specimen. Any mineral identification or uncertainty named in the laboratory caption is retained below.
Laboratory figure caption: Fig. 3: Energy dispersive spectral analysis of spot 1 in Fig. 2 (albite)
Elemental spectrum: The peaks record characteristic X-ray signals from elements in the analyzed spot or area. This is an analysis of that location, not automatically of the entire specimen. Any mineral identification or uncertainty named in the laboratory caption is retained below.
Laboratory figure caption: Fig. 4: Energy dispersive spectral analysis of spot 2 in Fig. 2 (potassium feldspar).
Element map: This map shows where the named elements occur within the analyzed area. Its colors represent the laboratory’s selected element channels, rather than the specimen’s visible colors. The caption below preserves any color key or distribution noted by the laboratory.
Laboratory figure caption: Fig. 5: X-ray map of the area shown in Fig. 2. potassium: purple, sodium: yellow.
Read the original laboratory report as text
The following text and tables are transcribed from the original laboratory document. Figure captions identify the report images; the laboratory interpretations and limitations are preserved.
Laboratory report 1
Analytical Result Report
Sample id: 92955 (ring)
Submitted by: K. Bitner
Date submitted: March 23, 2023.
Date completed: March 23 2023.
Operating conditions: An AMRAY 1830 SEM operated at 25 kV acceleration potential, 26 mm working distance, 15 degrees sample tilt, coated with 250 Å carbon. Using the X-ray fluorescence attachment with 35 kV potential in conjunction with the EDS system.
A Bruker Titan X-ray fluorescence spectrometer was also used and operated with 50, 25 and 10 kV.
Fig. 1: Photograph of the specimen. Approximately 5 cm maximum dimension
Fig. 2 Backscattered electron image of an area of the specimen shown in Fig.1.
Fig. 3: Energy dispersive spectral analysis of spot 1 in Fig. 2 (albite)
Fig. 4: Energy dispersive spectral analysis of spot 2 in Fig. 2 (potassium feldspar).
.
Fig. 5: X-ray map of the area shown in Fig. 2. potassium: purple, sodium: yellow.
Table 1: Minor and trace element composition of the specimen. (in wt. %).
Laboratory data as recorded in the report
Element
Reported value
Calcium
0.7
Iron
0.02
Titanium
0.01
Summary of findings: This specimen is interesting (Fig. 1). The bulk of the specimen is between albite and oligoclase (Figs. 2 and 3) and minor potassium feldspar (Figs. 2 and 4). The X-ray map (Fig. 5) shows that the sodic plagioclase is dominant. Trace elements are very minor, and this is reflected in the clean white color. The specimen shows nice iridescence to adularescence. It is not a moonstone per se, but an albite-peristerite. It does not contain enough calcium to make it a labradorite.
Albite Peristerite collection photo; the report below concerns the submitted ring specimen.
A bright white feldspar ring supplied from Tanzania was offered as moonstone. Its flash prompted a closer look at which feldspar was actually present.
Finding: The report identifies the bulk as sodium-rich plagioclase between albite and oligoclase, with minor potassium feldspar. The researcher calls the iridescent material albite-peristerite, not moonstone per se. Calcium was too low for labradorite.
Tested specimen: Sample 92955, ring approximately 5 cm at its widest, report completed March 23, 2023. Tanzania is the supplied locality; the report analyzes composition, not mine origin. A visible flash alone does not settle the mineral identification.
Explore the wider distinction in our forthcoming Journal comparison of moonstone, labradorite, and peristerite.
View the original report
Select a page to enlarge it. Three pages; findings are summarized in accessible text above.
Use this guide alongside the written findings and the original report transcript. It explains the purpose of each analytical figure and preserves the laboratory’s own figure labels. The interpretations apply to the tested specimen; signals alone do not establish the identity of every similar-looking stone.
Electron microscope image: This view shows small-scale regions selected for analysis. Its brightness contrast helps distinguish regions with different compositions; it is not a photograph of their natural colors. Numbered spots connect this view to the analyses listed in the report.
Laboratory figure caption: Fig. 2 Backscattered electron image of an area of the specimen shown in Fig.1.
Elemental spectrum: The peaks record characteristic X-ray signals from elements in the analyzed spot or area. This is an analysis of that location, not automatically of the entire specimen. Any mineral identification or uncertainty named in the laboratory caption is retained below.
Laboratory figure caption: Fig. 3: Energy dispersive spectral analysis of spot 1 in Fig. 2 (albite)
Elemental spectrum: The peaks record characteristic X-ray signals from elements in the analyzed spot or area. This is an analysis of that location, not automatically of the entire specimen. Any mineral identification or uncertainty named in the laboratory caption is retained below.
Laboratory figure caption: Fig. 4: Energy dispersive spectral analysis of spot 2 in Fig. 2 (potassium feldspar).
Element map: This map shows where the named elements occur within the analyzed area. Its colors represent the laboratory’s selected element channels, rather than the specimen’s visible colors. The caption below preserves any color key or distribution noted by the laboratory.
Laboratory figure caption: Fig. 5: X-ray map of the area shown in Fig. 2. potassium: purple, sodium: yellow.
Read the original laboratory report as text
The following text and tables are transcribed from the original laboratory document. Figure captions identify the report images; the laboratory interpretations and limitations are preserved.
Laboratory report 1
Analytical Result Report
Sample id: 92955 (ring)
Submitted by: K. Bitner
Date submitted: March 23, 2023.
Date completed: March 23 2023.
Operating conditions: An AMRAY 1830 SEM operated at 25 kV acceleration potential, 26 mm working distance, 15 degrees sample tilt, coated with 250 Å carbon. Using the X-ray fluorescence attachment with 35 kV potential in conjunction with the EDS system.
A Bruker Titan X-ray fluorescence spectrometer was also used and operated with 50, 25 and 10 kV.
Fig. 1: Photograph of the specimen. Approximately 5 cm maximum dimension
Fig. 2 Backscattered electron image of an area of the specimen shown in Fig.1.
Fig. 3: Energy dispersive spectral analysis of spot 1 in Fig. 2 (albite)
Fig. 4: Energy dispersive spectral analysis of spot 2 in Fig. 2 (potassium feldspar).
.
Fig. 5: X-ray map of the area shown in Fig. 2. potassium: purple, sodium: yellow.
Table 1: Minor and trace element composition of the specimen. (in wt. %).
Laboratory data as recorded in the report
Element
Reported value
Calcium
0.7
Iron
0.02
Titanium
0.01
Summary of findings: This specimen is interesting (Fig. 1). The bulk of the specimen is between albite and oligoclase (Figs. 2 and 3) and minor potassium feldspar (Figs. 2 and 4). The X-ray map (Fig. 5) shows that the sodic plagioclase is dominant. Trace elements are very minor, and this is reflected in the clean white color. The specimen shows nice iridescence to adularescence. It is not a moonstone per se, but an albite-peristerite. It does not contain enough calcium to make it a labradorite.
Date: March, 2023 Signature
This vivid, uniform turquoise bead strand raised a question about its manufacture. The title records a suspected process, not a proven determination for every bead.
Finding and uncertainty: Sample 92958 contained mainly aluminum and phosphorus with copper in the turquoise range. The beads were strikingly homogeneous. The researcher was skeptical that their present form was wholly natural and proposed two possibilities: constituted material made from ground turquoise, or synthesis from appropriate starting materials. Possible carbon could point to epoxy. The report does not conclusively distinguish those possibilities.
Tested specimen: Bead strand, beads about 2.5–3 mm across, report completed April 3, 2023. This is an example of why appearance and color alone cannot establish treatment or manufacturing history. It does not show that high-grade turquoise in general is constituted.
View the original report
Select a page to enlarge it. Three pages; findings are summarized in accessible text above.
Use this guide alongside the written findings and the original report transcript. It explains the purpose of each analytical figure and preserves the laboratory’s own figure labels. The interpretations apply to the tested specimen; signals alone do not establish the identity of every similar-looking stone.
Electron microscope image: This view shows small-scale regions selected for analysis. Its brightness contrast helps distinguish regions with different compositions; it is not a photograph of their natural colors. Numbered spots connect this view to the analyses listed in the report.
Laboratory figure caption: Fig. 2 Backscattered electron image of an area of the specimen shown in Fig.1.
Elemental spectrum: The peaks record characteristic X-ray signals from elements in the analyzed spot or area. This is an analysis of that location, not automatically of the entire specimen. Any mineral identification or uncertainty named in the laboratory caption is retained below.
Laboratory figure caption: Fig. 3: Energy dispersive spectral analysis of spot 1 in Fig. 2 (aluminum phosphate with minor copper, looks like turquoise).
Element map: This map shows where the named elements occur within the analyzed area. Its colors represent the laboratory’s selected element channels, rather than the specimen’s visible colors. The caption below preserves any color key or distribution noted by the laboratory.
Laboratory figure caption: Fig. 4: X-ray map of aluminum (red) and iron (green). Note very uniform distribution of the elements.
Read the original laboratory report as text
The following text and tables are transcribed from the original laboratory document. Figure captions identify the report images; the laboratory interpretations and limitations are preserved.
Laboratory report 1
Analytical Result Report
Sample id: 92958 (turquoise bead strand)
Submitted by: K. Bitner
Date submitted: March 23, 2023.
Date completed: April 3, 2023.
Operating conditions: An AMRAY 1830 SEM operated at 25 kV acceleration potential, 26 mm working distance, 15 degrees sample tilt, coated with 250 Å carbon. Using the X-ray fluorescence attachment with 35 kV potential in conjunction with the EDS system.
A Bruker Titan X-ray fluorescence spectrometer was also used and operated with 50, 25 and 10 kV.
Fig. 1: Photograph of the specimen. Approximately 00.25-0.30 cm diameter of the beads.
11
Fig. 2 Backscattered electron image of an area of the specimen shown in Fig.1.
Fig. 3: Energy dispersive spectral analysis of spot 1 in Fig. 2 (aluminum phosphate with minor copper, looks like turquoise).
Fig. 4: X-ray map of aluminum (red) and iron (green). Note very uniform distribution of the elements.
Table 1: Minor and trace element composition of the dark blue area of the specimen. (in wt. %).
Laboratory data as recorded in the report
Element
Reported value
Aluminum
19.3
Calcium
0.05
Copper
2.0
Iron
0.4
Manganese
0.01
Phosphorus
13.2
Titanium
0.06
Summary of findings: This specimen is very interesting (Fig. 1). Compositionally, the beads consist of dominantly aluminum and phosphorus (Figs. 2 and 3, Table 1). The beads are very homogenous (Figs. 1 and 4). No irregularities or streaks of manganese or iron oxides are noted. Chemically, it has the correct elements, a little low on the copper than most turquoise but still in the range so it is chemically the correct material. As to naturally occurring as we see the beads now, I am skeptical. I think they have either been constituted from ground up turquoise, if not completely synthesized from the proper oxide. A little iron titanium etc. may suggest that natural turquoise was used. Another point is the presence of some carbon (Fig. 3) which could indicate presence of some epoxy to solidify the material.
Date: April 3, 2023 Signature
Blue Ice, also sold as Glacierite, reached the market as a purported natural discovery from Indonesia. Our testing raised a serious challenge to that description, and the vendor later confirmed to Soul Body Gems that the material was not naturally formed.
Laboratory finding: The sample was dominated by aluminum with lesser sodium and magnesium; some areas contained calcium and silicon. The dark blue region contained iron, nickel, and minor zinc and zirconium. A bubble-like void was observed. Preliminary X-ray diffraction suggested a material similar to dawsonite, but the researcher said more work was needed and described the first impression as man-made.
What “slag” means here: The material is commonly described in market discussions as industrial slag. The report and vendor confirmation support calling this piece manufactured rather than a naturally crystallized mineral, but the precise industrial source and process were not established by the report. We do not present the preliminary dawsonite resemblance as a final identification.
Report detail: Completed March 24, 2023. This document prints sample ID 92955, also printed on a different Tanzania feldspar report; the specimen photographs, dates, and findings distinguish the documents. Both are reproduced as supplied.
View the original report
Select a page to enlarge it. Findings are summarized in accessible text above.
Use this guide alongside the written findings and the original report transcript. It explains the purpose of each analytical figure and preserves the laboratory’s own figure labels. The interpretations apply to the tested specimen; signals alone do not establish the identity of every similar-looking stone.
Electron microscope image: This view shows small-scale regions selected for analysis. Its brightness contrast helps distinguish regions with different compositions; it is not a photograph of their natural colors. Numbered spots connect this view to the analyses listed in the report.
Laboratory figure caption: Fig. 2 Backscattered electron image of an area of the specimen shown in Fig.1.
Elemental spectrum: The peaks record characteristic X-ray signals from elements in the analyzed spot or area. This is an analysis of that location, not automatically of the entire specimen. Any mineral identification or uncertainty named in the laboratory caption is retained below.
Laboratory figure caption: Fig. 3: Energy dispersive spectral analysis of spot 1 in Fig. 2 (high aluminum, high carbon material )
Elemental spectrum: The peaks record characteristic X-ray signals from elements in the analyzed spot or area. This is an analysis of that location, not automatically of the entire specimen. Any mineral identification or uncertainty named in the laboratory caption is retained below.
Laboratory figure caption: Fig. 4: Energy dispersive spectral analysis of spot 6 in Fig. 2 (similar to Fig. 3 but with some silicon).
Electron microscope image: This view shows small-scale regions selected for analysis. Its brightness contrast helps distinguish regions with different compositions; it is not a photograph of their natural colors. Numbered spots connect this view to the analyses listed in the report.
Laboratory figure caption: Fig. 5 Backscattered electron image of an area of the specimen shown in Fig.1. Note bubble-like void.
Elemental spectrum: The peaks record characteristic X-ray signals from elements in the analyzed spot or area. This is an analysis of that location, not automatically of the entire specimen. Any mineral identification or uncertainty named in the laboratory caption is retained below.
Laboratory figure caption: Fig. 6: Energy dispersive spectral analysis of spot 2 in Fig. 5 (high aluminum compound with lesser silicon, sodium, calcium)
Element map: This map shows where the named elements occur within the analyzed area. Its colors represent the laboratory’s selected element channels, rather than the specimen’s visible colors. The caption below preserves any color key or distribution noted by the laboratory.
Laboratory figure caption: Fig. 7: X-ray map of the area shown in Fig. 2. Aluminum: red, silicon: blue, carbon: yellow.
Read the original laboratory report as text
The following text and tables are transcribed from the original laboratory document. Figure captions identify the report images; the laboratory interpretations and limitations are preserved.
Laboratory report 1
Analytical Result Report
Sample id: 92955
Submitted by: K. Bitner
Date submitted: March 23, 2023.
Date completed: March 24, 2023.
Operating conditions: An AMRAY 1830 SEM operated at 25 kV acceleration potential, 26 mm working distance, 15 degrees sample tilt, coated with 250 Å carbon. Using the X-ray fluorescence attachment with 35 kV potential in conjunction with the EDS system.
A Bruker Titan X-ray fluorescence spectrometer was also used and operated with 50, 25 and 10 kV.
Fig. 1: Photograph of the specimen. Approximately 9.5 cm maximum dimension
Fig. 2 Backscattered electron image of an area of the specimen shown in Fig.1.
Fig. 3: Energy dispersive spectral analysis of spot 1 in Fig. 2 (high aluminum, high carbon material )
Fig. 4: Energy dispersive spectral analysis of spot 6 in Fig. 2 (similar to Fig. 3 but with some silicon).
.
Fig. 5 Backscattered electron image of an area of the specimen shown in Fig.1. Note bubble-like void.
Fig. 6: Energy dispersive spectral analysis of spot 2 in Fig. 5 (high aluminum compound with lesser silicon, sodium, calcium)
Fig. 7: X-ray map of the area shown in Fig. 2. Aluminum: red, silicon: blue, carbon: yellow.
Table 1: Minor and trace element composition of the dark blue area of the specimen. (in wt. %).
Laboratory data as recorded in the report
Element
Reported value
Calcium
3.2
Iron
1.0
Nickel
0.7
Zinc
0.3
Zirconium
0.2
Summary of findings: This specimen is very interesting (Fig. 1). The bulk composition is dominated by aluminum with lesser sodium and magnesium (Figs. 2-4). Locally, calcium and silicon are present (Figs. 5 and 6). The dark blue colored area contains iron, nickel, and minor zinc and zirconium (Table 1). A first attempt with X-ray diffraction suggests a material similar to dawsonite which is a sodium aluminum hydroxyl carbonate. There is some more work needed an this specimen but the first impression is that it is man-made.
Date: March, 24, 2023 Signature
Blue Ice, also sold as Glacierite, reached the market as a purported natural discovery from Indonesia. Our testing raised a serious challenge to that description, and the vendor later confirmed to Soul Body Gems that the material was not naturally formed.
Laboratory finding: The sample was dominated by aluminum with lesser sodium and magnesium; some areas contained calcium and silicon. The dark blue region contained iron, nickel, and minor zinc and zirconium. A bubble-like void was observed. Preliminary X-ray diffraction suggested a material similar to dawsonite, but the researcher said more work was needed and described the first impression as man-made.
What “slag” means here: The material is commonly described in market discussions as industrial slag. The report and vendor confirmation support calling this piece manufactured rather than a naturally crystallized mineral, but the precise industrial source and process were not established by the report. We do not present the preliminary dawsonite resemblance as a final identification.
Report detail: Completed March 24, 2023. This document prints sample ID 92955, also printed on a different Tanzania feldspar report; the specimen photographs, dates, and findings distinguish the documents. Both are reproduced as supplied.
View the original report
Select a page to enlarge it. Findings are summarized in accessible text above.
Use this guide alongside the written findings and the original report transcript. It explains the purpose of each analytical figure and preserves the laboratory’s own figure labels. The interpretations apply to the tested specimen; signals alone do not establish the identity of every similar-looking stone.
Electron microscope image: This view shows small-scale regions selected for analysis. Its brightness contrast helps distinguish regions with different compositions; it is not a photograph of their natural colors. Numbered spots connect this view to the analyses listed in the report.
Laboratory figure caption: Fig. 2 Backscattered electron image of an area of the specimen shown in Fig.1.
Elemental spectrum: The peaks record characteristic X-ray signals from elements in the analyzed spot or area. This is an analysis of that location, not automatically of the entire specimen. Any mineral identification or uncertainty named in the laboratory caption is retained below.
Laboratory figure caption: Fig. 3: Energy dispersive spectral analysis of spot 1 in Fig. 2 (high aluminum, high carbon material )
Elemental spectrum: The peaks record characteristic X-ray signals from elements in the analyzed spot or area. This is an analysis of that location, not automatically of the entire specimen. Any mineral identification or uncertainty named in the laboratory caption is retained below.
Laboratory figure caption: Fig. 4: Energy dispersive spectral analysis of spot 6 in Fig. 2 (similar to Fig. 3 but with some silicon).
Electron microscope image: This view shows small-scale regions selected for analysis. Its brightness contrast helps distinguish regions with different compositions; it is not a photograph of their natural colors. Numbered spots connect this view to the analyses listed in the report.
Laboratory figure caption: Fig. 5 Backscattered electron image of an area of the specimen shown in Fig.1. Note bubble-like void.
Elemental spectrum: The peaks record characteristic X-ray signals from elements in the analyzed spot or area. This is an analysis of that location, not automatically of the entire specimen. Any mineral identification or uncertainty named in the laboratory caption is retained below.
Laboratory figure caption: Fig. 6: Energy dispersive spectral analysis of spot 2 in Fig. 5 (high aluminum compound with lesser silicon, sodium, calcium)
Element map: This map shows where the named elements occur within the analyzed area. Its colors represent the laboratory’s selected element channels, rather than the specimen’s visible colors. The caption below preserves any color key or distribution noted by the laboratory.
Laboratory figure caption: Fig. 7: X-ray map of the area shown in Fig. 2. Aluminum: red, silicon: blue, carbon: yellow.
Read the original laboratory report as text
The following text and tables are transcribed from the original laboratory document. Figure captions identify the report images; the laboratory interpretations and limitations are preserved.
Laboratory report 1
Analytical Result Report
Sample id: 92955
Submitted by: K. Bitner
Date submitted: March 23, 2023.
Date completed: March 24, 2023.
Operating conditions: An AMRAY 1830 SEM operated at 25 kV acceleration potential, 26 mm working distance, 15 degrees sample tilt, coated with 250 Å carbon. Using the X-ray fluorescence attachment with 35 kV potential in conjunction with the EDS system.
A Bruker Titan X-ray fluorescence spectrometer was also used and operated with 50, 25 and 10 kV.
Fig. 1: Photograph of the specimen. Approximately 9.5 cm maximum dimension
Fig. 2 Backscattered electron image of an area of the specimen shown in Fig.1.
Fig. 3: Energy dispersive spectral analysis of spot 1 in Fig. 2 (high aluminum, high carbon material )
Fig. 4: Energy dispersive spectral analysis of spot 6 in Fig. 2 (similar to Fig. 3 but with some silicon).
.
Fig. 5 Backscattered electron image of an area of the specimen shown in Fig.1. Note bubble-like void.
Fig. 6: Energy dispersive spectral analysis of spot 2 in Fig. 5 (high aluminum compound with lesser silicon, sodium, calcium)
Fig. 7: X-ray map of the area shown in Fig. 2. Aluminum: red, silicon: blue, carbon: yellow.
Table 1: Minor and trace element composition of the dark blue area of the specimen. (in wt. %).
Laboratory data as recorded in the report
Element
Reported value
Calcium
3.2
Iron
1.0
Nickel
0.7
Zinc
0.3
Zirconium
0.2
Summary of findings: This specimen is very interesting (Fig. 1). The bulk composition is dominated by aluminum with lesser sodium and magnesium (Figs. 2-4). Locally, calcium and silicon are present (Figs. 5 and 6). The dark blue colored area contains iron, nickel, and minor zinc and zirconium (Table 1). A first attempt with X-ray diffraction suggests a material similar to dawsonite which is a sodium aluminum hydroxyl carbonate. There is some more work needed an this specimen but the first impression is that it is man-made.
Date: March, 24, 2023 Signature
Periwinkle Quartz was sold with a pale lavender color often attributed online to dumortierite. The tested necklace tells a more specific story.
Finding: The beads are quartz. The researcher saw abundant veils of tiny inclusions but no visible fibers of the kind sometimes attributed to dumortierite. One small blue inclusion could not be identified. Purple elastic string used to thread the beads added to the apparent color.
Interpretation: This result does not establish dumortierite as the source of color in this strand. It also does not rule out dumortierite in every quartz item sold under the same market name. The report lists possible hydrothermal-vein or granitic-pegmatite origin without proving a locality.
Tested specimen: Necklace with beads about 6 mm diameter, sample 92956; report completed March 28, 2023.
View the original report
Select a page to enlarge it. Findings are summarized in accessible text above.
Use this guide alongside the written findings and the original report transcript. It explains the purpose of each analytical figure and preserves the laboratory’s own figure labels. The interpretations apply to the tested specimen; signals alone do not establish the identity of every similar-looking stone.
Electron microscope image: This view shows small-scale regions selected for analysis. Its brightness contrast helps distinguish regions with different compositions; it is not a photograph of their natural colors. Numbered spots connect this view to the analyses listed in the report.
Laboratory figure caption: Fig. 2 Backscattered electron image of an area of the specimen shown in Fig.1.
Elemental spectrum: The peaks record characteristic X-ray signals from elements in the analyzed spot or area. This is an analysis of that location, not automatically of the entire specimen. Any mineral identification or uncertainty named in the laboratory caption is retained below.
Laboratory figure caption: Fig. 3: Energy dispersive spectral analysis of spot 1 in Fig. 2 (quartz )
Read the original laboratory report as text
The following text and tables are transcribed from the original laboratory document. Figure captions identify the report images; the laboratory interpretations and limitations are preserved.
Laboratory report 1
Analytical Result Report
Sample id: 92956 (necklace)
Submitted by: K. Bitner
Date submitted: March 23, 2023.
Date completed: March 28, 2023.
Operating conditions: An AMRAY 1830 SEM operated at 25 kV acceleration potential, 26 mm working distance, 15 degrees sample tilt, coated with 250 Å carbon. Using the X-ray fluorescence attachment with 35 kV potential in conjunction with the EDS system.
A Bruker Titan X-ray fluorescence spectrometer was also used and operated with 50, 25 and 10 kV.
Fig. 1: Photograph of the specimen. Approximately 0.6 cm dianeter of the beads.
11
Fig. 2 Backscattered electron image of an area of the specimen shown in Fig.1.
Fig. 3: Energy dispersive spectral analysis of spot 1 in Fig. 2 (quartz )
Fig. 4: sevgeral photomicrographs taken in transmitted light. Note lots of veils of tiny fluid and other inclusions. The middle photo shoows an unidentified blue inclusion (arrow).
Table 1: Minor and trace element composition of the dark blue area of the specimen. (in wt. %).
Laboratory data as recorded in the report
Element
Reported value
Aluminum
0.24
Calcium
0.02
Iron
0.05
Magnesium
0.05
Manganese
0.03
Titanium
0.03
Summary of findings: This specimen is very interesting (Fig. 1). The beads are largely turbid with some small clearer areas. The color is more of a pale purple than pink. Compositionally, the beads are quartz (Figs. 2 and 3). Trace and minor elements are all normal for quartz (Table 1). Microscopically, no fibers were seen; dumortierite fibers can sometimes be resolved in rose quartz. The interior is rich in veils of tiny inclusions (Fig. 4). A small blue inclusion was noted but could not be further identified. A purple elastic string was employed in stringing the beads which imparts additional color! The origin of this material may have come from a hydrothermal vein deposit or a granitic pegmatite.
Iolite Sunstone (Tanzania) sterling silver rings · October 2025 collection. These rings are separate from the tested specimens.
Earlier tested specimens
The reddish flash in this Tanzanian iolite material prompted laboratory investigation of the minerals behind the effect.
Finding: Both greenish and blue areas are cordierite (iolite). White areas are quartz. Small accessory grains include titanian magnetite and chlorapatite. A reddish flaky mineral was extracted and identified as hematite, accounting for the reddish flash.
The report suggests slight differences in iron oxidation state may contribute to greenish versus bluish appearance, but it does not find a major compositional difference between those cordierite regions. “Sunstone” is a market description of the sparkle here; it does not make this a feldspar sunstone.
Tested specimen: Sample 92961, approximately 3.5 cm; report completed April 12, 2023. Tanzania is the supplied locality.
Report 1 · April 12, 2023
Select a page to enlarge it. 7 pages with an accessible findings summary above.
Cordierite (iolite) with titanian magnetite and thin red hematite platelets producing a sunstone-like shimmer. The shimmering host is cordierite rather than feldspar.
This second report concerns a separate approximately 30 mm specimen. It supplements sample 92961 dated April 12, 2023.
Use this guide alongside the written findings and the original report transcript. It explains the purpose of each analytical figure and preserves the laboratory’s own figure labels. The interpretations apply to the tested specimen; signals alone do not establish the identity of every similar-looking stone.
Electron microscope image: This view shows small-scale regions selected for analysis. Its brightness contrast helps distinguish regions with different compositions; it is not a photograph of their natural colors. Numbered spots connect this view to the analyses listed in the report.
Laboratory figure caption: Fig.2: Backscattered electron image of an area of the specimen.
Elemental spectrum: The peaks record characteristic X-ray signals from elements in the analyzed spot or area. This is an analysis of that location, not automatically of the entire specimen. Any mineral identification or uncertainty named in the laboratory caption is retained below.
Laboratory figure caption: Fig. 3: Energy dispersive spectrum of spot 1 in Fig. 2 (cordierite)
Elemental spectrum: The peaks record characteristic X-ray signals from elements in the analyzed spot or area. This is an analysis of that location, not automatically of the entire specimen. Any mineral identification or uncertainty named in the laboratory caption is retained below.
Laboratory figure caption: Fig. 4: Energy dispersive spectrum of spot 2 in Fig. 2 (titanian magnetite)
Electron microscope image: This view shows small-scale regions selected for analysis. Its brightness contrast helps distinguish regions with different compositions; it is not a photograph of their natural colors. Numbered spots connect this view to the analyses listed in the report.
Laboratory figure caption: Fig. 5: Backscattered electron image of another area in the specimen.
Elemental spectrum: The peaks record characteristic X-ray signals from elements in the analyzed spot or area. This is an analysis of that location, not automatically of the entire specimen. Any mineral identification or uncertainty named in the laboratory caption is retained below.
Laboratory figure caption: Fig. 6: Energy dispersive spectrum of spot 5 in Fig. 5 (hematite)
Read the second report transcript
Analytical Result Report
Sample id: 1065 (#3, iolite/sunstone spheres)
Submitted by: Soul Body Gems
Date completed: 9-20-2024
Operating conditions: An AMRAY 1830 SEM operated at 25 kV acceleration potential, 24 mm working distance, 0
degrees sample tilt, coated with 250 Å carbon, and also using the attached XRF unit operated at 30 kV.


Fig. 1:  Photograph of the specimen.  Approximately 30 mm maximum dimension.


Fig.2: Backscattered electron image of an area of the specimen.


Fig. 3: Energy dispersive spectrum of spot 1 in Fig. 2 (cordierite)


Fig. 4: Energy dispersive spectrum of spot 2 in Fig. 2 (titanian magnetite)


Fig. 5: Backscattered electron image of another area in the specimen.


Fig. 6: Energy dispersive spectrum of spot 5 in Fig. 5 (hematite)


Fig. 7: Photomicrograph of the red inclusions in the specimen.


)
Summary of findings:  This specimen (Fig. 1) is very pretty.  It is essentially cordierite (iolite) (Figs. 2 and 3).  Some
titanian magnetite  (Figs. 2 and 4) inclusions are present and thin, red hematite platelets (Figs. 5-7 are present.  These
red hematite platelets prioduce an effect like that in sunstone but in this case, the cordierite is the matrix instead of
feldspar like in the typical sandstone.  The appearance is very similar except it is a different mineral that is the host for
the hematite.  Very pretty and unusual.
Date:    9-20-2024                      Signature
Maligano Jasper is a distinctive market name associated with material supplied from Indonesia. The tested mineral assembly differs from what the word “jasper” might imply.
Finding: This specimen has a white-to-tan magnesite matrix cut by veins made predominantly of dolomite, with minor pyrite. X-ray diffraction was used to confirm magnesite rather than hydromagnesite or another magnesium-bearing phase. The report does not identify it as quartz-rich jasper.
The researcher suggested the material may reflect low-temperature metamorphic effects on ultramafic rocks; that geological history is a possibility, not a proven origin for all material sold under the name.
Tested specimen: Sample 92962 (#5), approximately 5.5 cm across; report completed April 13, 2023. Indonesia is the supplied locality, not a mine of origin established by the analysis.
View the original report
Select a page to enlarge it. 5 pages with an accessible findings summary above.
Use this guide alongside the written findings and the original report transcript. It explains the purpose of each analytical figure and preserves the laboratory’s own figure labels. The interpretations apply to the tested specimen; signals alone do not establish the identity of every similar-looking stone.
Electron microscope image: This view shows small-scale regions selected for analysis. Its brightness contrast helps distinguish regions with different compositions; it is not a photograph of their natural colors. Numbered spots connect this view to the analyses listed in the report.
Laboratory figure caption: Fig. 2 Backscattered electron image of an area of the specimen shown in Fig.1.
Elemental spectrum: The peaks record characteristic X-ray signals from elements in the analyzed spot or area. This is an analysis of that location, not automatically of the entire specimen. Any mineral identification or uncertainty named in the laboratory caption is retained below.
Laboratory figure caption: Fig. 3: Energy dispersive spectral analysis of spot 1 in Fig. 2. (magnesite?).
Elemental spectrum: The peaks record characteristic X-ray signals from elements in the analyzed spot or area. This is an analysis of that location, not automatically of the entire specimen. Any mineral identification or uncertainty named in the laboratory caption is retained below.
Laboratory figure caption: Fig. 4: Energy dispersive spectral analysis of spot 2 in Fig. 2. (magnesite?).
Elemental spectrum: The peaks record characteristic X-ray signals from elements in the analyzed spot or area. This is an analysis of that location, not automatically of the entire specimen. Any mineral identification or uncertainty named in the laboratory caption is retained below.
Laboratory figure caption: Fig. 5: Energy dispersive spectral analysis of spot 3 in Fig. 2. (dolomite).
Elemental spectrum: The peaks record characteristic X-ray signals from elements in the analyzed spot or area. This is an analysis of that location, not automatically of the entire specimen. Any mineral identification or uncertainty named in the laboratory caption is retained below.
Laboratory figure caption: Fig. 6: Energy dispersive spectral analysis of spot 4 in Fig. 2. (pyrite).
Diffraction scan: This scan helps identify crystalline minerals by comparing the measured pattern with reference patterns. The laboratory interpretation explains which minerals the comparison supports.
Laboratory figure caption: Fig. 7: X-ray diffraction scan of the high-magnesium material
Element map: This map shows where the named elements occur within the analyzed area. Its colors represent the laboratory’s selected element channels, rather than the specimen’s visible colors. The caption below preserves any color key or distribution noted by the laboratory.
Laboratory figure caption: Fig. 8: X-ray map of magnesium (red), calcium (blue), iron (green).
Read the original laboratory report as text
The following text and tables are transcribed from the original laboratory document. Figure captions identify the report images; the laboratory interpretations and limitations are preserved.
Laboratory report 1
Analytical Result Report
Sample id: 92962 (#5)
Submitted by: K. Bitner
Date submitted: March 23, 2023.
Date completed: April 13, 2023.
Operating conditions: An AMRAY 1830 SEM operated at 25 kV acceleration potential, 26 mm working distance, 15 degrees sample tilt, coated with 250 Å carbon. Using the X-ray fluorescence attachment with 35 kV potential in conjunction with the EDS system.
A Bruker Titan X-ray fluorescence spectrometer was also used and operated with 50, 25 and 10 kV.
A Bruker D2 Phser X-ray diffractometer was used and operated at 30 kV voltage and 10 mA current.
Fig. 1: Photograph of the specimen. Approximately 5.5 cm across.
Fig. 2 Backscattered electron image of an area of the specimen shown in Fig.1.
Fig. 3: Energy dispersive spectral analysis of spot 1 in Fig. 2. (magnesite?).
Fig. 4: Energy dispersive spectral analysis of spot 2 in Fig. 2. (magnesite?).
Fig. 5: Energy dispersive spectral analysis of spot 3 in Fig. 2. (dolomite).
Fig. 6: Energy dispersive spectral analysis of spot 4 in Fig. 2. (pyrite).
Fig. 7: X-ray diffraction scan of the high-magnesium material
Fig. 8: X-ray map of magnesium (red), calcium (blue), iron (green).
Table 1: Minor and trace element composition of the high- magnesium area of the specimen. (in wt. %).
Laboratory data as recorded in the report
Element
Reported value
Calcium
0.40
Iron
0.21
Manganese
0.01
Sulfur
0.01
Titanium
0.02
Summary:
This is a very interesting specimen (Fig. 1). The specimen is composed of a white to tan matrix with some veins cutting through. The tan to white material is magnesite (Figs. 2,3, 4, 7 and 8), the veins are made up of dominantly dolomite *Figs. 2 and 5) with minor pyrite (Figs. 2 and 6). The magnesite is chemically pretty clean (table 1). This is material that may stem from low temperature metamorphic effects on ultramafic rocks. The X-ray diffraction scan was run to make certain the magnesium species is indeed magnesite and not hydromagnesite or others.
Aquamarine India SS Pendants · Soul Body Gems, June 2024.
A gray specimen supplied from India was sent for testing under a beryl identification. The report supports beryl, while the aquamarine label needs a separate color qualification.
Finding: The aluminum-to-silicon ratio, measured density of 2.72 g/cm³, and uniaxial negative optical character were consistent with beryl. The researcher specifically noted its unusual gray color. Iron, magnesium, and sodium were reported as minor components.
Why the names differ: Aquamarine is the blue to blue-green gem variety of beryl. This report establishes beryl in this gray sample; it does not describe it as blue aquamarine. The India locality is supplied provenance rather than a result of the analysis.
Tested specimen: Sample 92905 (#5), approximately 3 cm; report completed April 20, 2022. One figure caption appears inconsistent with the report’s beryl conclusion; the original pages are shown without alteration to that text.
View the original report
Select a page to enlarge it. Two pages; findings are summarized in accessible text above.
Also searchable under Aquamarine (India) with the color distinction explained.
Understanding the report figures
Use this guide alongside the written findings and the original report transcript. It explains the purpose of each analytical figure and preserves the laboratory’s own figure labels. The interpretations apply to the tested specimen; signals alone do not establish the identity of every similar-looking stone.
Electron microscope image: This view shows small-scale regions selected for analysis. Its brightness contrast helps distinguish regions with different compositions; it is not a photograph of their natural colors. Numbered spots connect this view to the analyses listed in the report.
Laboratory figure caption: Fig. 2: Backscattered electron image of an area of the specimen.
Elemental spectrum: The peaks record characteristic X-ray signals from elements in the analyzed spot or area. This is an analysis of that location, not automatically of the entire specimen. Any mineral identification or uncertainty named in the laboratory caption is retained below.
Laboratory figure caption: Fig. 3: Energy dispersive spectral analysis of spot 1 in Fig. 2 (silia-rich rhyolitic rock)
Elemental spectrum: The peaks record characteristic X-ray signals from elements in the analyzed spot or area. This is an analysis of that location, not automatically of the entire specimen. Any mineral identification or uncertainty named in the laboratory caption is retained below.
Laboratory figure caption: Fig. 4: Energy dispersive spectral analysis of spot 2 in Fig. 2)
Read the original laboratory report as text
The following text and tables are transcribed from the original laboratory document. Figure captions identify the report images; the laboratory interpretations and limitations are preserved.
Laboratory report 1
Analytical Result Report
Sample id: 92905 (#5) ‘beryl’
Submitted by: K. Bitner
Date submitted: April 4, 2022.
Date completed: April 20, 2022.
Operating conditions: An AMRAY 1830 SEM operated at 25 kV acceleration potential, 26 mm working distance, 15 degrees sample tilt, coated with 250 Å carbon. Using the X-ray fluorescence attachment with 35 kV potential in conjunction with the EDS system.
Fig. 1: Photograph of the specimen. 3 cm maximum dimensions.
Fig. 2: Backscattered electron image of an area of the specimen.
Fig. 3: Energy dispersive spectral analysis of spot 1 in Fig. 2 (silia-rich rhyolitic rock)
Fig. 4: Energy dispersive spectral analysis of spot 2 in Fig. 2)
Table 1: Minor and trace element composition of the specimen. (in wt. %).
Laboratory data as recorded in the report
Element
Reported value
Iron
0.65
Magnesium
0.55
Manganese
0.03
Sodium
0.51
Titanium
0.01
Summary of findings: This specimen (Fig. 1) is a very interesting one. Chemically, it is an aluminum silicate (Figs. 2 and 3) with the aluminum:silicon ratio at 1:3. The specimen contains some magnesium and sodium plus iron as main minor components. The density was determined to be 2.72 g/cm3 and optically it is uniaxial negative. This is all consistent with beryl. It is a little unusual for its gray color.
A gray specimen supplied from India was sent for testing under a beryl identification. The report supports beryl, while the aquamarine label needs a separate color qualification.
Finding: The aluminum-to-silicon ratio, measured density of 2.72 g/cm³, and uniaxial negative optical character were consistent with beryl. The researcher specifically noted its unusual gray color. Iron, magnesium, and sodium were reported as minor components.
Why the names differ: Aquamarine is the blue to blue-green gem variety of beryl. This report establishes beryl in this gray sample; it does not describe it as blue aquamarine. The India locality is supplied provenance rather than a result of the analysis.
Tested specimen: Sample 92905 (#5), approximately 3 cm; report completed April 20, 2022. One figure caption appears inconsistent with the report’s beryl conclusion; the original pages are shown without alteration to that text.
View the original report
Select a page to enlarge it. Two pages; findings are summarized in accessible text above.
Use this guide alongside the written findings and the original report transcript. It explains the purpose of each analytical figure and preserves the laboratory’s own figure labels. The interpretations apply to the tested specimen; signals alone do not establish the identity of every similar-looking stone.
Electron microscope image: This view shows small-scale regions selected for analysis. Its brightness contrast helps distinguish regions with different compositions; it is not a photograph of their natural colors. Numbered spots connect this view to the analyses listed in the report.
Laboratory figure caption: Fig. 2: Backscattered electron image of an area of the specimen.
Elemental spectrum: The peaks record characteristic X-ray signals from elements in the analyzed spot or area. This is an analysis of that location, not automatically of the entire specimen. Any mineral identification or uncertainty named in the laboratory caption is retained below.
Laboratory figure caption: Fig. 3: Energy dispersive spectral analysis of spot 1 in Fig. 2 (silia-rich rhyolitic rock)
Elemental spectrum: The peaks record characteristic X-ray signals from elements in the analyzed spot or area. This is an analysis of that location, not automatically of the entire specimen. Any mineral identification or uncertainty named in the laboratory caption is retained below.
Laboratory figure caption: Fig. 4: Energy dispersive spectral analysis of spot 2 in Fig. 2)
Read the original laboratory report as text
The following text and tables are transcribed from the original laboratory document. Figure captions identify the report images; the laboratory interpretations and limitations are preserved.
Laboratory report 1
Analytical Result Report
Sample id: 92905 (#5) ‘beryl’
Submitted by: K. Bitner
Date submitted: April 4, 2022.
Date completed: April 20, 2022.
Operating conditions: An AMRAY 1830 SEM operated at 25 kV acceleration potential, 26 mm working distance, 15 degrees sample tilt, coated with 250 Å carbon. Using the X-ray fluorescence attachment with 35 kV potential in conjunction with the EDS system.
Fig. 1: Photograph of the specimen. 3 cm maximum dimensions.
Fig. 2: Backscattered electron image of an area of the specimen.
Fig. 3: Energy dispersive spectral analysis of spot 1 in Fig. 2 (silia-rich rhyolitic rock)
Fig. 4: Energy dispersive spectral analysis of spot 2 in Fig. 2)
Table 1: Minor and trace element composition of the specimen. (in wt. %).
Laboratory data as recorded in the report
Element
Reported value
Iron
0.65
Magnesium
0.55
Manganese
0.03
Sodium
0.51
Titanium
0.01
Summary of findings: This specimen (Fig. 1) is a very interesting one. Chemically, it is an aluminum silicate (Figs. 2 and 3) with the aluminum:silicon ratio at 1:3. The specimen contains some magnesium and sodium plus iron as main minor components. The density was determined to be 2.72 g/cm3 and optically it is uniaxial negative. This is all consistent with beryl. It is a little unusual for its gray color.
Date: April 20, 2022 Signature
A green material supplied from Brazil and sold as emerald was identified as chromium-bearing muscovite, often called fuchsite. Green muscovite also occurs in other parts of the world.
Finding: Sample 92960 (#7), reported April 2023, is principally muscovite with chromium; the study also described titanian magnetite, quartz and ilmenite. It is not emerald or another beryl variety.
Compare the second specimen: A similar looking Brazilian green mica submitted separately was identified as sodium-rich paragonite. Color and a market label alone do not establish which mica is present. Brazil is the supplied locality, not a conclusion of the laboratory analysis.
View the original report
Select a page to enlarge it. 4 pages; findings are summarized in accessible text above.
Use this guide alongside the written findings and the original report transcript. It explains the purpose of each analytical figure and preserves the laboratory’s own figure labels. The interpretations apply to the tested specimen; signals alone do not establish the identity of every similar-looking stone.
Electron microscope image: This view shows small-scale regions selected for analysis. Its brightness contrast helps distinguish regions with different compositions; it is not a photograph of their natural colors. Numbered spots connect this view to the analyses listed in the report.
Laboratory figure caption: Fig. 2 Backscattered electron image of an area of the specimen shown in Fig.1.
Elemental spectrum: The peaks record characteristic X-ray signals from elements in the analyzed spot or area. This is an analysis of that location, not automatically of the entire specimen. Any mineral identification or uncertainty named in the laboratory caption is retained below.
Laboratory figure caption: Fig. 3: Energy dispersive spectral analysis of spot 1 in Fig. 2 (chromian muscovite).
Elemental spectrum: The peaks record characteristic X-ray signals from elements in the analyzed spot or area. This is an analysis of that location, not automatically of the entire specimen. Any mineral identification or uncertainty named in the laboratory caption is retained below.
Laboratory figure caption: Fig. 4: Energy dispersive spectral analysis of spot 3 in Fig. 2 (titanian magnetite).
Elemental spectrum: The peaks record characteristic X-ray signals from elements in the analyzed spot or area. This is an analysis of that location, not automatically of the entire specimen. Any mineral identification or uncertainty named in the laboratory caption is retained below.
Laboratory figure caption: Fig. 5: Energy dispersive spectral analysis of spot 1 in Fig. 2 (quartz).
Elemental spectrum: The peaks record characteristic X-ray signals from elements in the analyzed spot or area. This is an analysis of that location, not automatically of the entire specimen. Any mineral identification or uncertainty named in the laboratory caption is retained below.
Laboratory figure caption: Fig. 6: Energy dispersive spectral analysis of spot 1 in Fig. 2 (ilmenite with muscovite interference.
Element map: This map shows where the named elements occur within the analyzed area. Its colors represent the laboratory’s selected element channels, rather than the specimen’s visible colors. The caption below preserves any color key or distribution noted by the laboratory.
Laboratory figure caption: Fig. 7: X-ray map of iron (red), titanium (yellow) and chromium (green).
Read the original laboratory report as text
The following text and tables are transcribed from the original laboratory document. Figure captions identify the report images; the laboratory interpretations and limitations are preserved.
Laboratory report 1
Analytical Result Report
Sample id: 92960 (#7)
Submitted by: K. Bitner
Date submitted: March 23, 2023.
Date completed: April 9, 2023.
Operating conditions: An AMRAY 1830 SEM operated at 25 kV acceleration potential, 26 mm working distance, 15 degrees sample tilt, coated with 250 Å carbon. Using the X-ray fluorescence attachment with 35 kV potential in conjunction with the EDS system.
A Bruker Titan X-ray fluorescence spectrometer was also used and operated with 50, 25 and 10 kV.
A Bruker D2 Phser X-ray diffractometer was used and operated at 30 kV voltage and 10 mA current.
Fig. 1: Photograph of the specimen. Approximately 7 cm tall.
Fig. 2 Backscattered electron image of an area of the specimen shown in Fig.1.
Fig. 3: Energy dispersive spectral analysis of spot 1 in Fig. 2 (chromian muscovite).
Fig. 4: Energy dispersive spectral analysis of spot 3 in Fig. 2 (titanian magnetite).
Fig. 5: Energy dispersive spectral analysis of spot 1 in Fig. 2 (quartz).
Fig. 6: Energy dispersive spectral analysis of spot 1 in Fig. 2 (ilmenite with muscovite interference.
Fig. 7: X-ray map of iron (red), titanium (yellow) and chromium (green).
Table 1: Minor and trace element composition of the dark blue area of the specimen. (in wt. %).
Laboratory data as recorded in the report
Element
Reported value
Calcium
0.02
Chromium
0.58
Iron
2.81
Manganese
0.01
Titanium
1.52
Vanadium
0.11
Summary of findings: This specimen is very interesting (Fig. 1). The bulk of the specimen is a chromium-bearing muscovite (Figs. 2 and 3), essentially a fuchsite. Accessory species include titanian magnetite (Figs. 2 and 4), quartz (Figs. 2 and 5) and ilmenite (Figs. 2 and 6). The X-ray map shows the proximity of the titanium magnetite and ilmenite. A small amount of vanadium is also present (Table 1) which is common for chromium-bearing environments. The source of the chromium and vanadium is likely from altered mafic to ultramafic rock sources.
Date: April 9, 2023 Signature
A second green mica specimen supplied from Brazil and offered as emerald proved to be paragonite, a sodium-rich mica rather than emerald or muscovite.
Finding: Sample 92959 (#8), reported April 4, 2023, showed sodium-dominant mica chemistry, confirmed by X-ray diffraction as paragonite. Chromium and vanadium help explain the green color. The tested material was not beryl/emerald.
Why this matters: It resembles the green muscovite/fuchsite specimen in another Soul Body Gems report, yet the two samples have different mica identifications. The Brazil locality is supplied provenance, not a result of the mineral analysis.
View the original report
Select a page to enlarge it. 3 pages; findings are summarized in accessible text above.
Use this guide alongside the written findings and the original report transcript. It explains the purpose of each analytical figure and preserves the laboratory’s own figure labels. The interpretations apply to the tested specimen; signals alone do not establish the identity of every similar-looking stone.
Electron microscope image: This view shows small-scale regions selected for analysis. Its brightness contrast helps distinguish regions with different compositions; it is not a photograph of their natural colors. Numbered spots connect this view to the analyses listed in the report.
Laboratory figure caption: Fig. 2 Backscattered electron image of an area of the specimen shown in Fig.1.
Elemental spectrum: The peaks record characteristic X-ray signals from elements in the analyzed spot or area. This is an analysis of that location, not automatically of the entire specimen. Any mineral identification or uncertainty named in the laboratory caption is retained below.
Laboratory figure caption: Fig. 3: Energy dispersive spectral analysis of spot 1 in Fig. 2 (
Diffraction scan: This scan helps identify crystalline minerals by comparing the measured pattern with reference patterns. The laboratory interpretation explains which minerals the comparison supports.
Laboratory figure caption: Fig. 4: X-ray diffractionm scan of a sample of the material. Stick pattern overlayedshoowing that the main basal reflections fit paragonite.
Read the original laboratory report as text
The following text and tables are transcribed from the original laboratory document. Figure captions identify the report images; the laboratory interpretations and limitations are preserved.
Laboratory report 1
Analytical Result Report
Sample id: 92959 (sample 8, ‘emerald)
Submitted by: K. Bitner
Date submitted: March 23, 2023.
Date completed: April 4, 2023.
Operating conditions: An AMRAY 1830 SEM operated at 25 kV acceleration potential, 26 mm working distance, 15 degrees sample tilt, coated with 250 Å carbon. Using the X-ray fluorescence attachment with 35 kV potential in conjunction with the EDS system.
A Bruker Titan X-ray fluorescence spectrometer was also used and operated with 50, 25 and 10 kV.
A Bruker D2 Phser X-ray diffractometer was used and operated at 30 kV voltage and 10 mA current.
Fig. 1: Photograph of the specimen. Approximately 1.5 cm tall.
Fig. 2 Backscattered electron image of an area of the specimen shown in Fig.1.
Fig. 3: Energy dispersive spectral analysis of spot 1 in Fig. 2 (
Fig. 4: X-ray diffractionm scan of a sample of the material. Stick pattern overlayedshoowing that the main basal reflections fit paragonite.
Fig. 5: photomicrographs showing that the color is not uniform but is limited to the mica flakes.
Table 1: Minor and trace element composition of the dark blue area of the specimen. (in wt. %).
Laboratory data as recorded in the report
Element
Reported value
Calcium
0.4
Chromium
0.03
Iron
0.9
Potassium
0.8
Sodium
5.0
Titanium
0.1
Vanadium
0.03
Summary of findings: This specimen is very interesting (Fig. 1). The bulk is essentially a micaceous mineral with sodium dominant over potassium, thus it is a paragonite (Figs. 2 and 3). X-ray diffraction confirms that (Fig. 4). The sample was run as an oriented mount, thus the basal reflections are the dominant peaks, the others are greatly reduced in intensity. The green color is imparted to the specimen by a small amount of chromium and vanadium that is present in the specimen. It is NOT a beryl or an emerald!
Chrome Chalcedony Australia Tumbles · Soul Body Gems, December 2023.
An Australian specimen sold as chrome chalcedony was examined for its silica-rich makeup and the minerals associated with its color.
Finding: Sample 92918, reported September 2022, contains silica identified with quartz, cristobalite and tridymite in the analysis; the report also describes allophane and chromite. The researcher discussed alteration of possible volcanic material as an interpretation of its formation.
Australia is the supplied locality; this individual analysis does not establish a mine or prove that all chrome chalcedony has the same composition.
View the original report
Select a page to enlarge it. 5 pages; findings are summarized in accessible text above.
Use this guide alongside the written findings and the original report transcript. It explains the purpose of each analytical figure and preserves the laboratory’s own figure labels. The interpretations apply to the tested specimen; signals alone do not establish the identity of every similar-looking stone.
Electron microscope image: This view shows small-scale regions selected for analysis. Its brightness contrast helps distinguish regions with different compositions; it is not a photograph of their natural colors. Numbered spots connect this view to the analyses listed in the report.
Laboratory figure caption: Fig. 2: Backscattered electron image of an area of the specimen shown in Fig.1.
Elemental spectrum: The peaks record characteristic X-ray signals from elements in the analyzed spot or area. This is an analysis of that location, not automatically of the entire specimen. Any mineral identification or uncertainty named in the laboratory caption is retained below.
Laboratory figure caption: Fig. 3: Energy dispersive spectral analysis of spot 1 in Fig. 2 (quartz or other silica species)
Elemental spectrum: The peaks record characteristic X-ray signals from elements in the analyzed spot or area. This is an analysis of that location, not automatically of the entire specimen. Any mineral identification or uncertainty named in the laboratory caption is retained below.
Laboratory figure caption: Fig. 4: Energy dispersive spectral analysis of spot 2 in Fig. 2 (mixture of silica species plus allophane)
Electron microscope image: This view shows small-scale regions selected for analysis. Its brightness contrast helps distinguish regions with different compositions; it is not a photograph of their natural colors. Numbered spots connect this view to the analyses listed in the report.
Laboratory figure caption: Fig. 5: Backscattered electron image of another area of the specimen shown in Fig. 1.
Elemental spectrum: The peaks record characteristic X-ray signals from elements in the analyzed spot or area. This is an analysis of that location, not automatically of the entire specimen. Any mineral identification or uncertainty named in the laboratory caption is retained below.
Laboratory figure caption: Fig. 6: Energy dispersive spectral analysis of spot 1 in Fig. 5 (chromite).
Elemental spectrum: The peaks record characteristic X-ray signals from elements in the analyzed spot or area. This is an analysis of that location, not automatically of the entire specimen. Any mineral identification or uncertainty named in the laboratory caption is retained below.
Laboratory figure caption: Fig. 7: Energy dispersive spectral analysis of spot 2 in Fig. 5 (allophane).
Element map: This map shows where the named elements occur within the analyzed area. Its colors represent the laboratory’s selected element channels, rather than the specimen’s visible colors. The caption below preserves any color key or distribution noted by the laboratory.
Laboratory figure caption: Fig. 8: X-Ray map of the area shown in Fig. 2. Silicon: red, iron: green, aluminum: yellow. Note the bright gren speck in the right iamge where the chromite is.
Diffraction scan: This scan helps identify crystalline minerals by comparing the measured pattern with reference patterns. The laboratory interpretation explains which minerals the comparison supports.
Laboratory figure caption: Fig. 9: X-ray diffractogram of the material.
Read the original laboratory report as text
The following text and tables are transcribed from the original laboratory document. Figure captions identify the report images; the laboratory interpretations and limitations are preserved.
Laboratory report 1
Analytical Result Report
Sample id: 92918 (#7)
Submitted by: K. Bitner
Date submitted: July 14, 2022.
Date completed: September 7, 2022.
Operating conditions: An AMRAY 1830 SEM operated at 25 kV acceleration potential, 26 mm working distance, 15 degrees sample tilt, coated with 250 Å carbon. Using the X-ray fluorescence attachment with 35 kV potential in conjunction with the EDS system.
Fig. 1: Photograph of the specimen. Approximately 7 cm maximum.
Fig. 2: Backscattered electron image of an area of the specimen shown in Fig.1.
Fig. 3: Energy dispersive spectral analysis of spot 1 in Fig. 2 (quartz or other silica species)
Fig. 4: Energy dispersive spectral analysis of spot 2 in Fig. 2 (mixture of silica species plus allophane)
Fig. 5: Backscattered electron image of another area of the specimen shown in Fig. 1.
Fig. 6: Energy dispersive spectral analysis of spot 1 in Fig. 5 (chromite).
Fig. 7: Energy dispersive spectral analysis of spot 2 in Fig. 5 (allophane).
Fig. 8: X-Ray map of the area shown in Fig. 2. Silicon: red, iron: green, aluminum: yellow. Note the bright gren speck in the right iamge where the chromite is.
Fig. 9: X-ray diffractogram of the material.
Table 1: Minor and trace element composition of the specimen. (in wt. %).
Laboratory data as recorded in the report
Element
Reported value
Aluminum
2.7
Calcium
0.3
Chromium
0.3
Copper
0.1
Iron
0.9
Magnesium
0.2
Manganese
0.02
Nickel
0.1
Phosphorus
0.03
Potassium
0.1
Sulfur
0.2
Summary of findings: This specimen is interesting (Fig. 1). The material is composed dominantly of silica species (Figs. 2 and 3) plus a high aluminum silicate species (Figs. 2, 4, 5 and 7). Trace elements indicate a likely influence of a mafic source (Table 1: nickel, chromium, and magnesium content (Figs. 5 and 6). The X-ray diffraction scan indicates the likely presence of quartz plus cristobalite and tridymite. Allophane is typically amorphous and thus will not show up in the X-ray diffractogram. It appears the material formed as a result of weathering volcanic ash, it could have been a bimodal sequence of ash or flows. The silica in 3 is indicative of a formation from volcanic rocks either during eruption or later during weathering. Initially, opal may have formed which then began to crystallize, cristobalite is a common species to appear. Chalcedony is then formed and thus the low quartz begins to show up.
Fluorite in Calcite · Soul Body Gems, August 2024.
This striking specimen contains fluorite and calcite, with other minerals visible in the analytical study. Soul Body Gems observes a UV response in the calcite portion.
Finding: Sample 1501, completed December 5, 2025, was described as fluorite, calcite, quartz, calcic plagioclase and a calcium-rich pyribole. The report also labels an apatite analysis and illustrates graphic fluorite–quartz textures with elemental maps.
UV note: Soul Body Gems reports that the calcite is UV reactive. The supplied analytical report identifies minerals but does not itself document a fluorescence test; UV behavior can vary by specimen and lighting conditions.
View the original report
Select a page to enlarge it. 6 pages; findings are summarized in accessible text above.
Sample: 10670 (#6 ring). Completed: August 30, 2024.
Finding: The ring’s stone contains both calcite and fluorite. Both minerals have very low concentrations of substituting elements.
This ring was submitted as another example of the same material, according to Soul Body Gems records. Its approximately 2 cm stone was examined using electron microscopy, energy-dispersive spectra and an elemental map showing the calcite and fluorite areas.
These results are the property of Soul Body Gems, Alexander Falster, and the Maine Mineral & Gem Museum. Any mention requires full acknowledgment.
Understanding the report figures
Use this guide alongside the written findings and the original report transcript. It explains the purpose of each analytical figure and preserves the laboratory’s own figure labels. The interpretations apply to the tested specimen; signals alone do not establish the identity of every similar-looking stone.
Electron microscope image: This view shows small-scale regions selected for analysis. Its brightness contrast helps distinguish regions with different compositions; it is not a photograph of their natural colors. Numbered spots connect this view to the analyses listed in the report.
Laboratory figure caption: Fig.2: Backscattered electron image of an area of the specimen.
Elemental spectrum: The peaks record characteristic X-ray signals from elements in the analyzed spot or area. This is an analysis of that location, not automatically of the entire specimen. Any mineral identification or uncertainty named in the laboratory caption is retained below.
Laboratory figure caption: Fig. 3: Energy dispersive spectrum of spot 1 in Fig. 2 (calcite).
Elemental spectrum: The peaks record characteristic X-ray signals from elements in the analyzed spot or area. This is an analysis of that location, not automatically of the entire specimen. Any mineral identification or uncertainty named in the laboratory caption is retained below.
Laboratory figure caption: Fig. 4: Energy dispersive spectrum of spot 2 in Fig. 2 (fluorite).
Element map: This map shows where the named elements occur within the analyzed area. Its colors represent the laboratory’s selected element channels, rather than the specimen’s visible colors. The caption below preserves any color key or distribution noted by the laboratory.
Laboratory figure caption: Fig. 5: X-ray map of the area shown in Fig. 2: left: carbon: red,fluorine: green.
Read the ring report as text
Analytical Result Report
Sample id: 10670 (#6 ring)
Submitted by: Soul Body Gems
Date completed: 8-30-2024
Operating conditions: An AMRAY 1830 SEM operated at 25 kV acceleration potential, 24 mm working distance, 0 degrees sample tilt, coated with 250 Å carbon, and also using the attached XRF unit operated at 30 kV.
Fig. 1:  Photograph of the specimen.  The stone is about 2 cm in maximum dimension.
Fig.2: Backscattered electron image of an area of the specimen.
Fig. 3: Energy dispersive spectrum of spot 1 in Fig. 2 (calcite).
Fig. 4: Energy dispersive spectrum of spot 2 in Fig. 2 (fluorite).
Fig. 5: X-ray map of the area shown in Fig. 2: left: carbon: red,fluorine: green.
Table 1: Minor and trace elements in the calcite and fluorite, in wt. %.
Summary of findings:  This specimen (Fig. 1) has a stone composed of both calcite (Figs. 2, 3 and 5) and fluorite (Figs. 2, 4 and 5).  Both calcite and fluoritie are very low in substituting elements (Table 1)
Date:    August 30, 2024                      Signature
Table 1: Minor and trace elements, wt. %
Element
Calcite
Fluorite
Iron
0.07
0.03
Magnesium
0.45
0.25
Manganese
0.02
0.02
Zinc
0.03
0.03
An Indonesian material that Soul Body Gems obtained as raw stone, introduced to clients, and submitted for testing in 2020. “Magma Chalcedony” is its market name.
Finding: Sample 9148 (#5), completed July 16, 2020, showed orange quartz/chalcedony colored by arsenic sulfides identified as orpiment/realgar. The gray zones were mainly quartz with minor aluminum, calcium and sodium; the researcher suggested former plagioclase phenocrysts in volcanic rock followed by hydrothermal alteration.
Our history: Soul Body Gems recalls being first to obtain the raw material, sell it, and commission testing for the market. This is our account of sourcing history; the analytical report establishes the specimen findings, not a market-wide priority claim.
Handling: The report detects arsenic-bearing minerals in the orange areas. Avoid making dust or ingesting material, and wash hands after handling rough pieces.
View the original report
Select a page to enlarge it. 3 pages; findings are summarized in accessible text above.
Use this guide alongside the written findings and the original report transcript. It explains the purpose of each analytical figure and preserves the laboratory’s own figure labels. The interpretations apply to the tested specimen; signals alone do not establish the identity of every similar-looking stone.
Electron microscope image: This view shows small-scale regions selected for analysis. Its brightness contrast helps distinguish regions with different compositions; it is not a photograph of their natural colors. Numbered spots connect this view to the analyses listed in the report.
Elemental spectrum: The peaks record characteristic X-ray signals from elements in the analyzed spot or area. This is an analysis of that location, not automatically of the entire specimen. Any mineral identification or uncertainty named in the laboratory caption is retained below.
Laboratory figure caption: Fig. 2: Energy dispersive spectrum of spot 1 in Fig. 1. (quartz).
Elemental spectrum: The peaks record characteristic X-ray signals from elements in the analyzed spot or area. This is an analysis of that location, not automatically of the entire specimen. Any mineral identification or uncertainty named in the laboratory caption is retained below.
Laboratory figure caption: Fig. 3: Energy dispersive spectrum of spot 2 in Fig. 1. (orpiment/realgar).
Electron microscope image: This view shows small-scale regions selected for analysis. Its brightness contrast helps distinguish regions with different compositions; it is not a photograph of their natural colors. Numbered spots connect this view to the analyses listed in the report.
Laboratory figure caption: Fig. 4: Backscattered electron image (Indonesian stones, from the botryoidal surfaces from a cavity)
Elemental spectrum: The peaks record characteristic X-ray signals from elements in the analyzed spot or area. This is an analysis of that location, not automatically of the entire specimen. Any mineral identification or uncertainty named in the laboratory caption is retained below.
Laboratory figure caption: Fig. 5: Energy dispersive spectrum of spot 1 in Fig. 4. (quartz).
Electron microscope image: This view shows small-scale regions selected for analysis. Its brightness contrast helps distinguish regions with different compositions; it is not a photograph of their natural colors. Numbered spots connect this view to the analyses listed in the report.
Laboratory figure caption: Fig. 6: Backscattered electron image (Indonesian stones, from the gray area)
Elemental spectrum: The peaks record characteristic X-ray signals from elements in the analyzed spot or area. This is an analysis of that location, not automatically of the entire specimen. Any mineral identification or uncertainty named in the laboratory caption is retained below.
Laboratory figure caption: Fig. 7: Energy dispersive spectrum of spot 1 in Fig. 7. (quartz with possible indication of remnant plagioclase).
Read the original laboratory report as text
The following text and tables are transcribed from the original laboratory document. Figure captions identify the report images; the laboratory interpretations and limitations are preserved.
Laboratory report 1
Analytical Result Report
Sample id: 9148 (#5 Indonesian stones)
Submitted by: K. Bitner
Date submitted: July 13, 2020
Date completed: July 16, 2020
Operating conditions: JEOL JSM-6400 operated at 25 kV acceleration potential, 15 mm working distance, 15 degrees sample tilt, coated with 250 Å carbon. Using the X-ray fluorescence attachment with 35kv potental in conjunction with the EDS system.
Fig. 1: Backscattered electron image (Indonesian stones, orange area)
Fig. 2: Energy dispersive spectrum of spot 1 in Fig. 1. (quartz).
Fig. 3: Energy dispersive spectrum of spot 2 in Fig. 1. (orpiment/realgar).
Fig. 4: Backscattered electron image (Indonesian stones, from the botryoidal surfaces from a cavity)
Fig. 5: Energy dispersive spectrum of spot 1 in Fig. 4. (quartz).
Fig. 6: Backscattered electron image (Indonesian stones, from the gray area)
Fig. 7: Energy dispersive spectrum of spot 1 in Fig. 7. (quartz with possible indication of remnant plagioclase).
Summary of findings: This is really interesting! The orange areas are essentially quartz (chalcedony) (Figs. 1,2,4, and 5) with orpiment/realgar as coloring agents! (Figs 1 and 3). The gray areas are mainly quartz with minor aluminum, calcium and sodium. It appears that there were initially phenocrysts of plagioclase present (Figs. 6 and 7), likely in a volcanic rock that than underwent hydrothermal overprinting and deposition of a low temperature arsenic sulfide assemblage. XRF analyses of the gray area only indicates 79 ppm arsenic as well as 8500ppm iron, 4500 ppm potassium, 1 et. % calcium and 0.7 wt. % sodium.
The orange areas contain 1650 ppm arsenic, 4600 ppm iron and 250 ppm calcium.
Date: July 16 ,2020 Signature
A Brazilian specimen was examined to verify its identification. The report confirms rhodonite and records an apatite grain.
Finding: Sample 92900 (#12), report completed April 12, 2022, is rhodonite. An apatite grain was found in the examined area.
Locality: The researcher described it as a characteristic Brazilian specimen and considered Conselheiro Lafaiete, Minas Gerais, a likely source; the report does not independently prove a mine of origin.
Report note: The signature line carries an earlier date than the stated completion date. The original report pages are reproduced without altering that discrepancy.
View the original report
Select a page to enlarge it. 3 pages; the findings are summarized in text above.
Use this guide alongside the written findings and the original report transcript. It explains the purpose of each analytical figure and preserves the laboratory’s own figure labels. The interpretations apply to the tested specimen; signals alone do not establish the identity of every similar-looking stone.
Electron microscope image: This view shows small-scale regions selected for analysis. Its brightness contrast helps distinguish regions with different compositions; it is not a photograph of their natural colors. Numbered spots connect this view to the analyses listed in the report.
Laboratory figure caption: Fig. 2: Backscattered electron images of an area the specimen.
Elemental spectrum: The peaks record characteristic X-ray signals from elements in the analyzed spot or area. This is an analysis of that location, not automatically of the entire specimen. Any mineral identification or uncertainty named in the laboratory caption is retained below.
Laboratory figure caption: Fig. 3: Energy dispersive spectral analysis of spot 1 in Fig. 2 (left image). (rhodonite)
Elemental spectrum: The peaks record characteristic X-ray signals from elements in the analyzed spot or area. This is an analysis of that location, not automatically of the entire specimen. Any mineral identification or uncertainty named in the laboratory caption is retained below.
Laboratory figure caption: Fig. 3: Energy dispersive spectral analysis of spot 1 in Fig. 1 right image. (apatite)
Read the original laboratory report as text
The following text and tables are transcribed from the original laboratory document. Figure captions identify the report images; the laboratory interpretations and limitations are preserved.
Laboratory report 1
Analytical Result Report
Sample id: 92900 (#12)
Submitted by: K. Bitner
Date submitted: April 5, 2022.
Date completed: April 12, 2022.
Operating conditions: An AMRAY 1830 SEM operated at 25 kV acceleration potential, 26 mm working distance, 15 degrees sample tilt, coated with 250 Å carbon. Using the X-ray fluorescence attachment with 35 kV potential in conjunction with the EDS system.
Fig. 1: Photograph of the specimen. 6 cm maximum dimensions.
Fig. 2: Backscattered electron images of an area the specimen.
Fig. 3: Energy dispersive spectral analysis of spot 1 in Fig. 2 (left image). (rhodonite)
Fig. 3: Energy dispersive spectral analysis of spot 1 in Fig. 1 right image. (apatite)
Table 1: Minor and trace element composition of the specimen. (in wt. %).
Laboratory data as recorded in the report
Element
Reported value
Calcium
5.20
Iron
1.01
Magnesium
2.46
Titanium
0.01
Zinc
0.01
Summary of findings: This specimen (Fig. 1) is a very characteristic specimen from Brazil. It is Rhodonite (Figs. 2 and 3, Table 1). An apatite grain was found as well (Figs. 2 and 4). This material is very likely from the Conselheiro Lafaiete location in Minas Gerais which has produced some very fine material for some time now. In the late 1990s I got some of the early production from this location to evaluate.
Date: March 11, 2022 Signature
“Caramel Opal” is the market name for this stone supplied as Mexican material. The ring was tested to investigate its composition; the report does not conclusively establish opal.
Finding: Sample 92924 (#1, ring), completed July 18, 2022, is silica-rich with markedly variable aluminum content and banding. The researcher considered a silica-replaced volcanic rock as one possibility. Small voids contained carbon-rich material, likely epoxy.
Identification remains open: The report calls the aluminum pattern unusual for opal. Its UV response was poor, but that alone does not settle identification. Refractive index could not be measured in the ring setting; crystallinity testing would require a small powder sample. The surficial metal analysis was consistent with sterling silver.
Origin and availability: Mexico is the supplied locality. Soul Body Gems has encountered this material as an obscure Mexican trade material; this specimen report does not establish that it occurs nowhere else. The report's signature date differs from its stated completion date; the original is shown as received.
View the original report
Select a page to enlarge it. 4 pages; findings are summarized in accessible text above.
Use this guide alongside the written findings and the original report transcript. It explains the purpose of each analytical figure and preserves the laboratory’s own figure labels. The interpretations apply to the tested specimen; signals alone do not establish the identity of every similar-looking stone.
Electron microscope image: This view shows small-scale regions selected for analysis. Its brightness contrast helps distinguish regions with different compositions; it is not a photograph of their natural colors. Numbered spots connect this view to the analyses listed in the report.
Laboratory figure caption: Fig. 2: Backscattered electron image of an area of the specimen.
Elemental spectrum: The peaks record characteristic X-ray signals from elements in the analyzed spot or area. This is an analysis of that location, not automatically of the entire specimen. Any mineral identification or uncertainty named in the laboratory caption is retained below.
Laboratory figure caption: Fig. 3: Energy dispersive spectral analysis of spot 1 in Fig. 2 (High silica material with minor aluminum)
Elemental spectrum: The peaks record characteristic X-ray signals from elements in the analyzed spot or area. This is an analysis of that location, not automatically of the entire specimen. Any mineral identification or uncertainty named in the laboratory caption is retained below.
Laboratory figure caption: Fig. 4: Energy dispersive spectral analysis of spot 2 in Fig. 2 (high silica material with elevated aluminum)
Elemental spectrum: The peaks record characteristic X-ray signals from elements in the analyzed spot or area. This is an analysis of that location, not automatically of the entire specimen. Any mineral identification or uncertainty named in the laboratory caption is retained below.
Laboratory figure caption: Fig. 5: Energy dispersive spectral analysis of spot 3 in Fig. 2 (carbon-rich material – epoxy likely)
Element map: This map shows where the named elements occur within the analyzed area. Its colors represent the laboratory’s selected element channels, rather than the specimen’s visible colors. The caption below preserves any color key or distribution noted by the laboratory.
Laboratory figure caption: Fig. 6 X-ray map of the area shown in Fig. 2: Silicon: yellow, aluminum: red.
Read the original laboratory report as text
The following text and tables are transcribed from the original laboratory document. Figure captions identify the report images; the laboratory interpretations and limitations are preserved.
Laboratory report 1
Analytical Result Report
Sample id: 92924 (#1, ring)
Submitted by: K. Bitner
Date submitted: July 14, 2022.
Date completed: July 18, 2022.
Operating conditions: An AMRAY 1830 SEM operated at 25 kV acceleration potential, 26 mm working distance, 15 degrees sample tilt, coated with 250 Å carbon. Using the X-ray fluorescence attachment with 35 kV potential in conjunction with the EDS system.
Fig. 1: Photograph of the specimen. 4.5 cm maximum dimensions.
Fig. 2: Backscattered electron image of an area of the specimen.
Fig. 3: Energy dispersive spectral analysis of spot 1 in Fig. 2 (High silica material with minor aluminum)
Fig. 4: Energy dispersive spectral analysis of spot 2 in Fig. 2 (high silica material with elevated aluminum)
Fig. 5: Energy dispersive spectral analysis of spot 3 in Fig. 2 (carbon-rich material – epoxy likely)
Fig. 6 X-ray map of the area shown in Fig. 2: Silicon: yellow, aluminum: red.
Table 1: Minor and trace element composition of the specimen. (in wt. %).
Laboratory data as recorded in the report
Element
Reported value
Aluminum
0.2-2.97
Calcium
0.05-0.11
Iron
0.08-0.68
Manganese
0.01-0.04
Potassium
0.11-0.20
Sodium
0.10-0.21
Titanium
0.07-0.13
Summary of findings: This specimen (Fig. 1) is a silica-rich material (Figs. 2-4) with variable aluminum content (Figs. 2 and 4). Some small voids have been filled with an organic material, likely an epoxy compound (Figs. 2 And 5). The metal is surficially at least, Sterling silver with a little over 96 % silver and the rest mainly copper, I can check at greater depth.
Now comes the interesting part. The aluminum content and the distinct aluminum banding. The aluminum content is very variable (Table 1). A bit unusual for an opal. The appearance is more like some volcanic rock that flowed and then was replaced at least in part by silica. Alkalis are not present in large amounts (Table 1). UV fluorescence is poor, whereas many but not all opals show a fairly strong result. Unfortunately, the ring is sitting to high to measure the refractive index. Also, I could test for crystallinity but would need to remove a little powder of the stone, from the back where it would not be very noticeably.
Date: April 18, 2022 Signature
“Monet Jasper” is a trade name for the colorful Brazilian tower examined in this report.
Finding: Sample 92925 (#2), completed July 19, 2022, is high-silica material. X-ray diffraction identified low quartz as the main mineral, and the researcher said it could be called jasper. Iron oxides give the reddish color.
Pattern: The iron-rich bands were compared with Liesegang-type deposition. The original rock was interpreted as either highly replaced volcanic material or very fine-grained sedimentary material; the report does not resolve which origin. Brazil is the supplied locality. The signature line contains an earlier date than the stated completion date.
View the original report
Select a page to enlarge it. 3 pages; findings are summarized in accessible text above.
Use this guide alongside the written findings and the original report transcript. It explains the purpose of each analytical figure and preserves the laboratory’s own figure labels. The interpretations apply to the tested specimen; signals alone do not establish the identity of every similar-looking stone.
Electron microscope image: This view shows small-scale regions selected for analysis. Its brightness contrast helps distinguish regions with different compositions; it is not a photograph of their natural colors. Numbered spots connect this view to the analyses listed in the report.
Laboratory figure caption: Fig. 2: Backscattered electron image of an area of the specimen.
Elemental spectrum: The peaks record characteristic X-ray signals from elements in the analyzed spot or area. This is an analysis of that location, not automatically of the entire specimen. Any mineral identification or uncertainty named in the laboratory caption is retained below.
Laboratory figure caption: Fig. 3: Energy dispersive spectral analysis of spot 1 in Fig. 2 (reddish area, silica-rich with aluminum and iron)
Elemental spectrum: The peaks record characteristic X-ray signals from elements in the analyzed spot or area. This is an analysis of that location, not automatically of the entire specimen. Any mineral identification or uncertainty named in the laboratory caption is retained below.
Laboratory figure caption: Fig. 4: Energy dispersive spectral analysis of spot 2 in Fig. 2 (one of the light colored areas, mainly silica material)
Read the original laboratory report as text
The following text and tables are transcribed from the original laboratory document. Figure captions identify the report images; the laboratory interpretations and limitations are preserved.
Laboratory report 1
Analytical Result Report
Sample id: 92925 (#2, tower)
Submitted by: K. Bitner
Date submitted: July 14, 2022.
Date completed: July 19, 2022.
Operating conditions: An AMRAY 1830 SEM operated at 25 kV acceleration potential, 26 mm working distance, 15 degrees sample tilt, coated with 250 Å carbon. Using the X-ray fluorescence attachment with 35 kV potential in conjunction with the EDS system.
Fig. 1: Photograph of the specimen. 11.5 cm maximum dimensions of the stone.
Fig. 2: Backscattered electron image of an area of the specimen.
Fig. 3: Energy dispersive spectral analysis of spot 1 in Fig. 2 (reddish area, silica-rich with aluminum and iron)
Fig. 4: Energy dispersive spectral analysis of spot 2 in Fig. 2 (one of the light colored areas, mainly silica material)
Table 1: Minor and trace element composition of the specimen. (in wt. %).
Laboratory data as recorded in the report
Element
Reported value
Aluminum
3.5
Calcium
0.06
Iron
0.79
Magnesium
0.80
Manganese
0.22
Phosphorus
0.31
Potassium
Summary of findings: This specimen (Fig. 1) is composed of high-silica material, either a highly replaced volcanic rock or a very fine-grained sedimentary rock of essentially cryptocrystalline quartz with iron oxides that give the color (Figs. 2 to 4). The X-ray maps appear in each color area very homogenous with no grain outlines. The iron oxide bands likely have formed similar to Liesegang banding where an advancing front consisting of solution carrying soluble iron salts eventually deposited them in bands. X-ray diffraction indicates low quartz to be the main mineral species, the material could be called a jasper.
Unicorn Lepidolite is our collection name for this lepidolite and tourmaline material. The name refers to the stone, rather than a unicorn-shaped carving.
The June sphere photograph is shown alongside the existing analysis of the raw specimen. The report identifies lepidolite, fluorapatite, albite and elbaite tourmaline in that submitted specimen; it does not measure every sphere pictured here.
A purple specimen supplied from Russia was tested to identify the mineral assemblage in its pegmatite.
Finding: Sample 92840 (#3), completed February 19, 2022, consists mainly of lepidolite with a low potassium-to-rubidium ratio. The purple color was attributed to manganese. The report also found a mass of fluorapatite, with albite and elbaite tourmaline near the tip.
The researcher interpreted the assemblage as an evolved granitic pegmatite. Russia is supplied provenance rather than a conclusion of the compositional testing.
View the original report
Select a page to enlarge it. 4 pages; findings are summarized in accessible text above.
Use this guide alongside the written findings and the original report transcript. It explains the purpose of each analytical figure and preserves the laboratory’s own figure labels. The interpretations apply to the tested specimen; signals alone do not establish the identity of every similar-looking stone.
Electron microscope image: This view shows small-scale regions selected for analysis. Its brightness contrast helps distinguish regions with different compositions; it is not a photograph of their natural colors. Numbered spots connect this view to the analyses listed in the report.
Laboratory figure caption: Fig. 2: Backscattered electron images of the specimen.
Elemental spectrum: The peaks record characteristic X-ray signals from elements in the analyzed spot or area. This is an analysis of that location, not automatically of the entire specimen. Any mineral identification or uncertainty named in the laboratory caption is retained below.
Laboratory figure caption: Fig. 3: Energy dispersive spectral analysis of spot 1 in Fig. 2. (fluorapatite)
Elemental spectrum: The peaks record characteristic X-ray signals from elements in the analyzed spot or area. This is an analysis of that location, not automatically of the entire specimen. Any mineral identification or uncertainty named in the laboratory caption is retained below.
Laboratory figure caption: Fig. 4: Energy dispersive spectral analysis of spot 2 in Fig. 2. (lepidolite)
Electron microscope image: This view shows small-scale regions selected for analysis. Its brightness contrast helps distinguish regions with different compositions; it is not a photograph of their natural colors. Numbered spots connect this view to the analyses listed in the report.
Laboratory figure caption: Fig. 5: Backscattered electron images of another area of the specimen.
Elemental spectrum: The peaks record characteristic X-ray signals from elements in the analyzed spot or area. This is an analysis of that location, not automatically of the entire specimen. Any mineral identification or uncertainty named in the laboratory caption is retained below.
Laboratory figure caption: Fig. 6: Energy dispersive spectral analysis of spot 2 in Fig. 5. (albite)
Elemental spectrum: The peaks record characteristic X-ray signals from elements in the analyzed spot or area. This is an analysis of that location, not automatically of the entire specimen. Any mineral identification or uncertainty named in the laboratory caption is retained below.
Laboratory figure caption: Fig. 7: Energy dispersive spectral analysis of spot 2 in Fig. 2. (elbaite tourmaline )
Read the original laboratory report as text
The following text and tables are transcribed from the original laboratory document. Figure captions identify the report images; the laboratory interpretations and limitations are preserved.
Laboratory report 1
Analytical Result Report
Sample id: 92840 (#3)
Submitted by: K. Bitner
Date submitted: Feb. 14, 2022.
Date completed: Feb. 19, 2022.
Operating conditions: An AMRAY 1830 SEM operated at 25 kV acceleration potential, 26 mm working distance, 15 degrees sample tilt, coated with 250 Å carbon. Using the X-ray fluorescence attachment with 35 kV potential in conjunction with the EDS system.
Fig. 1: Photograph of the specimen. 11.5 cm maximum dimension.
Fig. 2: Backscattered electron images of the specimen.
Fig. 3: Energy dispersive spectral analysis of spot 1 in Fig. 2. (fluorapatite)
Fig. 4: Energy dispersive spectral analysis of spot 2 in Fig. 2. (lepidolite)
Fig. 5: Backscattered electron images of another area of the specimen.
Fig. 6: Energy dispersive spectral analysis of spot 2 in Fig. 5. (albite)
Fig. 7: Energy dispersive spectral analysis of spot 2 in Fig. 2. (elbaite tourmaline )
Table 1: Minor and trace element composition of the specimen. (in wt. %).
Laboratory data as recorded in the report
Element
Reported value
Iron
0.07
Titanium
0.04
Calcium
0.14
Manganese
0.26
Potassium/rubidium ratio
12
Summary of findings: This specimen (Fig. 1) is a specimen from an evolved granitic pegmatite. The bulk is composed of lepidolite (Fig.2 and 4) with a low K/Rb ratio of 12 (Table 1) indicating high degree of geochemical evolution. The deep purple color is caused by manganese. A mass of fluorapatite is present as well (Figs. 2 and 3). Near the tip is some albite (Figs. 5 and 6) and elbaite (tourmaline group) (Figs. 5 and 7). Only evolved pegmatites produce this mineral assemblage!
Serpentine sold as Green Kyanite (India) · January 2025 collection. The report below concerns its submitted specimen.
Finding: Sample 92904 (#4), completed April 15, 2022, is serpentine. Its iron content was low and evenly distributed in the tested region. The researcher described formation by low-temperature hydrous metamorphism of ultramafic rock as typical for this kind of material.
Name distinction: The report does not identify kyanite. India is the supplied locality; the testing establishes the examined specimen's composition, not the identification of all material sold under the same market label.
View the original report
Select a page to enlarge it. 3 pages; findings are summarized in accessible text above.
Also searchable as Green Kyanite (India), the incorrect market name for this specimen.
Understanding the report figures
Use this guide alongside the written findings and the original report transcript. It explains the purpose of each analytical figure and preserves the laboratory’s own figure labels. The interpretations apply to the tested specimen; signals alone do not establish the identity of every similar-looking stone.
Electron microscope image: This view shows small-scale regions selected for analysis. Its brightness contrast helps distinguish regions with different compositions; it is not a photograph of their natural colors. Numbered spots connect this view to the analyses listed in the report.
Laboratory figure caption: Fig. 2: Backscattered electron image of an area of the specimen.
Elemental spectrum: The peaks record characteristic X-ray signals from elements in the analyzed spot or area. This is an analysis of that location, not automatically of the entire specimen. Any mineral identification or uncertainty named in the laboratory caption is retained below.
Laboratory figure caption: Fig. 3: Energy dispersive spectral analysis of spot 1 in Fig. 2 (serpentine group)
Element map: This map shows where the named elements occur within the analyzed area. Its colors represent the laboratory’s selected element channels, rather than the specimen’s visible colors. The caption below preserves any color key or distribution noted by the laboratory.
Laboratory figure caption: Fig. 4 X-ray map of the area shown in Fig. 2: Magnesium: red, iron: green.
Read the original laboratory report as text
The following text and tables are transcribed from the original laboratory document. Figure captions identify the report images; the laboratory interpretations and limitations are preserved.
Laboratory report 1
Analytical Result Report
Sample id: 92904 (#4)
Submitted by: K. Bitner
Date submitted: April 4, 2022.
Date completed: April 15, 2022.
Operating conditions: An AMRAY 1830 SEM operated at 25 kV acceleration potential, 26 mm working distance, 15 degrees sample tilt, coated with 250 Å carbon. Using the X-ray fluorescence attachment with 35 kV potential in conjunction with the EDS system.
Fig. 1: Photograph of the specimen. 10.5 cm maximum dimensions.
Fig. 2: Backscattered electron image of an area of the specimen.
Fig. 3: Energy dispersive spectral analysis of spot 1 in Fig. 2 (serpentine group)
Fig. 4 X-ray map of the area shown in Fig. 2: Magnesium: red, iron: green.
Table 1: Minor and trace element composition of the specimen. (in wt. %).
Laboratory data as recorded in the report
Element
Reported value
Chromium
0.04
Iron
1.27
Manganese
0.02
Nickel
0.11
Titanium
0.01
Summary of findings: This specimen (Fig. 1) is a very nice piece of serpentine (Figs. 2 and 3). Low iron content likely prevents the stone to become too dark (Table 1). The iron is also uniformly distributed (Fig. 4). The origin is typically from the low temperature hydrous metamorphism of ultramafic rocks such as a dunite.
Date: April 15, 2022 Signature
This is a market-name cross-reference for the Indian green stone supplied as “kyanite.” Testing found serpentine-group material, not kyanite.
Serpentine sold as Green Kyanite (India) · January 2025 collection. The report below concerns its submitted specimen.
Tested identity: Sample 92904 (#4), completed April 15, 2022, was identified as serpentine. Low, evenly distributed iron was noted in the examined area.
Use this guide alongside the written findings and the original report transcript. It explains the purpose of each analytical figure and preserves the laboratory’s own figure labels. The interpretations apply to the tested specimen; signals alone do not establish the identity of every similar-looking stone.
Electron microscope image: This view shows small-scale regions selected for analysis. Its brightness contrast helps distinguish regions with different compositions; it is not a photograph of their natural colors. Numbered spots connect this view to the analyses listed in the report.
Laboratory figure caption: Fig. 2: Backscattered electron image of an area of the specimen.
Elemental spectrum: The peaks record characteristic X-ray signals from elements in the analyzed spot or area. This is an analysis of that location, not automatically of the entire specimen. Any mineral identification or uncertainty named in the laboratory caption is retained below.
Laboratory figure caption: Fig. 3: Energy dispersive spectral analysis of spot 1 in Fig. 2 (serpentine group)
Element map: This map shows where the named elements occur within the analyzed area. Its colors represent the laboratory’s selected element channels, rather than the specimen’s visible colors. The caption below preserves any color key or distribution noted by the laboratory.
Laboratory figure caption: Fig. 4 X-ray map of the area shown in Fig. 2: Magnesium: red, iron: green.
Read the original laboratory report as text
The following text and tables are transcribed from the original laboratory document. Figure captions identify the report images; the laboratory interpretations and limitations are preserved.
Laboratory report 1
Analytical Result Report
Sample id: 92904 (#4)
Submitted by: K. Bitner
Date submitted: April 4, 2022.
Date completed: April 15, 2022.
Operating conditions: An AMRAY 1830 SEM operated at 25 kV acceleration potential, 26 mm working distance, 15 degrees sample tilt, coated with 250 Å carbon. Using the X-ray fluorescence attachment with 35 kV potential in conjunction with the EDS system.
Fig. 1: Photograph of the specimen. 10.5 cm maximum dimensions.
Fig. 2: Backscattered electron image of an area of the specimen.
Fig. 3: Energy dispersive spectral analysis of spot 1 in Fig. 2 (serpentine group)
Fig. 4 X-ray map of the area shown in Fig. 2: Magnesium: red, iron: green.
Table 1: Minor and trace element composition of the specimen. (in wt. %).
Laboratory data as recorded in the report
Element
Reported value
Chromium
0.04
Iron
1.27
Manganese
0.02
Nickel
0.11
Titanium
0.01
Summary of findings: This specimen (Fig. 1) is a very nice piece of serpentine (Figs. 2 and 3). Low iron content likely prevents the stone to become too dark (Table 1). The iron is also uniformly distributed (Fig. 4). The origin is typically from the low temperature hydrous metamorphism of ultramafic rocks such as a dunite.
Date: April 15, 2022 Signature
A Chinese sphere sold under the scenic names Dream Stone and Chinese Painting Stone was examined to identify the minerals behind its pale ground and dark brush-like lines.
Finding: Sample 92937 (#4, Chinese sphere), completed August 11, 2022, is a compact silty limestone containing fine calcite and quartz, manganese-oxide-rich streaks and a smaller iron-oxide contribution. The report also notes minor clay, possibly illite. It reacted vigorously to dilute acid.
Names: Dream Stone, Chinese Painting Stone, Shui Mo Stone, Biyang Stone and Chinese Picture Jasper are market labels for scenic Chinese stones, but they are not precise mineral identifications or guaranteed synonyms for every specimen. “Jasper” would misdescribe the bulk of this tested calcite-rich sphere. Dali Stone can refer to scenic stone from a particular area, which this report does not establish. Chinese Writing Stone and scholar's rocks describe other materials or a broader art tradition, not synonyms for this sphere.
The printed sample number 92937 also appears on a later Chinese kyanite-ruby disk report. The specimens are distinguished here by the August 11 date and sphere description.
View the original report
Select a page to enlarge it. 4 pages; findings are summarized in accessible text above.
Use this guide alongside the written findings and the original report transcript. It explains the purpose of each analytical figure and preserves the laboratory’s own figure labels. The interpretations apply to the tested specimen; signals alone do not establish the identity of every similar-looking stone.
Electron microscope image: This view shows small-scale regions selected for analysis. Its brightness contrast helps distinguish regions with different compositions; it is not a photograph of their natural colors. Numbered spots connect this view to the analyses listed in the report.
Laboratory figure caption: Fig. 2: Backscattered electron image of an area of the specimen.
Elemental spectrum: The peaks record characteristic X-ray signals from elements in the analyzed spot or area. This is an analysis of that location, not automatically of the entire specimen. Any mineral identification or uncertainty named in the laboratory caption is retained below.
Laboratory figure caption: Fig. 3: Energy dispersive spectral analysis of spot 1 in Fig. 2 (manganese oxide species)
Elemental spectrum: The peaks record characteristic X-ray signals from elements in the analyzed spot or area. This is an analysis of that location, not automatically of the entire specimen. Any mineral identification or uncertainty named in the laboratory caption is retained below.
Laboratory figure caption: Fig. 4: Energy dispersive spectral analysis of spot 2 in Fig. 2 (calcite)
Electron microscope image: This view shows small-scale regions selected for analysis. Its brightness contrast helps distinguish regions with different compositions; it is not a photograph of their natural colors. Numbered spots connect this view to the analyses listed in the report.
Laboratory figure caption: Fig. 5: Backscattered electron image of another area of the specimen.
Element map: This map shows where the named elements occur within the analyzed area. Its colors represent the laboratory’s selected element channels, rather than the specimen’s visible colors. The caption below preserves any color key or distribution noted by the laboratory.
Laboratory figure caption: Fig. 6: X-ray map of the area shown in Fig. 2. Calclium: blue, Iron: green, Manganese: orange.
Diffraction scan: This scan helps identify crystalline minerals by comparing the measured pattern with reference patterns. The laboratory interpretation explains which minerals the comparison supports.
Laboratory figure caption: Fig. 7: X-ray diffraction scan of the light colored material.
Read the original laboratory report as text
The following text and tables are transcribed from the original laboratory document. Figure captions identify the report images; the laboratory interpretations and limitations are preserved.
Laboratory report 1
Analytical Result Report
Sample id: 92937 (#4, Chinese sphere)
Submitted by: K. Bitner
Date submitted: July 14, 2022.
Date completed: August 11, 2022.
Operating conditions: An AMRAY 1830 SEM operated at 25 kV acceleration potential, 26 mm working distance, 15 degrees sample tilt, coated with 250 Å carbon. Using the X-ray fluorescence attachment with 35 kV potential in conjunction with the EDS system. A Bruker D2 Phaser X-ray diffractometer was used and operated at 30 kV and 10 mA.
Fig. 1: Photograph of the specimen. Approxiamtely 4 cm maximum dimensions.
Fig. 2: Backscattered electron image of an area of the specimen.
Fig. 3: Energy dispersive spectral analysis of spot 1 in Fig. 2 (manganese oxide species)
Fig. 4: Energy dispersive spectral analysis of spot 2 in Fig. 2 (calcite)
Fig. 5: Backscattered electron image of another area of the specimen.
Fig. 6: X-ray map of the area shown in Fig. 2. Calclium: blue, Iron: green, Manganese: orange.
Fig. 7: X-ray diffraction scan of the light colored material.
Table 1: Minor and trace element composition of the specimen. (in wt. %).
Laboratory data as recorded in the report
Element
Reported value
Aluminum
2.1
Iron
0.9
Manganese
1.7
Phosphorus
0.1
Potassium
0.9
Titanium
0.1
Silicon
26.8
Sodium
2.6
Strontium
0.7
Summary of findings: This specimen (Fig. 1) is a fine-grained mixture of calcite (Figs. 2, 3 and 7) and quartz (Figs. 2, 5 and 7) with streaks rich in manganese oxides with minor iron oxide contribution (Figs. 2, 3 and 6). There are also minor amounts of some clay species, likely illite is one of them which may be the reason potassium is present (Table 1). The material is a very fine-grained and well compacted silty limestone. Dilute hydrochloric acid caused vigorous CO2 emission.
Date: Aug. 10, 2022 Signature
A Chinese sphere sold under the scenic names Dream Stone and Chinese Painting Stone was examined to identify the minerals behind its pale ground and dark brush-like lines.
Finding: Sample 92937 (#4, Chinese sphere), completed August 11, 2022, is a compact silty limestone containing fine calcite and quartz, manganese-oxide-rich streaks and a smaller iron-oxide contribution. The report also notes minor clay, possibly illite. It reacted vigorously to dilute acid.
Names: Dream Stone, Chinese Painting Stone, Shui Mo Stone, Biyang Stone and Chinese Picture Jasper are market labels for scenic Chinese stones, but they are not precise mineral identifications or guaranteed synonyms for every specimen. “Jasper” would misdescribe the bulk of this tested calcite-rich sphere. Dali Stone can refer to scenic stone from a particular area, which this report does not establish. Chinese Writing Stone and scholar's rocks describe other materials or a broader art tradition, not synonyms for this sphere.
The printed sample number 92937 also appears on a later Chinese kyanite-ruby disk report. The specimens are distinguished here by the August 11 date and sphere description.
View the original report
Select a page to enlarge it. 4 pages; findings are summarized in accessible text above.
Use this guide alongside the written findings and the original report transcript. It explains the purpose of each analytical figure and preserves the laboratory’s own figure labels. The interpretations apply to the tested specimen; signals alone do not establish the identity of every similar-looking stone.
Electron microscope image: This view shows small-scale regions selected for analysis. Its brightness contrast helps distinguish regions with different compositions; it is not a photograph of their natural colors. Numbered spots connect this view to the analyses listed in the report.
Laboratory figure caption: Fig. 2: Backscattered electron image of an area of the specimen.
Elemental spectrum: The peaks record characteristic X-ray signals from elements in the analyzed spot or area. This is an analysis of that location, not automatically of the entire specimen. Any mineral identification or uncertainty named in the laboratory caption is retained below.
Laboratory figure caption: Fig. 3: Energy dispersive spectral analysis of spot 1 in Fig. 2 (manganese oxide species)
Elemental spectrum: The peaks record characteristic X-ray signals from elements in the analyzed spot or area. This is an analysis of that location, not automatically of the entire specimen. Any mineral identification or uncertainty named in the laboratory caption is retained below.
Laboratory figure caption: Fig. 4: Energy dispersive spectral analysis of spot 2 in Fig. 2 (calcite)
Electron microscope image: This view shows small-scale regions selected for analysis. Its brightness contrast helps distinguish regions with different compositions; it is not a photograph of their natural colors. Numbered spots connect this view to the analyses listed in the report.
Laboratory figure caption: Fig. 5: Backscattered electron image of another area of the specimen.
Element map: This map shows where the named elements occur within the analyzed area. Its colors represent the laboratory’s selected element channels, rather than the specimen’s visible colors. The caption below preserves any color key or distribution noted by the laboratory.
Laboratory figure caption: Fig. 6: X-ray map of the area shown in Fig. 2. Calclium: blue, Iron: green, Manganese: orange.
Diffraction scan: This scan helps identify crystalline minerals by comparing the measured pattern with reference patterns. The laboratory interpretation explains which minerals the comparison supports.
Laboratory figure caption: Fig. 7: X-ray diffraction scan of the light colored material.
Read the original laboratory report as text
The following text and tables are transcribed from the original laboratory document. Figure captions identify the report images; the laboratory interpretations and limitations are preserved.
Laboratory report 1
Analytical Result Report
Sample id: 92937 (#4, Chinese sphere)
Submitted by: K. Bitner
Date submitted: July 14, 2022.
Date completed: August 11, 2022.
Operating conditions: An AMRAY 1830 SEM operated at 25 kV acceleration potential, 26 mm working distance, 15 degrees sample tilt, coated with 250 Å carbon. Using the X-ray fluorescence attachment with 35 kV potential in conjunction with the EDS system. A Bruker D2 Phaser X-ray diffractometer was used and operated at 30 kV and 10 mA.
Fig. 1: Photograph of the specimen. Approxiamtely 4 cm maximum dimensions.
Fig. 2: Backscattered electron image of an area of the specimen.
Fig. 3: Energy dispersive spectral analysis of spot 1 in Fig. 2 (manganese oxide species)
Fig. 4: Energy dispersive spectral analysis of spot 2 in Fig. 2 (calcite)
Fig. 5: Backscattered electron image of another area of the specimen.
Fig. 6: X-ray map of the area shown in Fig. 2. Calclium: blue, Iron: green, Manganese: orange.
Fig. 7: X-ray diffraction scan of the light colored material.
Table 1: Minor and trace element composition of the specimen. (in wt. %).
Laboratory data as recorded in the report
Element
Reported value
Aluminum
2.1
Iron
0.9
Manganese
1.7
Phosphorus
0.1
Potassium
0.9
Titanium
0.1
Silicon
26.8
Sodium
2.6
Strontium
0.7
Summary of findings: This specimen (Fig. 1) is a fine-grained mixture of calcite (Figs. 2, 3 and 7) and quartz (Figs. 2, 5 and 7) with streaks rich in manganese oxides with minor iron oxide contribution (Figs. 2, 3 and 6). There are also minor amounts of some clay species, likely illite is one of them which may be the reason potassium is present (Table 1). The material is a very fine-grained and well compacted silty limestone. Dilute hydrochloric acid caused vigorous CO2 emission.
Pink Petrified Wood market-name pendants · October 2025 collection. The lower portion of the shared photo is shown here; the pictured pieces were not the tested specimen.
This Australian material was marketed as Pink Petrified Wood. The examined specimen was not identified as petrified wood.
Finding: Sample 92905 (#5), completed April 18, 2022, was identified as a silica-rich, slightly silicified rhyolitic volcanic rock. A calcium-rich grain could be altered plagioclase or a zeolite; the report did not resolve its identity.
Why the market name matters: The report did not document wood anatomy or fossil replacement. It arrived at the laboratory under a “rhodonite” label, but the findings support neither rhodonite nor petrified wood in the examined area. Australia is the supplied locality.
Catalog note: The printed sample number 92905 also appears on separate beryl and ruby association reports. This entry is identified by its April 18 completion date and the pink Australian specimen; the reports are kept separate.
View the original report
Select a page to enlarge it. 4 pages; findings are summarized in accessible text above.
Use this guide alongside the written findings and the original report transcript. It explains the purpose of each analytical figure and preserves the laboratory’s own figure labels. The interpretations apply to the tested specimen; signals alone do not establish the identity of every similar-looking stone.
Electron microscope image: This view shows small-scale regions selected for analysis. Its brightness contrast helps distinguish regions with different compositions; it is not a photograph of their natural colors. Numbered spots connect this view to the analyses listed in the report.
Laboratory figure caption: Fig. 2: Backscattered electron image of an area of the specimen.
Elemental spectrum: The peaks record characteristic X-ray signals from elements in the analyzed spot or area. This is an analysis of that location, not automatically of the entire specimen. Any mineral identification or uncertainty named in the laboratory caption is retained below.
Laboratory figure caption: Fig. 3: Energy dispersive spectral analysis of spot 1 in Fig. 2 (silia-rich rhyolitic rock)
Elemental spectrum: The peaks record characteristic X-ray signals from elements in the analyzed spot or area. This is an analysis of that location, not automatically of the entire specimen. Any mineral identification or uncertainty named in the laboratory caption is retained below.
Laboratory figure caption: Fig. 4: Energy dispersive spectral analysis of spot 2 in Fig. 2 (either altered calcic plagioclase or a zeolite)
Elemental spectrum: The peaks record characteristic X-ray signals from elements in the analyzed spot or area. This is an analysis of that location, not automatically of the entire specimen. Any mineral identification or uncertainty named in the laboratory caption is retained below.
Laboratory figure caption: Fig. 5: Energy dispersive spectral analysis of spot 4 in Fig. 2 (potasium feldspar)
Element map: This map shows where the named elements occur within the analyzed area. Its colors represent the laboratory’s selected element channels, rather than the specimen’s visible colors. The caption below preserves any color key or distribution noted by the laboratory.
Laboratory figure caption: Fig. 4 X-ray map of the area shown in Fig. 2: Left: sodium: yellow, calcium: red, potassium: blue. Right: silicon: orange; aluminum: green.
Read the original laboratory report as text
The following text and tables are transcribed from the original laboratory document. Figure captions identify the report images; the laboratory interpretations and limitations are preserved.
Laboratory report 1
Analytical Result Report
Sample id: 92905 (#5) ‘rhodonite’
Submitted by: K. Bitner
Date submitted: April 4, 2022.
Date completed: April 18, 2022.
Operating conditions: An AMRAY 1830 SEM operated at 25 kV acceleration potential, 26 mm working distance, 15 degrees sample tilt, coated with 250 Å carbon. Using the X-ray fluorescence attachment with 35 kV potential in conjunction with the EDS system.
Fig. 1: Photograph of the specimen. 4.5 cm maximum dimensions.
Fig. 2: Backscattered electron image of an area of the specimen.
Fig. 3: Energy dispersive spectral analysis of spot 1 in Fig. 2 (silia-rich rhyolitic rock)
Fig. 4: Energy dispersive spectral analysis of spot 2 in Fig. 2 (either altered calcic plagioclase or a zeolite)
Fig. 5: Energy dispersive spectral analysis of spot 4 in Fig. 2 (potasium feldspar)
Fig. 4 X-ray map of the area shown in Fig. 2: Left: sodium: yellow, calcium: red, potassium: blue. Right: silicon: orange; aluminum: green.
Table 1: Minor and trace element composition of the specimen. (in wt. %).
Laboratory data as recorded in the report
Element
Reported value
Barium
0.08
Calcium
1.25
Iron
0.52
Manganese
0.05
Potassium
3.61
Sodium
2.88
Summary of findings: This specimen (Fig. 1) is a silicified volcanic rock (Figs. 2-6 and Table 1. Silica is high (77 wt. % SiO2) but suggests a slightly silicified rhyolitic rock (Fig. 3), but the chemical signature is clear. A grain with high calcium (Fig. 4) is interesting and resembles a zeolite or a plagioclase. However, for a plagioclase it would indicate a more mafic rock which this material is not according to the high sodium and calcium (Table 1). The elevated barium is another indication for a felsic volcanic rock (Table 1).
Larvikite Stretch Bracelets · Soul Body Gems, September 2024.
A Norwegian specimen sold as larvikite was examined for its feldspars and accessory minerals.
Finding: Sample 92927 (#5), completed July 18, 2022, is mainly intermediate sodium-calcium plagioclase, described as labradorite-like, with amphibole, ilmenite and apatite. The researcher noted titanium-bearing phases in this larvikite material.
Feldspar distinction: The examined material did not contain enough potassium to support anorthoclase; its analyzed feldspar was plagioclase. The report notes that twinning was not clearly visible in this sample. Norway is the supplied locality.
The signature date printed on the report differs from its stated completion date; the original is shown as received.
View the original report
Select a page to enlarge it. 6 pages; findings are summarized in accessible text above.
Use this guide alongside the written findings and the original report transcript. It explains the purpose of each analytical figure and preserves the laboratory’s own figure labels. The interpretations apply to the tested specimen; signals alone do not establish the identity of every similar-looking stone.
Electron microscope image: This view shows small-scale regions selected for analysis. Its brightness contrast helps distinguish regions with different compositions; it is not a photograph of their natural colors. Numbered spots connect this view to the analyses listed in the report.
Laboratory figure caption: Fig. 2: Backscattered electron image of an area of the specimen.
Elemental spectrum: The peaks record characteristic X-ray signals from elements in the analyzed spot or area. This is an analysis of that location, not automatically of the entire specimen. Any mineral identification or uncertainty named in the laboratory caption is retained below.
Laboratory figure caption: Fig. 3: Energy dispersive spectral analysis of spot 1 in Fig. 2 (plagioclase, intermediate)
Elemental spectrum: The peaks record characteristic X-ray signals from elements in the analyzed spot or area. This is an analysis of that location, not automatically of the entire specimen. Any mineral identification or uncertainty named in the laboratory caption is retained below.
Laboratory figure caption: Fig. 4: Energy dispersive spectral analysis of spot 2 in Fig. 2 (intermediate plagioclase)
Electron microscope image: This view shows small-scale regions selected for analysis. Its brightness contrast helps distinguish regions with different compositions; it is not a photograph of their natural colors. Numbered spots connect this view to the analyses listed in the report.
Laboratory figure caption: Fig. 5: Backscattered electron image of another area of the specimen.
Elemental spectrum: The peaks record characteristic X-ray signals from elements in the analyzed spot or area. This is an analysis of that location, not automatically of the entire specimen. Any mineral identification or uncertainty named in the laboratory caption is retained below.
Laboratory figure caption: Fig. 6: Energy dispersive spectral analysis of spot 21in Fig. 25 (ilmenite)
Elemental spectrum: The peaks record characteristic X-ray signals from elements in the analyzed spot or area. This is an analysis of that location, not automatically of the entire specimen. Any mineral identification or uncertainty named in the laboratory caption is retained below.
Laboratory figure caption: Fig. 6: Energy dispersive spectral analysis of spot 2 in Fig. 5 (amphibole)
Elemental spectrum: The peaks record characteristic X-ray signals from elements in the analyzed spot or area. This is an analysis of that location, not automatically of the entire specimen. Any mineral identification or uncertainty named in the laboratory caption is retained below.
Laboratory figure caption: Fig. 7: Energy dispersive spectral analysis of spot 3 in Fig. 5 (intermediate amphibole)
Elemental spectrum: The peaks record characteristic X-ray signals from elements in the analyzed spot or area. This is an analysis of that location, not automatically of the entire specimen. Any mineral identification or uncertainty named in the laboratory caption is retained below.
Laboratory figure caption: Fig. 8: Energy dispersive spectral analysis of spot 3 in Fig. 5 (apatite)
Element map: This map shows where the named elements occur within the analyzed area. Its colors represent the laboratory’s selected element channels, rather than the specimen’s visible colors. The caption below preserves any color key or distribution noted by the laboratory.
Laboratory figure caption: Fig. 9 X-ray map of the area shown in Fig. 2: Calcium: red, iron: green. Note fracture in the upper left to middle, which is outlined with calcium-rich material).
Element map: This map shows where the named elements occur within the analyzed area. Its colors represent the laboratory’s selected element channels, rather than the specimen’s visible colors. The caption below preserves any color key or distribution noted by the laboratory.
Laboratory figure caption: Fig. 10 X-ray map of the area shown in Fig. 5: magnesium: red, iron: green, calclium: blue.
Read the original laboratory report as text
The following text and tables are transcribed from the original laboratory document. Figure captions identify the report images; the laboratory interpretations and limitations are preserved.
Laboratory report 1
Analytical Result Report
Sample id: 92927 (#5, larvikite)
Submitted by: K. Bitner
Date submitted: July 14, 2022.
Date completed: July 18, 2022.
Operating conditions: An AMRAY 1830 SEM operated at 25 kV acceleration potential, 26 mm working distance, 15 degrees sample tilt, coated with 250 Å carbon. Using the X-ray fluorescence attachment with 35 kV potential in conjunction with the EDS system.
Fig. 1: Photograph of the specimen. 5 cm maximum dimensions of the stone.
Fig. 2: Backscattered electron image of an area of the specimen.
Fig. 3: Energy dispersive spectral analysis of spot 1 in Fig. 2 (plagioclase, intermediate)
Fig. 4: Energy dispersive spectral analysis of spot 2 in Fig. 2 (intermediate plagioclase)
Fig. 5: Backscattered electron image of another area of the specimen.
Fig. 6: Energy dispersive spectral analysis of spot 21in Fig. 25 (ilmenite)
Fig. 6: Energy dispersive spectral analysis of spot 2 in Fig. 5 (amphibole)
Fig. 7: Energy dispersive spectral analysis of spot 3 in Fig. 5 (intermediate amphibole)
Fig. 8: Energy dispersive spectral analysis of spot 3 in Fig. 5 (apatite)
Fig. 9 X-ray map of the area shown in Fig. 2: Calcium: red, iron: green. Note fracture in the upper left to middle, which is outlined with calcium-rich material).
Fig. 10 X-ray map of the area shown in Fig. 5: magnesium: red, iron: green, calclium: blue.
Table 1: Minor and trace element composition of the specimen. (in wt. %).
Laboratory data as recorded in the report
Element
Reported value
Calcium
5.0
Iron
0.26
Magnesium
0.16
Manganese
0.02
Phosphorus
0.02
Potassium
0.30
Titanium
0.23
Summary of findings: This specimen (Fig. 1) is composed mainly of an intermediate plagioclase such as a labradorite (Figs. 2.3,4, and 7). Accessory minerals include amphibole, ilmenite, and apatite (Figs. 5, 6, 8, 9 and 10). Larvikite occurrences are usually titanium-rich and in this case, we see titanium species and apatite. Twinning in the plagioclase is not very clearly visible in this material but compositionally, it is clearly a plagioclase, there is not enough potassium to have a ternary feldspar. This material does not contain anorthoclase which is a sodium-potassium feldspar but a sodium calcium plagioclase.
Kyanite in Quartz Spheres (Brazil) · Soul Body Gems, April 2024.
A blue kyanite sphere was tested to identify its mineral assemblage.
Finding: Sample 92928 (#6), completed July 31, 2022, is mainly kyanite with lesser muscovite and quartz. Titanium and iron were present in minor amounts and described as contributors to its blue color.
Formation: The researcher interpreted it as a metamorphic rock derived from clay-rich sediment under relatively high pressure and discussed the related aluminum-silicate polymorphs andalusite and sillimanite.
View the original report
Select a page to enlarge it. 4 pages; findings are summarized in accessible text above.
Use this guide alongside the written findings and the original report transcript. It explains the purpose of each analytical figure and preserves the laboratory’s own figure labels. The interpretations apply to the tested specimen; signals alone do not establish the identity of every similar-looking stone.
Electron microscope image: This view shows small-scale regions selected for analysis. Its brightness contrast helps distinguish regions with different compositions; it is not a photograph of their natural colors. Numbered spots connect this view to the analyses listed in the report.
Laboratory figure caption: Fig. 2: Backscattered electron image of an area of the specimen.
Elemental spectrum: The peaks record characteristic X-ray signals from elements in the analyzed spot or area. This is an analysis of that location, not automatically of the entire specimen. Any mineral identification or uncertainty named in the laboratory caption is retained below.
Laboratory figure caption: Fig. 3: Energy dispersive spectral analysis of spot 1 in Fig. 2 (muscovite)
Elemental spectrum: The peaks record characteristic X-ray signals from elements in the analyzed spot or area. This is an analysis of that location, not automatically of the entire specimen. Any mineral identification or uncertainty named in the laboratory caption is retained below.
Laboratory figure caption: Fig. 4: Energy dispersive spectral analysis of spot 2 in Fig. 2 (kyanite)
Elemental spectrum: The peaks record characteristic X-ray signals from elements in the analyzed spot or area. This is an analysis of that location, not automatically of the entire specimen. Any mineral identification or uncertainty named in the laboratory caption is retained below.
Laboratory figure caption: Fig. 4: Energy dispersive spectral analysis of spot 3 in Fig. 2 (quartz)
Read the original laboratory report as text
The following text and tables are transcribed from the original laboratory document. Figure captions identify the report images; the laboratory interpretations and limitations are preserved.
Laboratory report 1
Analytical Result Report
Sample id: 92928 (#6, kyanite sphere)
Submitted by: K. Bitner
Date submitted: July 14, 2022.
Date completed: July 31, 2022.
Operating conditions: An AMRAY 1830 SEM operated at 25 kV acceleration potential, 26 mm working distance, 15 degrees sample tilt, coated with 250 Å carbon. Using the X-ray fluorescence attachment with 35 kV potential in conjunction with the EDS system.
Fig. 1: Photograph of the specimen. 4 cm maximum dimensions.
Fig. 2: Backscattered electron image of an area of the specimen.
Fig. 3: Energy dispersive spectral analysis of spot 1 in Fig. 2 (muscovite)
Fig. 4: Energy dispersive spectral analysis of spot 2 in Fig. 2 (kyanite)
Fig. 4: Energy dispersive spectral analysis of spot 3 in Fig. 2 (quartz)
Fig. 5: X-ray of the area shown in Fig. 2. Aluminum: yellow, potassium: purple.
Table 1: Minor and trace element composition of the specimen. (in wt. %).
Laboratory data as recorded in the report
Element
Reported value
Calcium
0.01
Iron
0.11
Phosphorus
0.06
Potassium
1.66
Titanium
0.01
Vanadium
0.01
Summary of findings: This specimen (Fig. 1) is composed mainly of kyanite (Figs. 2 and 4) with lesser amounts of muscovite (Figs. 2 and 3) and quartz (Figs 2 and 4). This material represents a metamorphic rock that started out from a pelitic sediment (shale). High pressure and low to moderate temperature caused kyanite to form. At higher temperature, sillimanite would have formed and at lower presser, andalusite would have been the dominant polymorph. These three minerals are geobarometers/thermometers! Minor amounts of titanium and iron are needed to give kyanite its nice blue color and these are indeed present (Table 1)
Kyanite in Quartz Spheres (Brazil) · Soul Body Gems, April 2024.
A blue kyanite sphere was tested to identify its mineral assemblage.
Finding: Sample 92928 (#6), completed July 31, 2022, is mainly kyanite with lesser muscovite and quartz. Titanium and iron were present in minor amounts and described as contributors to its blue color.
Formation: The researcher interpreted it as a metamorphic rock derived from clay-rich sediment under relatively high pressure and discussed the related aluminum-silicate polymorphs andalusite and sillimanite.
View the original report
Select a page to enlarge it. 4 pages; findings are summarized in accessible text above.
Use this guide alongside the written findings and the original report transcript. It explains the purpose of each analytical figure and preserves the laboratory’s own figure labels. The interpretations apply to the tested specimen; signals alone do not establish the identity of every similar-looking stone.
Electron microscope image: This view shows small-scale regions selected for analysis. Its brightness contrast helps distinguish regions with different compositions; it is not a photograph of their natural colors. Numbered spots connect this view to the analyses listed in the report.
Laboratory figure caption: Fig. 2: Backscattered electron image of an area of the specimen.
Elemental spectrum: The peaks record characteristic X-ray signals from elements in the analyzed spot or area. This is an analysis of that location, not automatically of the entire specimen. Any mineral identification or uncertainty named in the laboratory caption is retained below.
Laboratory figure caption: Fig. 3: Energy dispersive spectral analysis of spot 1 in Fig. 2 (muscovite)
Elemental spectrum: The peaks record characteristic X-ray signals from elements in the analyzed spot or area. This is an analysis of that location, not automatically of the entire specimen. Any mineral identification or uncertainty named in the laboratory caption is retained below.
Laboratory figure caption: Fig. 4: Energy dispersive spectral analysis of spot 2 in Fig. 2 (kyanite)
Elemental spectrum: The peaks record characteristic X-ray signals from elements in the analyzed spot or area. This is an analysis of that location, not automatically of the entire specimen. Any mineral identification or uncertainty named in the laboratory caption is retained below.
Laboratory figure caption: Fig. 4: Energy dispersive spectral analysis of spot 3 in Fig. 2 (quartz)
Read the original laboratory report as text
The following text and tables are transcribed from the original laboratory document. Figure captions identify the report images; the laboratory interpretations and limitations are preserved.
Laboratory report 1
Analytical Result Report
Sample id: 92928 (#6, kyanite sphere)
Submitted by: K. Bitner
Date submitted: July 14, 2022.
Date completed: July 31, 2022.
Operating conditions: An AMRAY 1830 SEM operated at 25 kV acceleration potential, 26 mm working distance, 15 degrees sample tilt, coated with 250 Å carbon. Using the X-ray fluorescence attachment with 35 kV potential in conjunction with the EDS system.
Fig. 1: Photograph of the specimen. 4 cm maximum dimensions.
Fig. 2: Backscattered electron image of an area of the specimen.
Fig. 3: Energy dispersive spectral analysis of spot 1 in Fig. 2 (muscovite)
Fig. 4: Energy dispersive spectral analysis of spot 2 in Fig. 2 (kyanite)
Fig. 4: Energy dispersive spectral analysis of spot 3 in Fig. 2 (quartz)
Fig. 5: X-ray of the area shown in Fig. 2. Aluminum: yellow, potassium: purple.
Table 1: Minor and trace element composition of the specimen. (in wt. %).
Laboratory data as recorded in the report
Element
Reported value
Calcium
0.01
Iron
0.11
Phosphorus
0.06
Potassium
1.66
Titanium
0.01
Vanadium
0.01
Summary of findings: This specimen (Fig. 1) is composed mainly of kyanite (Figs. 2 and 4) with lesser amounts of muscovite (Figs. 2 and 3) and quartz (Figs 2 and 4). This material represents a metamorphic rock that started out from a pelitic sediment (shale). High pressure and low to moderate temperature caused kyanite to form. At higher temperature, sillimanite would have formed and at lower presser, andalusite would have been the dominant polymorph. These three minerals are geobarometers/thermometers! Minor amounts of titanium and iron are needed to give kyanite its nice blue color and these are indeed present (Table 1)
Date: July 31, 2022 Signature
Original specimen photograph from the laboratory report, cropped with conventional sharpening, color and contrast adjustments.
A banded specimen identified as dolomite marble, previously cataloged as Mystery Stone 2. The laboratory found mainly dolomite with minor potassium feldspar.
Finding: Sample 92837 (#7), completed September 7, 2021, is mainly dolomite with minor potassium feldspar. The researcher described banded dolomite marble and noted a visual resemblance to some stromatolitic dolomite marble.
Interpretation limits: Resemblance does not prove a stromatolite or a Michigan locality for this specimen. The feldspar could reflect original clastic grains or later formation from precursor material; the report leaves that question open.
View the original report
Select a page to enlarge it. 3 pages; findings are summarized in accessible text above.
Use this guide alongside the written findings and the original report transcript. It explains the purpose of each analytical figure and preserves the laboratory’s own figure labels. The interpretations apply to the tested specimen; signals alone do not establish the identity of every similar-looking stone.
Electron microscope image: This view shows small-scale regions selected for analysis. Its brightness contrast helps distinguish regions with different compositions; it is not a photograph of their natural colors. Numbered spots connect this view to the analyses listed in the report.
Laboratory figure caption: Fig. 2: Backscattered electron images of the specimen.
Elemental spectrum: The peaks record characteristic X-ray signals from elements in the analyzed spot or area. This is an analysis of that location, not automatically of the entire specimen. Any mineral identification or uncertainty named in the laboratory caption is retained below.
Laboratory figure caption: Fig. 3: Energy dispersive spectral analysis of spot 1 in Fig. 2. (dolomite)
Elemental spectrum: The peaks record characteristic X-ray signals from elements in the analyzed spot or area. This is an analysis of that location, not automatically of the entire specimen. Any mineral identification or uncertainty named in the laboratory caption is retained below.
Laboratory figure caption: Fig. 4: Energy dispersive spectral analysis of spot 2 in Fig. 2. (potassium feldspar)
Element map: This map shows where the named elements occur within the analyzed area. Its colors represent the laboratory’s selected element channels, rather than the specimen’s visible colors. The caption below preserves any color key or distribution noted by the laboratory.
Laboratory figure caption: Fig. 6: X-ray map of Fig. 2. Left: silicon: orange, potassium: green. Right: iron: blue
Read the original laboratory report as text
The following text and tables are transcribed from the original laboratory document. Figure captions identify the report images; the laboratory interpretations and limitations are preserved.
Laboratory report 1
Analytical Result Report
Sample id: 92837 (#7)
Submitted by: K. Bitner
Date submitted: Aug.2, 2021.
Date completed: Sept. 7, 2021.
Operating conditions: An AMRAY 1830 SEM operated at 25 kV acceleration potential, 26 mm working distance, 15 degrees sample tilt, coated with 250 Å carbon. Using the X-ray fluorescence attachment with 35 kV potential in conjunction with the EDS system.
Fig. 1: Photograph of the specimen. 4.4 cm maximum dimension.
Fig. 2: Backscattered electron images of the specimen.
Fig. 3: Energy dispersive spectral analysis of spot 1 in Fig. 2. (dolomite)
Fig. 4: Energy dispersive spectral analysis of spot 2 in Fig. 2. (potassium feldspar)
NaNa
Fig. 6: X-ray map of Fig. 2. Left: silicon: orange, potassium: green. Right: iron: blue
Table 1: Minor and trace element composition of the specimen. (in wt. %).
Laboratory data as recorded in the report
Element
Reported value
Iron
0.59
Aluminum
1.22
Phosphorus
0.08
Titanium
0.03
Manganese
0.01
Summary of findings: This specimen (Fig. 1) is mainly composed of dolomite (Figs. 2, 3 and 5) with minor amounts of potassium feldspar (Figs. 2, 4, and 5). It is a banded dolomite marble that bears a strong resemblance to some stromatolitic dolomite marble I know from Michigan, the Proterozoic dolomite which was deposited as algal and microbial mats. These stromatolites have been found in many places worldwide and they can look very similar in many locations. The contribution of feldspars is either clastic from the original sediment or it could be authigenic, derived from precursor minerals such as clay and sea water.
Date: Sept. 7, 2021 Signature
Original specimen photograph from the laboratory report, cropped with conventional sharpening, color and contrast adjustments.
A banded specimen identified as dolomite marble, previously cataloged as Mystery Stone 2. The laboratory found mainly dolomite with minor potassium feldspar.
Finding: Sample 92837 (#7), completed September 7, 2021, is mainly dolomite with minor potassium feldspar. The researcher described banded dolomite marble and noted a visual resemblance to some stromatolitic dolomite marble.
Interpretation limits: Resemblance does not prove a stromatolite or a Michigan locality for this specimen. The feldspar could reflect original clastic grains or later formation from precursor material; the report leaves that question open.
View the original report
Select a page to enlarge it. 3 pages; findings are summarized in accessible text above.
Use this guide alongside the written findings and the original report transcript. It explains the purpose of each analytical figure and preserves the laboratory’s own figure labels. The interpretations apply to the tested specimen; signals alone do not establish the identity of every similar-looking stone.
Electron microscope image: This view shows small-scale regions selected for analysis. Its brightness contrast helps distinguish regions with different compositions; it is not a photograph of their natural colors. Numbered spots connect this view to the analyses listed in the report.
Laboratory figure caption: Fig. 2: Backscattered electron images of the specimen.
Elemental spectrum: The peaks record characteristic X-ray signals from elements in the analyzed spot or area. This is an analysis of that location, not automatically of the entire specimen. Any mineral identification or uncertainty named in the laboratory caption is retained below.
Laboratory figure caption: Fig. 3: Energy dispersive spectral analysis of spot 1 in Fig. 2. (dolomite)
Elemental spectrum: The peaks record characteristic X-ray signals from elements in the analyzed spot or area. This is an analysis of that location, not automatically of the entire specimen. Any mineral identification or uncertainty named in the laboratory caption is retained below.
Laboratory figure caption: Fig. 4: Energy dispersive spectral analysis of spot 2 in Fig. 2. (potassium feldspar)
Element map: This map shows where the named elements occur within the analyzed area. Its colors represent the laboratory’s selected element channels, rather than the specimen’s visible colors. The caption below preserves any color key or distribution noted by the laboratory.
Laboratory figure caption: Fig. 6: X-ray map of Fig. 2. Left: silicon: orange, potassium: green. Right: iron: blue
Read the original laboratory report as text
The following text and tables are transcribed from the original laboratory document. Figure captions identify the report images; the laboratory interpretations and limitations are preserved.
Laboratory report 1
Analytical Result Report
Sample id: 92837 (#7)
Submitted by: K. Bitner
Date submitted: Aug.2, 2021.
Date completed: Sept. 7, 2021.
Operating conditions: An AMRAY 1830 SEM operated at 25 kV acceleration potential, 26 mm working distance, 15 degrees sample tilt, coated with 250 Å carbon. Using the X-ray fluorescence attachment with 35 kV potential in conjunction with the EDS system.
Fig. 1: Photograph of the specimen. 4.4 cm maximum dimension.
Fig. 2: Backscattered electron images of the specimen.
Fig. 3: Energy dispersive spectral analysis of spot 1 in Fig. 2. (dolomite)
Fig. 4: Energy dispersive spectral analysis of spot 2 in Fig. 2. (potassium feldspar)
NaNa
Fig. 6: X-ray map of Fig. 2. Left: silicon: orange, potassium: green. Right: iron: blue
Table 1: Minor and trace element composition of the specimen. (in wt. %).
Laboratory data as recorded in the report
Element
Reported value
Iron
0.59
Aluminum
1.22
Phosphorus
0.08
Titanium
0.03
Manganese
0.01
Summary of findings: This specimen (Fig. 1) is mainly composed of dolomite (Figs. 2, 3 and 5) with minor amounts of potassium feldspar (Figs. 2, 4, and 5). It is a banded dolomite marble that bears a strong resemblance to some stromatolitic dolomite marble I know from Michigan, the Proterozoic dolomite which was deposited as algal and microbial mats. These stromatolites have been found in many places worldwide and they can look very similar in many locations. The contribution of feldspars is either clastic from the original sediment or it could be authigenic, derived from precursor minerals such as clay and sea water.
Date: Sept. 7, 2021 Signature
A mixed-mineral specimen submitted under a ruby label was tested to identify its red corundum and green host minerals.
Finding: The April 20, 2022 report printed sample 92905 (#5) and found a chlorite-group mineral, likely clinochlore, corundum/ruby, spinel, zircon and a magnesium-rich pyroxene or amphibole. The exact pyroxene/amphibole species was not resolved; anthophyllite was considered a likely fit. Phlogopite was not found in the analyzed areas.
Catalog note: The printed sample ID 92905 is repeated on unrelated beryl and Australian pink-stone reports. This page identifies the April 20 ruby-association specimen by its mineral findings; the reports remain separate.
View the original report
Select a page to enlarge it. 5 pages; findings are summarized in accessible text above.
See the Ruby overview for other tested associations.
Understanding the report figures
Use this guide alongside the written findings and the original report transcript. It explains the purpose of each analytical figure and preserves the laboratory’s own figure labels. The interpretations apply to the tested specimen; signals alone do not establish the identity of every similar-looking stone.
Electron microscope image: This view shows small-scale regions selected for analysis. Its brightness contrast helps distinguish regions with different compositions; it is not a photograph of their natural colors. Numbered spots connect this view to the analyses listed in the report.
Laboratory figure caption: Fig. 2: Backscattered electron image of an area of the specimen.
Elemental spectrum: The peaks record characteristic X-ray signals from elements in the analyzed spot or area. This is an analysis of that location, not automatically of the entire specimen. Any mineral identification or uncertainty named in the laboratory caption is retained below.
Laboratory figure caption: Fig. 3: Energy dispersive spectral analysis of spot 1 in Fig. 2 (chlorite group)
Elemental spectrum: The peaks record characteristic X-ray signals from elements in the analyzed spot or area. This is an analysis of that location, not automatically of the entire specimen. Any mineral identification or uncertainty named in the laboratory caption is retained below.
Laboratory figure caption: Fig. 4: Energy dispersive spectral analysis of spot 2 in Fig. 2 (high magnesium pyroxene/amphibole)
Electron microscope image: This view shows small-scale regions selected for analysis. Its brightness contrast helps distinguish regions with different compositions; it is not a photograph of their natural colors. Numbered spots connect this view to the analyses listed in the report.
Laboratory figure caption: Fig. 5: Backscattered electron image of another area of the specimen.
Elemental spectrum: The peaks record characteristic X-ray signals from elements in the analyzed spot or area. This is an analysis of that location, not automatically of the entire specimen. Any mineral identification or uncertainty named in the laboratory caption is retained below.
Laboratory figure caption: Fig. 6: Energy dispersive spectral analysis of spot 1 in Fig. 5 (zircon)
Elemental spectrum: The peaks record characteristic X-ray signals from elements in the analyzed spot or area. This is an analysis of that location, not automatically of the entire specimen. Any mineral identification or uncertainty named in the laboratory caption is retained below.
Laboratory figure caption: Fig. 7: Energy dispersive spectral analysis of spot 2 in Fig. 5 (corundum).
Elemental spectrum: The peaks record characteristic X-ray signals from elements in the analyzed spot or area. This is an analysis of that location, not automatically of the entire specimen. Any mineral identification or uncertainty named in the laboratory caption is retained below.
Laboratory figure caption: Fig. 8: Energy dispersive spectral analysis of spot 3 in Fig. 5 (spinel).
Element map: This map shows where the named elements occur within the analyzed area. Its colors represent the laboratory’s selected element channels, rather than the specimen’s visible colors. The caption below preserves any color key or distribution noted by the laboratory.
Laboratory figure caption: Fig. 8: X-ray maps showing mganesium in red, aluminum in green and silicon in blue.
Read the original laboratory report as text
The following text and tables are transcribed from the original laboratory document. Figure captions identify the report images; the laboratory interpretations and limitations are preserved.
Laboratory report 1
Analytical Result Report
Sample id: 92905 (#5) ‘Ruby
Submitted by: K. Bitner
Date submitted: April 4, 2022.
Date completed: April 20, 2022.
Operating conditions: An AMRAY 1830 SEM operated at 25 kV acceleration potential, 26 mm working distance, 15 degrees sample tilt, coated with 250 Å carbon. Using the X-ray fluorescence attachment with 35 kV potential in conjunction with the EDS system.
Fig. 1: Photograph of the specimen. 7 cm maximum dimensions.
Fig. 2: Backscattered electron image of an area of the specimen.
Fig. 3: Energy dispersive spectral analysis of spot 1 in Fig. 2 (chlorite group)
Fig. 4: Energy dispersive spectral analysis of spot 2 in Fig. 2 (high magnesium pyroxene/amphibole)
Fig. 5: Backscattered electron image of another area of the specimen.
Fig. 6: Energy dispersive spectral analysis of spot 1 in Fig. 5 (zircon)
Fig. 7: Energy dispersive spectral analysis of spot 2 in Fig. 5 (corundum).
Fig. 8: Energy dispersive spectral analysis of spot 3 in Fig. 5 (spinel).
Fig. 8: X-ray maps showing mganesium in red, aluminum in green and silicon in blue.
Table 1: Minor and trace element composition of the specimen. (in wt. %).
Laboratory data as recorded in the report
Element
Reported value
Chromium
0.22
Iron
0.08
Titanium
0.88
Vanadium
0.13
Summary of findings: This specimen (Fig. 1) is very interesting! It is composed of a number of mineral species: a chlorite group member, likely clinochlore (Figs. 2 and 4), spinel (Figs. 5 and 8), corundum (Figs. 5 and 7), a magnesium-rich pyroxene or amphibole (enstatite or anthophyllite) (Figs. 2 and 4), the presence of aluminum indicates possibly anthophyllite would be the best fit, and minor zircon. (Figs. 5 and 6). The whole assemblage is highly aluminum and magnesium enriched and suggests a source in a metamorphic environment with a protolith of mixed pelitic , ultramafic or possibly carbonate rocks. Under these conditions, phlogopite would be an expected mineral but it was not found in the areas investigated.
Date: April 20, 2022 Signature
A Chinese disk sold as a kyanite-ruby association was analyzed to identify its component minerals.
Finding: Sample 92937 (#8), completed August 16, 2022, contains kyanite confirmed by X-ray diffraction, corundum/ruby, chlorite-group material such as clinochlore, muscovite, zircon and some apatite. Some kyanite was partially replaced by muscovite. The ruby fluoresced red under UV in the report.
Catalog note: The printed sample ID 92937 is also used on a different Dream Stone sphere report completed August 11. This page concerns the Chinese kyanite-ruby disk completed August 16. China is the supplied origin.
View the original report
Select a page to enlarge it. 6 pages; findings are summarized in accessible text above.
See the Ruby overview for other tested associations.
Understanding the report figures
Use this guide alongside the written findings and the original report transcript. It explains the purpose of each analytical figure and preserves the laboratory’s own figure labels. The interpretations apply to the tested specimen; signals alone do not establish the identity of every similar-looking stone.
Electron microscope image: This view shows small-scale regions selected for analysis. Its brightness contrast helps distinguish regions with different compositions; it is not a photograph of their natural colors. Numbered spots connect this view to the analyses listed in the report.
Laboratory figure caption: Fig. 2: Backscattered electron image of an area of the specimen.
Elemental spectrum: The peaks record characteristic X-ray signals from elements in the analyzed spot or area. This is an analysis of that location, not automatically of the entire specimen. Any mineral identification or uncertainty named in the laboratory caption is retained below.
Laboratory figure caption: Fig. 3: Energy dispersive spectral analysis of spot 1 in Fig. 2 (chlorite group species)
Elemental spectrum: The peaks record characteristic X-ray signals from elements in the analyzed spot or area. This is an analysis of that location, not automatically of the entire specimen. Any mineral identification or uncertainty named in the laboratory caption is retained below.
Laboratory figure caption: Fig. 4: Energy dispersive spectral analysis of spot 2 in Fig. 2 (aluminum silicate)
Elemental spectrum: The peaks record characteristic X-ray signals from elements in the analyzed spot or area. This is an analysis of that location, not automatically of the entire specimen. Any mineral identification or uncertainty named in the laboratory caption is retained below.
Laboratory figure caption: Fig. 5: Energy dispersive spectral analysis of spot 3 in Fig. 2 (muscovite)
Elemental spectrum: The peaks record characteristic X-ray signals from elements in the analyzed spot or area. This is an analysis of that location, not automatically of the entire specimen. Any mineral identification or uncertainty named in the laboratory caption is retained below.
Laboratory figure caption: Fig. 6: Energy dispersive spectral analysis of spot 5 in Fig. 2 (zircon)
Electron microscope image: This view shows small-scale regions selected for analysis. Its brightness contrast helps distinguish regions with different compositions; it is not a photograph of their natural colors. Numbered spots connect this view to the analyses listed in the report.
Laboratory figure caption: Fig. 7: Backscattered electron image of another area of the specimen.
Elemental spectrum: The peaks record characteristic X-ray signals from elements in the analyzed spot or area. This is an analysis of that location, not automatically of the entire specimen. Any mineral identification or uncertainty named in the laboratory caption is retained below.
Laboratory figure caption: Fig. 8: Energy dispersive spectral analysis of spot 6 in Fig. 2 (muscovite)
Electron microscope image: This view shows small-scale regions selected for analysis. Its brightness contrast helps distinguish regions with different compositions; it is not a photograph of their natural colors. Numbered spots connect this view to the analyses listed in the report.
Laboratory figure caption: Fig. 9: Backscattered electron image of another area of the specimen. Dark object on top is a marker arrow.
Elemental spectrum: The peaks record characteristic X-ray signals from elements in the analyzed spot or area. This is an analysis of that location, not automatically of the entire specimen. Any mineral identification or uncertainty named in the laboratory caption is retained below.
Laboratory figure caption: Fig. 10: Energy dispersive spectral analysis of spot 1 in Fig. 9 (corundum/ruby).
Element map: This map shows where the named elements occur within the analyzed area. Its colors represent the laboratory’s selected element channels, rather than the specimen’s visible colors. The caption below preserves any color key or distribution noted by the laboratory.
Laboratory figure caption: Fig. 11: X-ray map of the area shown in Fig. 9. Aluminum: yellow, magnesium: red, silicon: green.
Read the original laboratory report as text
The following text and tables are transcribed from the original laboratory document. Figure captions identify the report images; the laboratory interpretations and limitations are preserved.
Laboratory report 1
Analytical Result Report
Sample id: 92937 (#8, ruby/kyanite disk)
Submitted by: K. Bitner
Date submitted: July 14, 2022.
Date completed: August 16, 2022.
Operating conditions: An AMRAY 1830 SEM operated at 25 kV acceleration potential, 26 mm working distance, 15 degrees sample tilt, coated with 250 Å carbon. Using the X-ray fluorescence attachment with 35 kV potential in conjunction with the EDS system. A Bruker D2 Phaser X-ray diffractometer was used and operated at 30 kV and 10 mA.
Fig. 1: Photograph of the specimen. Approximately 12 cm maximum dimensions.
Fig. 2: Backscattered electron image of an area of the specimen.
Fig. 3: Energy dispersive spectral analysis of spot 1 in Fig. 2 (chlorite group species)
Fig. 4: Energy dispersive spectral analysis of spot 2 in Fig. 2 (aluminum silicate)
Fig. 5: Energy dispersive spectral analysis of spot 3 in Fig. 2 (muscovite)
Fig. 6: Energy dispersive spectral analysis of spot 5 in Fig. 2 (zircon)
Fig. 7: Backscattered electron image of another area of the specimen.
Fig. 8: Energy dispersive spectral analysis of spot 6 in Fig. 2 (muscovite)
Fig. 9: Backscattered electron image of another area of the specimen. Dark object on top is a marker arrow.
Fig. 10: Energy dispersive spectral analysis of spot 1 in Fig. 9 (corundum/ruby).
Fig. 11: X-ray map of the area shown in Fig. 9. Aluminum: yellow, magnesium: red, silicon: green.
Table 1: Minor and trace element composition of the specimen. (in wt. %).
Laboratory data as recorded in the report
Element
Reported value
Chromium
0.15
Iron
0.6
Magnesium
7.0
Potassium
2.1
Titanium
0.6
Zirconium
0.1
Summary of findings: This specimen (Fig. 1) is composed of chlorite group species such as clinochlore (Figs. 2 and 3), kyanite (confirmed by X-ray diffraction) (Figs. 2 and 4), muscovite (Figs. 2,5,7, and 8), corundum/ruby 9Figs. 9-11 )and zircon(Figs. 2 and 6). Some apatite is also present. Some of the kyanite is partially replaced by muscovite but some is still left which was revealed by XRD.
The corundum/ruby fluoresces the typical red (Fig. 12).
A very interesting specimen!
Date: Aug. 16, 2022 Signature
An analyzed green stone labeled Green Quartz is a rock made of quartz and magnesite.
Finding: Sample 92916 (#10), completed September 5, 2022, contains both quartz and magnesite, confirmed by X-ray diffraction and microanalysis. The green appearance does not make the whole piece a single quartz crystal.
Chromium and nickel suggest a mafic or ultramafic source for at least the magnesite. The report proposes that a peridotite or dunite-related rock underwent hydrous alteration, was brecciated, and was later cemented by hydrothermal quartz. This is an interpretation of the examined specimen's history, not a proven locality.
View the original report
Select a page to enlarge it. 4 pages; findings are summarized in accessible text above.
Use this guide alongside the written findings and the original report transcript. It explains the purpose of each analytical figure and preserves the laboratory’s own figure labels. The interpretations apply to the tested specimen; signals alone do not establish the identity of every similar-looking stone.
Electron microscope image: This view shows small-scale regions selected for analysis. Its brightness contrast helps distinguish regions with different compositions; it is not a photograph of their natural colors. Numbered spots connect this view to the analyses listed in the report.
Laboratory figure caption: Fig. 2: Backscattered electron image of an area of the specimen shown in Fig.1.
Elemental spectrum: The peaks record characteristic X-ray signals from elements in the analyzed spot or area. This is an analysis of that location, not automatically of the entire specimen. Any mineral identification or uncertainty named in the laboratory caption is retained below.
Laboratory figure caption: Fig. 3: Energy dispersive spectral analysis of spot 1 in Fig. 2 (quartz)
Elemental spectrum: The peaks record characteristic X-ray signals from elements in the analyzed spot or area. This is an analysis of that location, not automatically of the entire specimen. Any mineral identification or uncertainty named in the laboratory caption is retained below.
Laboratory figure caption: Fig. 4: Energy dispersive spectral analysis of spot 2 in Fig. 2 (magnesite)
Element map: This map shows where the named elements occur within the analyzed area. Its colors represent the laboratory’s selected element channels, rather than the specimen’s visible colors. The caption below preserves any color key or distribution noted by the laboratory.
Laboratory figure caption: Fig. 5: X-Ray map of the area shown in Fig. 2. Silicon: red, magnesium: yellow, iron: green.
Diffraction scan: This scan helps identify crystalline minerals by comparing the measured pattern with reference patterns. The laboratory interpretation explains which minerals the comparison supports.
Laboratory figure caption: Fig. 6: X-ray diffractogram of the material in the specimne. Matches indicated for quartz and magnesite.
Read the original laboratory report as text
The following text and tables are transcribed from the original laboratory document. Figure captions identify the report images; the laboratory interpretations and limitations are preserved.
Laboratory report 1
Analytical Result Report
Sample id: 92916 (#10)
Submitted by: K. Bitner
Date submitted: July 14, 2022.
Date completed: September 5, 2022.
Operating conditions: An AMRAY 1830 SEM operated at 25 kV acceleration potential, 26 mm working distance, 15 degrees sample tilt, coated with 250 Å carbon. Using the X-ray fluorescence attachment with 35 kV potential in conjunction with the EDS system. A Bruker D2 Phaser X-ray diffractometer was used and operated at 30 kV and 10 mA.
Fig. 1: Photograph of the specimen. Approximately 8 cm maximum.
Fig. 2: Backscattered electron image of an area of the specimen shown in Fig.1.
Fig. 3: Energy dispersive spectral analysis of spot 1 in Fig. 2 (quartz)
Fig. 4: Energy dispersive spectral analysis of spot 2 in Fig. 2 (magnesite)
Fig. 5: X-Ray map of the area shown in Fig. 2. Silicon: red, magnesium: yellow, iron: green.
Fig. 6: X-ray diffractogram of the material in the specimne. Matches indicated for quartz and magnesite.
Table 1: Minor and trace element composition of the specimen. (in wt. %).
Laboratory data as recorded in the report
Element
Reported value
Aluminum
4.3
Calcium
1.06
Chromium
0.3
Iron
6.2
Manganese
0.1
Nickel
0.5
Summary of findings: This specimen is interesting (Fig. 1). The mineral composition is bifold: quartz and magnesite. (Figs 2,3,4 and 6). The presence of chromium and nickel is characteristic for an origin of at least the magnesite in a mafic/ultramafic source rock. It appears that the original source rock could have been a peridotite or dunite-related rock which underwent hydrous metamorphism that produced the magnesite. A tectonic force was likely involved in brecciating it and later hydrothermal quartz recemented the material. A very interesting history of this rock!
Charoite Freeforms · Soul Body Gems, September 2024.
Charoite and its Russian home
Charoite is a rare silicate mineral known for flowing lilac-to-purple patterns. Published mineralogical research places its distinctive occurrence in the Murun Massif of Yakutia, Russia. Its rarity reflects this exceptionally restricted geological source.
The polished material can be a charoite-rich rock, called charoitite, with several companion minerals. Its light, dark and purple areas need not all be the same mineral. Our laboratory findings below document the particular accessories identified in the submitted sphere.
A purple sphere was examined to identify its principal and accessory minerals.
Finding: Sample 92936 (#11), completed August 10, 2022, is mainly charoite. The examined areas also contained an apatite-group mineral, aegirine-augite, aegirine and a calcium-rich mica such as margarite.
The report describes this as a rare metasomatic rock associated with contact between syenite and limestone in the Chara River region of southwestern Yakutia. Tinaksite and several other possible accessory minerals were not found or exposed on the surfaces examined. That observation does not rule out their presence elsewhere in the rock.
View the original report
Select a page to enlarge it. 5 pages; findings are summarized in accessible text above.
Use this guide alongside the written findings and the original report transcript. It explains the purpose of each analytical figure and preserves the laboratory’s own figure labels. The interpretations apply to the tested specimen; signals alone do not establish the identity of every similar-looking stone.
Electron microscope image: This view shows small-scale regions selected for analysis. Its brightness contrast helps distinguish regions with different compositions; it is not a photograph of their natural colors. Numbered spots connect this view to the analyses listed in the report.
Laboratory figure caption: Fig. 2: Backscattered electron image of an area of the specimen.
Elemental spectrum: The peaks record characteristic X-ray signals from elements in the analyzed spot or area. This is an analysis of that location, not automatically of the entire specimen. Any mineral identification or uncertainty named in the laboratory caption is retained below.
Laboratory figure caption: Fig. 3: Energy dispersive spectral analysis of spot 1 in Fig. 2 (Apatite group)
Elemental spectrum: The peaks record characteristic X-ray signals from elements in the analyzed spot or area. This is an analysis of that location, not automatically of the entire specimen. Any mineral identification or uncertainty named in the laboratory caption is retained below.
Laboratory figure caption: Fig. 4: Energy dispersive spectral analysis of spot 2 in Fig. 2 (charoite)
Electron microscope image: This view shows small-scale regions selected for analysis. Its brightness contrast helps distinguish regions with different compositions; it is not a photograph of their natural colors. Numbered spots connect this view to the analyses listed in the report.
Laboratory figure caption: Fig. 5: Backscattered electron image of another area of the specimen.
Elemental spectrum: The peaks record characteristic X-ray signals from elements in the analyzed spot or area. This is an analysis of that location, not automatically of the entire specimen. Any mineral identification or uncertainty named in the laboratory caption is retained below.
Laboratory figure caption: Fig. 6: Energy dispersive spectral analysis of spot 1 in Fig. 5 (a calcium-rich mica such as margarite)
Electron microscope image: This view shows small-scale regions selected for analysis. Its brightness contrast helps distinguish regions with different compositions; it is not a photograph of their natural colors. Numbered spots connect this view to the analyses listed in the report.
Laboratory figure caption: Fig. 7: Backscattered electron image of another area of the specimen.
Elemental spectrum: The peaks record characteristic X-ray signals from elements in the analyzed spot or area. This is an analysis of that location, not automatically of the entire specimen. Any mineral identification or uncertainty named in the laboratory caption is retained below.
Laboratory figure caption: Fig. 8: Energy dispersive spectral analysis of spot 1 in Fig. 7 (aegirine-augite)
Elemental spectrum: The peaks record characteristic X-ray signals from elements in the analyzed spot or area. This is an analysis of that location, not automatically of the entire specimen. Any mineral identification or uncertainty named in the laboratory caption is retained below.
Laboratory figure caption: Fig. 9: Energy dispersive spectral analysis of spot 2 in Fig. 7 (aegirine
Read the original laboratory report as text
The following text and tables are transcribed from the original laboratory document. Figure captions identify the report images; the laboratory interpretations and limitations are preserved.
Laboratory report 1
Analytical Result Report
Sample id: 92936 (#11, charoite sphere)
Submitted by: K. Bitner
Date submitted: July 14, 2022.
Date completed: August 10, 2022.
Operating conditions: An AMRAY 1830 SEM operated at 25 kV acceleration potential, 26 mm working distance, 15 degrees sample tilt, coated with 250 Å carbon. Using the X-ray fluorescence attachment with 35 kV potential in conjunction with the EDS system. A Bruker D2 Phaser X-ray diffractometer was used and operated at 30 kV and 10 mA.
Fig. 1: Photograph of the specimen. 2.8 cm maximum dimensions.
2211
Fig. 2: Backscattered electron image of an area of the specimen.
Fig. 3: Energy dispersive spectral analysis of spot 1 in Fig. 2 (Apatite group)
Fig. 4: Energy dispersive spectral analysis of spot 2 in Fig. 2 (charoite)
11
Fig. 5: Backscattered electron image of another area of the specimen.
Fig. 6: Energy dispersive spectral analysis of spot 1 in Fig. 5 (a calcium-rich mica such as margarite)
Fig. 7: Backscattered electron image of another area of the specimen.
Fig. 8: Energy dispersive spectral analysis of spot 1 in Fig. 7 (aegirine-augite)
Fig. 9: Energy dispersive spectral analysis of spot 2 in Fig. 7 (aegirine
Table 1: Minor and trace element composition of the specimen. (in wt. %).
Laboratory data as recorded in the report
Element
Reported value
Barium
0.77
Calcium
15.6
Iron
0.02
Manganese
0.05
Phosphorus
0.2
Potassium
8.9
Silicon
26.8
Sodium
2.6
Strontium
0.7
Summary of findings: This specimen (Fig. 1) is mainly made up of charoite (Figs. 2 and 4) which is a very rare mineral! This location (Chara River area, SW Yakutia) is currently not producing material anymore. A lot of accessory minerals have been reported from the site and in this very specimen, an apatite group member (Figs 2 and 3), aegirine-augite (Figs 7 and 8), aegirine (Figs 7 and 9) as well as a calcium-rich mica mineral such as margarite (Figs. 5 and 6) were identified. I was looking for tinaksite, miserite, ferdorite and others but in this specific example they did not happen to be present or to be exposed at the surface where they could be identified.
This is a fabulous example of a rare metasomatic rock which formed at the contact area between a syenite and limestone.
Lithiophilite SS rings · another September 2025 view.
These pictured ring stones are separate from sample 92854 in the older laboratory report below. Their identification has not been independently confirmed by that report.
Finding: Sample 92854 (#11), completed March 5, 2022, was identified as manganese-rich lithiophilite, with 0.69 weight percent iron. The measured density was 3.456 g/cm³, within the lithiophilite range cited in the report and below the cited triplite range. A bright red lithium flame result supported the identification.
Triplite is a different phosphate species. The report explains that their refractive indices alone are too similar to distinguish them reliably in this case.
View the original report
Select a page to enlarge it. 2 pages; findings are summarized in accessible text above.
Use this guide alongside the written findings and the original report transcript. It explains the purpose of each analytical figure and preserves the laboratory’s own figure labels. The interpretations apply to the tested specimen; signals alone do not establish the identity of every similar-looking stone.
Electron microscope image: This view shows small-scale regions selected for analysis. Its brightness contrast helps distinguish regions with different compositions; it is not a photograph of their natural colors. Numbered spots connect this view to the analyses listed in the report.
Laboratory figure caption: Fig. 2: Backscattered electron images of the specimen.
Elemental spectrum: The peaks record characteristic X-ray signals from elements in the analyzed spot or area. This is an analysis of that location, not automatically of the entire specimen. Any mineral identification or uncertainty named in the laboratory caption is retained below.
Laboratory figure caption: Fig. 3: Energy dispersive spectral analysis of spot 1 in Fig. 2. (lithiophilite)
Read the original laboratory report as text
The following text and tables are transcribed from the original laboratory document. Figure captions identify the report images; the laboratory interpretations and limitations are preserved.
Laboratory report 1
Analytical Result Report
Sample id: 92854 (#11)
Submitted by: K. Bitner
Date submitted: Feb. 14, 2022.
Date completed: March 5, 2022.
Operating conditions: An AMRAY 1830 SEM operated at 25 kV acceleration potential, 26 mm working distance, 15 degrees sample tilt, coated with 250 Å carbon. Using the X-ray fluorescence attachment with 35 kV potential in conjunction with the EDS system.
Fig. 1: Photograph of the specimen. 2-2.5 cm maximum dimensions.
Fig. 2: Backscattered electron images of the specimen.
Fig. 3: Energy dispersive spectral analysis of spot 1 in Fig. 2. (lithiophilite)
Table 1: Minor and trace element composition of the specimen. (in wt. %).
Laboratory data as recorded in the report
Element
Reported value
Aluminum
0.43
Calcium
0.04
Iron
0.69
Magnesium
0.13
Zinc
0.10
Summary of findings: This specimen (Fig. 1) is indeed lithiophilite (Figs. 2 and 3). This is a very manganese-rich lithiophilite (Table 1) with only 0.69 wt. % iron. There is another, similar phosphate species from pegmatites and that is triplite. It is however denser than lithiophilite. The density of this material was determined to be 3.456 g/cm3 which is in the range for lithiophilite (3.25-3.50 g/cm3) whereas the similar triplite ishigher (3.50-3.90 g/cm3). The refractive indices for both species are too similar to distinguishe them by but these two approaches settle it. A third tesst was performed and that was the lihtium flame color which was bright red and supports lithiophilite
This entry links to a tested specimen that may be compared with triplite, but was identified as lithiophilite.
Finding: Sample 92854 (#11), completed March 5, 2022, was identified as manganese-rich lithiophilite, not triplite. Its density of 3.456 g/cm³ and a bright red lithium flame supported the report's conclusion.
These two directory names refer to the same specimen and the same report. See Lithiophilite for the main entry.
View the original report
Select a page to enlarge it. 2 pages; findings are summarized in accessible text above.
Use this guide alongside the written findings and the original report transcript. It explains the purpose of each analytical figure and preserves the laboratory’s own figure labels. The interpretations apply to the tested specimen; signals alone do not establish the identity of every similar-looking stone.
Electron microscope image: This view shows small-scale regions selected for analysis. Its brightness contrast helps distinguish regions with different compositions; it is not a photograph of their natural colors. Numbered spots connect this view to the analyses listed in the report.
Laboratory figure caption: Fig. 2: Backscattered electron images of the specimen.
Elemental spectrum: The peaks record characteristic X-ray signals from elements in the analyzed spot or area. This is an analysis of that location, not automatically of the entire specimen. Any mineral identification or uncertainty named in the laboratory caption is retained below.
Laboratory figure caption: Fig. 3: Energy dispersive spectral analysis of spot 1 in Fig. 2. (lithiophilite)
Read the original laboratory report as text
The following text and tables are transcribed from the original laboratory document. Figure captions identify the report images; the laboratory interpretations and limitations are preserved.
Laboratory report 1
Analytical Result Report
Sample id: 92854 (#11)
Submitted by: K. Bitner
Date submitted: Feb. 14, 2022.
Date completed: March 5, 2022.
Operating conditions: An AMRAY 1830 SEM operated at 25 kV acceleration potential, 26 mm working distance, 15 degrees sample tilt, coated with 250 Å carbon. Using the X-ray fluorescence attachment with 35 kV potential in conjunction with the EDS system.
Fig. 1: Photograph of the specimen. 2-2.5 cm maximum dimensions.
Fig. 2: Backscattered electron images of the specimen.
Fig. 3: Energy dispersive spectral analysis of spot 1 in Fig. 2. (lithiophilite)
Table 1: Minor and trace element composition of the specimen. (in wt. %).
Laboratory data as recorded in the report
Element
Reported value
Aluminum
0.43
Calcium
0.04
Iron
0.69
Magnesium
0.13
Zinc
0.10
Summary of findings: This specimen (Fig. 1) is indeed lithiophilite (Figs. 2 and 3). This is a very manganese-rich lithiophilite (Table 1) with only 0.69 wt. % iron. There is another, similar phosphate species from pegmatites and that is triplite. It is however denser than lithiophilite. The density of this material was determined to be 3.456 g/cm3 which is in the range for lithiophilite (3.25-3.50 g/cm3) whereas the similar triplite ishigher (3.50-3.90 g/cm3). The refractive indices for both species are too similar to distinguishe them by but these two approaches settle it. A third tesst was performed and that was the lihtium flame color which was bright red and supports lithiophilite
Date: March 5, 2022 Signature
A 7 cm specimen submitted for mineral identification was confirmed as hemimorphite.
Finding: Sample 92931 (#12), completed August 2, 2022, was identified as hemimorphite using microscopy, energy-dispersive analysis and X-ray diffraction. The laboratory described it as comparatively clean relative to other hemimorphite it had examined.
The report notes a small amount of nickel. Its minor and trace-element table also records copper, iron, phosphorus, silicon and zinc. These values characterize this specimen; they do not establish a source locality or apply automatically to other hemimorphite.
View the original report
Select a page to enlarge it. 2 pages; findings are summarized in accessible text above.
Use this guide alongside the written findings and the original report transcript. It explains the purpose of each analytical figure and preserves the laboratory’s own figure labels. The interpretations apply to the tested specimen; signals alone do not establish the identity of every similar-looking stone.
Electron microscope image: This view shows small-scale regions selected for analysis. Its brightness contrast helps distinguish regions with different compositions; it is not a photograph of their natural colors. Numbered spots connect this view to the analyses listed in the report.
Laboratory figure caption: Fig. 2: Backscattered electron image of an area of the specimen.
Elemental spectrum: The peaks record characteristic X-ray signals from elements in the analyzed spot or area. This is an analysis of that location, not automatically of the entire specimen. Any mineral identification or uncertainty named in the laboratory caption is retained below.
Laboratory figure caption: Fig. 3: Energy dispersive spectral analysis of the area shown in Fig. 2 (hemimorphite)
Read the original laboratory report as text
The following text and tables are transcribed from the original laboratory document. Figure captions identify the report images; the laboratory interpretations and limitations are preserved.
Laboratory report 1
Analytical Result Report
Sample id: 92931 (#12, hemimorphite)
Submitted by: K. Bitner
Date submitted: July 14, 2022.
Date completed: Aug. 2, 2022.
Operating conditions: An AMRAY 1830 SEM operated at 25 kV acceleration potential, 26 mm working distance, 15 degrees sample tilt, coated with 250 Å carbon. Using the X-ray fluorescence attachment with 35 kV potential in conjunction with the EDS system. A Bruker D2 Phaser X-ray diffractometer was used and operated at 30 kV and 10 mA.
Fig. 1: Photograph of the specimen. 7 cm maximum dimensions.
Fig. 2: Backscattered electron image of an area of the specimen.
Fig. 3: Energy dispersive spectral analysis of the area shown in Fig. 2 (hemimorphite)
Table 1: Minor and trace element composition of the specimen. (in wt. %).
Laboratory data as recorded in the report
Element
Reported value
Copper
0.08
Iron
0.11
Nickel
0.05
Phosphorus
0.05
Silicon
11.43
Zinc
53.2
Summary of findings: This specimen (Fig. 1) is a very nice sample of hemimorphite. (Figs. 2 and 3). Compositionally it is also comparatively clean (Table 1), I have seen hemimorphite from other locations containing a lot more impurities. The small amount of nickel detected is interesting.
Date: Aug. 2, 2022 Signature
The red plates in this clear quartz were examined because similar material is often sold as “lepidocrocite in quartz.”
Finding: Sample 92913 (#13), completed September 9, 2022, contained red iron-oxide inclusions in quartz. The observed crystal features favored hematite, but the report did not make a conclusive species identification. Confirmatory X-ray diffraction would have required destroying the specimen.
Red color or plate-like shape alone cannot identify an inclusion. Mindat notes that many red inclusions in quartz marketed as lepidocrocite are normally hematite. This is a reason to question the market label, not proof that every such inclusion is hematite.
Use this guide alongside the written findings and the original report transcript. It explains the purpose of each analytical figure and preserves the laboratory’s own figure labels. The interpretations apply to the tested specimen; signals alone do not establish the identity of every similar-looking stone.
Electron microscope image: This view shows small-scale regions selected for analysis. Its brightness contrast helps distinguish regions with different compositions; it is not a photograph of their natural colors. Numbered spots connect this view to the analyses listed in the report.
Laboratory figure caption: Fig. 3: Backscattered electron image of an area of the specimen shown in Fig.1.
Elemental spectrum: The peaks record characteristic X-ray signals from elements in the analyzed spot or area. This is an analysis of that location, not automatically of the entire specimen. Any mineral identification or uncertainty named in the laboratory caption is retained below.
Laboratory figure caption: Fig. 4: Energy dispersive spectral analysis of spot 1 in Fig. 2 (iron oxide species)
Elemental spectrum: The peaks record characteristic X-ray signals from elements in the analyzed spot or area. This is an analysis of that location, not automatically of the entire specimen. Any mineral identification or uncertainty named in the laboratory caption is retained below.
Laboratory figure caption: Fig. 5: Energy dispersive spectral analysis of spot 2 in Fig. 3 (quartz).
Read the original laboratory report as text
The following text and tables are transcribed from the original laboratory document. Figure captions identify the report images; the laboratory interpretations and limitations are preserved.
Laboratory report 1
Analytical Result Report
Sample id: 92913 (#13)
Submitted by: K. Bitner
Date submitted: July 14, 2022.
Date completed: September 9, 2022.
Operating conditions: An AMRAY 1830 SEM operated at 25 kV acceleration potential, 26 mm working distance, 15 degrees sample tilt, coated with 250 Å carbon. Using the X-ray fluorescence attachment with 35 kV potential in conjunction with the EDS system.
Fig. 1: Photograph of the specimen. Approximately 1.8 cm maximum dimension
Fig.2: Photomicrographs of the inclusions. Width of field approximately 2.5 mm.
Fig. 3: Backscattered electron image of an area of the specimen shown in Fig.1.
Fig. 4: Energy dispersive spectral analysis of spot 1 in Fig. 2 (iron oxide species)
Fig. 5: Energy dispersive spectral analysis of spot 2 in Fig. 3 (quartz).
Table 1: Minor and trace element composition of the specimen. (in wt. %).
Laboratory data as recorded in the report
Element
Reported value
Aluminum
0.1
Iron
0.4
Summary of findings: This specimen is interesting (Fig. 1). Bright red inclusions in clear quartz (Figs. 1, 2, 3 and 5). Compositionally, the inclusions are a clean iron oxide species (Figs. 3 and 4). The options are for the red inclusions either thin plates of hematite or lepidocrocite. The close-up in the right image in Fig. 3 has an arrow pointing at evidence of rhombohedral symmetry which would be typical for hematite whereas lepidocrocite is rhombohedral and would not show these offsets at the angle shown. This could be confirmed by X-ray diffraction but would require destroying the specimen.
Date: September 9, 2022 Signature
“Lepidocrocite in quartz” is a familiar sales label for red inclusions, but appearance does not establish the mineral species.
Finding for our specimen: Sample 92913 (#13) showed iron-oxide inclusions in clear quartz. The laboratory favored hematite based on observed structure; it did not conclusively identify hematite or demonstrate that lepidocrocite is absent. Destructive X-ray diffraction was not carried out.
Mindat states that red inclusions in many quartz crystals sold as lepidocrocite are normally hematite. The names are distinct mineral species, so we avoid treating them as interchangeable. This specimen illustrates why a market name should be checked rather than assumed.
Use this guide alongside the written findings and the original report transcript. It explains the purpose of each analytical figure and preserves the laboratory’s own figure labels. The interpretations apply to the tested specimen; signals alone do not establish the identity of every similar-looking stone.
Electron microscope image: This view shows small-scale regions selected for analysis. Its brightness contrast helps distinguish regions with different compositions; it is not a photograph of their natural colors. Numbered spots connect this view to the analyses listed in the report.
Laboratory figure caption: Fig. 3: Backscattered electron image of an area of the specimen shown in Fig.1.
Elemental spectrum: The peaks record characteristic X-ray signals from elements in the analyzed spot or area. This is an analysis of that location, not automatically of the entire specimen. Any mineral identification or uncertainty named in the laboratory caption is retained below.
Laboratory figure caption: Fig. 4: Energy dispersive spectral analysis of spot 1 in Fig. 2 (iron oxide species)
Elemental spectrum: The peaks record characteristic X-ray signals from elements in the analyzed spot or area. This is an analysis of that location, not automatically of the entire specimen. Any mineral identification or uncertainty named in the laboratory caption is retained below.
Laboratory figure caption: Fig. 5: Energy dispersive spectral analysis of spot 2 in Fig. 3 (quartz).
Read the original laboratory report as text
The following text and tables are transcribed from the original laboratory document. Figure captions identify the report images; the laboratory interpretations and limitations are preserved.
Laboratory report 1
Analytical Result Report
Sample id: 92913 (#13)
Submitted by: K. Bitner
Date submitted: July 14, 2022.
Date completed: September 9, 2022.
Operating conditions: An AMRAY 1830 SEM operated at 25 kV acceleration potential, 26 mm working distance, 15 degrees sample tilt, coated with 250 Å carbon. Using the X-ray fluorescence attachment with 35 kV potential in conjunction with the EDS system.
Fig. 1: Photograph of the specimen. Approximately 1.8 cm maximum dimension
Fig.2: Photomicrographs of the inclusions. Width of field approximately 2.5 mm.
Fig. 3: Backscattered electron image of an area of the specimen shown in Fig.1.
Fig. 4: Energy dispersive spectral analysis of spot 1 in Fig. 2 (iron oxide species)
Fig. 5: Energy dispersive spectral analysis of spot 2 in Fig. 3 (quartz).
Table 1: Minor and trace element composition of the specimen. (in wt. %).
Laboratory data as recorded in the report
Element
Reported value
Aluminum
0.1
Iron
0.4
Summary of findings: This specimen is interesting (Fig. 1). Bright red inclusions in clear quartz (Figs. 1, 2, 3 and 5). Compositionally, the inclusions are a clean iron oxide species (Figs. 3 and 4). The options are for the red inclusions either thin plates of hematite or lepidocrocite. The close-up in the right image in Fig. 3 has an arrow pointing at evidence of rhombohedral symmetry which would be typical for hematite whereas lepidocrocite is rhombohedral and would not show these offsets at the angle shown. This could be confirmed by X-ray diffraction but would require destroying the specimen.
A lilac 5 cm heart sold as Purple Jade was examined to see what minerals actually make up the stone.
Finding: Sample 92930 (#14), completed August 2, 2022, contains jadeite, but also substantial albite, orthoclase, quartz and mica. The laboratory cautioned that calling the entire mixed material “jadeite” may overstate the amount of jadeite present.
Energy-dispersive analysis alone was inconclusive; X-ray diffraction and mapped domains helped resolve the mineral mixture. The report notes that the proportions might vary within the source material. Its document does not name a locality, and this result applies to the tested heart.
View the original report
Select a page to enlarge it. 5 pages; findings are summarized in accessible text above.
Use this guide alongside the written findings and the original report transcript. It explains the purpose of each analytical figure and preserves the laboratory’s own figure labels. The interpretations apply to the tested specimen; signals alone do not establish the identity of every similar-looking stone.
Electron microscope image: This view shows small-scale regions selected for analysis. Its brightness contrast helps distinguish regions with different compositions; it is not a photograph of their natural colors. Numbered spots connect this view to the analyses listed in the report.
Laboratory figure caption: Fig. 2: Backscattered electron image of an area of the specimen.
Elemental spectrum: The peaks record characteristic X-ray signals from elements in the analyzed spot or area. This is an analysis of that location, not automatically of the entire specimen. Any mineral identification or uncertainty named in the laboratory caption is retained below.
Laboratory figure caption: Fig. 3: Energy dispersive spectral analysis of spot 1 in Fig. 2 (quartz)
Elemental spectrum: The peaks record characteristic X-ray signals from elements in the analyzed spot or area. This is an analysis of that location, not automatically of the entire specimen. Any mineral identification or uncertainty named in the laboratory caption is retained below.
Laboratory figure caption: Fig. 4: Energy dispersive spectral analysis of spot 2 in Fig. 2 (mica group)
Elemental spectrum: The peaks record characteristic X-ray signals from elements in the analyzed spot or area. This is an analysis of that location, not automatically of the entire specimen. Any mineral identification or uncertainty named in the laboratory caption is retained below.
Laboratory figure caption: Fig. 4: Energy dispersive spectral analysis of spot 3 in Fig. 2 (alkali feldspar)
Diffraction scan: This scan helps identify crystalline minerals by comparing the measured pattern with reference patterns. The laboratory interpretation explains which minerals the comparison supports.
Laboratory figure caption: Fig 5: X-ray diffractogram of a portion of the material. Reference patterns are indicated for quartz, jadeite, orthoclase, albite, and a mica species, here phlogopite.
Elemental spectrum: The peaks record characteristic X-ray signals from elements in the analyzed spot or area. This is an analysis of that location, not automatically of the entire specimen. Any mineral identification or uncertainty named in the laboratory caption is retained below.
Laboratory figure caption: Fig. 7: Energy dispersive spectral analysis of a domain rich in jadeite.
Read the original laboratory report as text
The following text and tables are transcribed from the original laboratory document. Figure captions identify the report images; the laboratory interpretations and limitations are preserved.
Laboratory report 1
Analytical Result Report
Sample id: 92930 (#14, lilac heart)
Submitted by: K. Bitner
Date submitted: July 14, 2022.
Date completed: July 31, 2022.
Operating conditions: An AMRAY 1830 SEM operated at 25 kV acceleration potential, 26 mm working distance, 15 degrees sample tilt, coated with 250 Å carbon. Using the X-ray fluorescence attachment with 35 kV potential in conjunction with the EDS system. A Bruker D2 Phaser X-ray diffractometer was used and operated at 30 kV and 10 mA.
Fig. 1: Photograph of the specimen. 5 cm maximum dimensions.
Fig. 2: Backscattered electron image of an area of the specimen.
Fig. 3: Energy dispersive spectral analysis of spot 1 in Fig. 2 (quartz)
Fig. 4: Energy dispersive spectral analysis of spot 2 in Fig. 2 (mica group)
Fig. 4: Energy dispersive spectral analysis of spot 3 in Fig. 2 (alkali feldspar)
Fig 5: X-ray diffractogram of a portion of the material. Reference patterns are indicated for quartz, jadeite, orthoclase, albite, and a mica species, here phlogopite.
Fig. 6: X-ray of the area shown in Fig. 2. sodium: yellow, potassium: purple.
Fig. 7: Energy dispersive spectral analysis of a domain rich in jadeite.
Table 1: Minor and trace element composition of the specimen. (in wt. %).
Laboratory data as recorded in the report
Element
Reported value
Barium
0.03
Calcium
0.13
Iron
0.86
Strontium
0.07
Zirconium
0.16
Summary of findings: This specimen (Fig. 1) is intriguing! By Energy dispersive analyses, the results were not conclusive. Feldspars and jadeite both occur and are intimately intergrown (Fig. 6) but X-ray diffraction could resolve that albite, orthoclase, quartz as well as jadeite are present (Figs. 2 to 5). A mica species is present as well, note the typical low angle reflection in Fig. 6. Chemically, the mica is closest to muscovite though aluminum appears slightly low. It might be a little bit of a stretch to call the material jadeite since so much other mineral material is present, but it does contain at least some jadeite (Figs. 5, 6 and 7). It is also possible that there is some variability at this location with areas higher or lower in jadeite.
Date: Aug. 2, 2022 Signature
A raw specimen of the Brazilian material sold as Guava Quartz was tested before the material was made into the polished form shown in its photograph.
Finding: Sample 92914 (#15), completed August 27, 2022, is quartz-rich material with lesser aluminum, potassium, sodium, calcium and iron. The laboratory observed domains where earlier minerals had been largely replaced and suggested a highly silicified volcanic rock.
“Guava Quartz” is a market name, not a separate mineral species. The report examines the raw material. Its conclusions describe that specimen and should not be read as individual testing of every polished piece. Brazil is the source supplied for this material; the laboratory report itself does not establish geographic origin.
View the original report
Select a page to enlarge it. 3 pages; findings are summarized in accessible text above.
Use this guide alongside the written findings and the original report transcript. It explains the purpose of each analytical figure and preserves the laboratory’s own figure labels. The interpretations apply to the tested specimen; signals alone do not establish the identity of every similar-looking stone.
Electron microscope image: This view shows small-scale regions selected for analysis. Its brightness contrast helps distinguish regions with different compositions; it is not a photograph of their natural colors. Numbered spots connect this view to the analyses listed in the report.
Laboratory figure caption: Fig. 2: Backscattered electron image of an area of the specimen shown in Fig.1.
Elemental spectrum: The peaks record characteristic X-ray signals from elements in the analyzed spot or area. This is an analysis of that location, not automatically of the entire specimen. Any mineral identification or uncertainty named in the laboratory caption is retained below.
Laboratory figure caption: Fig. 3: Energy dispersive spectral analysis of spot 1 in Fig. 2 (likely highly silicified volcanic rock)
Elemental spectrum: The peaks record characteristic X-ray signals from elements in the analyzed spot or area. This is an analysis of that location, not automatically of the entire specimen. Any mineral identification or uncertainty named in the laboratory caption is retained below.
Laboratory figure caption: Fig. 4: Energy dispersive spectral analysis of spot 2 in Fig. 2 (likely highly silicified volcanic rock)
Element map: This map shows where the named elements occur within the analyzed area. Its colors represent the laboratory’s selected element channels, rather than the specimen’s visible colors. The caption below preserves any color key or distribution noted by the laboratory.
Laboratory figure caption: Fig. 5: X-Ray map of the area shown in Fig. 2. Aluminum: yellow, silicon: red, iron: green.
Read the original laboratory report as text
The following text and tables are transcribed from the original laboratory document. Figure captions identify the report images; the laboratory interpretations and limitations are preserved.
Laboratory report 1
Analytical Result Report
Sample id: 92914 (#15)
Submitted by: K. Bitner
Date submitted: July 14, 2022.
Date completed: August 26, 2022.
Operating conditions: An AMRAY 1830 SEM operated at 25 kV acceleration potential, 26 mm working distance, 15 degrees sample tilt, coated with 250 Å carbon. Using the X-ray fluorescence attachment with 35 kV potential in conjunction with the EDS system. A Bruker D2 Phaser X-ray diffractometer was used and operated at 30 kV and 10 mA.
Fig. 1: Photograph of the specimen. Approximately 10 cm maximum.
Fig. 2: Backscattered electron image of an area of the specimen shown in Fig.1.
Fig. 3: Energy dispersive spectral analysis of spot 1 in Fig. 2 (likely highly silicified volcanic rock)
Fig. 4: Energy dispersive spectral analysis of spot 2 in Fig. 2 (likely highly silicified volcanic rock)
Fig. 5: X-Ray map of the area shown in Fig. 2. Aluminum: yellow, silicon: red, iron: green.
Table 1: Minor and trace element composition of the specimen. (in wt. %).
Laboratory data as recorded in the report
Element
Reported value
Aluminum
2.9
Calcium
1.2
Iron
0.9
Magnesium
0.3
Potassium
0.8
Sodium
0.8
Titanium
0.1
Summary of findings: This specimen is interesting (Fig. 1). It reminded me of the novaculite from Arkansas, but it differs chemically. The bulk composition is quartz with lesser amounts of aluminum, potassium, sodium, calcium and iron (Figs. 2-4 and Table 1). Therea re still domains present where individual minerals were located and have now been largely replaced but the indications still prevail (Fig. 5).
Kambaba Jasper Stretch Bracelets · Soul Body Gems, September 2024.
Kambaba Jasper from Madagascar is a volcanic rock, not a fossil or stromatolite. The dark green orbicular pattern has often led to the misleading fossil claim.
Finding: Sample #16, completed September 20, 2022, was interpreted as a silicified felsic volcanic rock, possibly related to devitrified glassy material such as obsidian or rhyolite. The report explicitly concludes that the tested specimen is neither a stromatolite nor another fossil material.
Independent analyses of Kambaba material and our museum report support a volcanic, rather than fossil, origin. The laboratory describes an igneous history followed by additional silica; sodium and potassium patterns and iron-bearing green coloration support its interpretation. Madagascar is the supplied locality for this material. See the Mindat discussion of the German gemological analysis.
View the original report
Select a page to enlarge it. 4 pages; findings are summarized in accessible text above.
Use this guide alongside the written findings and the original report transcript. It explains the purpose of each analytical figure and preserves the laboratory’s own figure labels. The interpretations apply to the tested specimen; signals alone do not establish the identity of every similar-looking stone.
Electron microscope image: This view shows small-scale regions selected for analysis. Its brightness contrast helps distinguish regions with different compositions; it is not a photograph of their natural colors. Numbered spots connect this view to the analyses listed in the report.
Laboratory figure caption: Fig. 2 Backscattered electron image of an area of the specimen shown in Fig.1.
Elemental spectrum: The peaks record characteristic X-ray signals from elements in the analyzed spot or area. This is an analysis of that location, not automatically of the entire specimen. Any mineral identification or uncertainty named in the laboratory caption is retained below.
Laboratory figure caption: Fig. 3: Energy dispersive spectral analysis of spot 1 in Fig. 2 (silicified felsic vocanic rock likely)
Elemental spectrum: The peaks record characteristic X-ray signals from elements in the analyzed spot or area. This is an analysis of that location, not automatically of the entire specimen. Any mineral identification or uncertainty named in the laboratory caption is retained below.
Laboratory figure caption: Fig. 4: Energy dispersive spectral analysis of spot 2 in Fig. 3 (silicified felsic vocanic rock likely.
Electron microscope image: This view shows small-scale regions selected for analysis. Its brightness contrast helps distinguish regions with different compositions; it is not a photograph of their natural colors. Numbered spots connect this view to the analyses listed in the report.
Laboratory figure caption: Fig. 5 Backscattered electron image of an area of the specimen shown in Fig.1.
Element map: This map shows where the named elements occur within the analyzed area. Its colors represent the laboratory’s selected element channels, rather than the specimen’s visible colors. The caption below preserves any color key or distribution noted by the laboratory.
Laboratory figure caption: Fig. 6: X-ray map of the area shown in Fig. 5. Sodium: yellow, potassium purple-red.
Read the original laboratory report as text
The following text and tables are transcribed from the original laboratory document. Figure captions identify the report images; the laboratory interpretations and limitations are preserved.
Laboratory report 1
Analytical Result Report
Sample id: 92913 (#16)
Submitted by: K. Bitner
Date submitted: July 14, 2022.
Date completed: September 20, 2022.
Operating conditions: An AMRAY 1830 SEM operated at 25 kV acceleration potential, 26 mm working distance, 15 degrees sample tilt, coated with 250 Å carbon. Using the X-ray fluorescence attachment with 35 kV potential in conjunction with the EDS system.
Fig. 1: Photograph of the specimen. Approximately 56. cm maximum dimension
Fig. 2 Backscattered electron image of an area of the specimen shown in Fig.1.
Fig. 3: Energy dispersive spectral analysis of spot 1 in Fig. 2 (silicified felsic vocanic rock likely)
Fig. 4: Energy dispersive spectral analysis of spot 2 in Fig. 3 (silicified felsic vocanic rock likely.
Fig. 5 Backscattered electron image of an area of the specimen shown in Fig.1.
.
Fig. 6: X-ray map of the area shown in Fig. 5. Sodium: yellow, potassium purple-red.
Table 1: Minor and trace element composition of the specimen. (in wt. %).
Laboratory data as recorded in the report
Element
Reported value
Aluminum
5.9
Calcium
0.1
Iron
1.4
Manganese
0.1
Potassium
4.4
Sodium
2.5
Titanium
0.1
Summary of findings: This specimen is a striking specimen! The orbicular texture is very pretty and suggests an origin from devitrified glassy material. Compositionally, it resembles very much a silicified felsic volcanic rock, (Figs. 2-6 and Table 1), such as obsidian or rhyolite. Obsidian, as all glassy substances are from a geological point of view, short-lived. Most of the glassy rocks are of Cenozoic age. The presence of sodium and potassium with low calcium and magnesium further supports this conclusion. The green color is due to the iron content. This material is NOT a stromatolite nor is it any other fossil material, it is of igneous origin with a follow-up of additional silica being added, commonly, this can originate from volcanic ash. Also note the interesting X-ray map (fig. 6) and the corresponding backscattered electron image. The dark streak where the sodium if prevalent is a silica-rich streak, the material does show some banding in the X-ray map with respect to sodium and potassium
Personal Collection Release: Ukrainian Specularite · Soul Body Gems, October 2024.
A Ukrainian specimen of sparkling specular hematite shows the geological story of a metamorphosed banded iron formation.
Finding: Sample 92932 (#17), completed August 2, 2022, contains coarser crystalline hematite with specular luster, bands of quartz, some magnetite and a calcium-bearing amphibole or related pyroxene.
The laboratory describes formerly earthy hematite recrystallizing during metamorphism. This entry is specifically labeled Ukraine because specular hematite occurs in multiple localities; the result applies to this Ukrainian specimen.
View the original report
Select a page to enlarge it. 4 pages; findings are summarized in accessible text above.
Use this guide alongside the written findings and the original report transcript. It explains the purpose of each analytical figure and preserves the laboratory’s own figure labels. The interpretations apply to the tested specimen; signals alone do not establish the identity of every similar-looking stone.
Electron microscope image: This view shows small-scale regions selected for analysis. Its brightness contrast helps distinguish regions with different compositions; it is not a photograph of their natural colors. Numbered spots connect this view to the analyses listed in the report.
Laboratory figure caption: Fig. 2: Backscattered electron image of an area of the specimen.
Elemental spectrum: The peaks record characteristic X-ray signals from elements in the analyzed spot or area. This is an analysis of that location, not automatically of the entire specimen. Any mineral identification or uncertainty named in the laboratory caption is retained below.
Laboratory figure caption: Fig. 3: Energy dispersive spectral analysis of the area shown in Fig. 2 (hematite/magnetite)
Elemental spectrum: The peaks record characteristic X-ray signals from elements in the analyzed spot or area. This is an analysis of that location, not automatically of the entire specimen. Any mineral identification or uncertainty named in the laboratory caption is retained below.
Laboratory figure caption: Fig. 4: Energy dispersive spectral analysis of the area shown in Fig. 2 (quartz)
Elemental spectrum: The peaks record characteristic X-ray signals from elements in the analyzed spot or area. This is an analysis of that location, not automatically of the entire specimen. Any mineral identification or uncertainty named in the laboratory caption is retained below.
Laboratory figure caption: Fig. 5: Energy dispersive spectral analysis of the area shown in Fig. 2 (tremolite-actinolite series, could also be the pyroxene analogue)
Element map: This map shows where the named elements occur within the analyzed area. Its colors represent the laboratory’s selected element channels, rather than the specimen’s visible colors. The caption below preserves any color key or distribution noted by the laboratory.
Laboratory figure caption: Fig. 6: X-ray map of the area shown in Fig. 2. Silicon: red, iron: green, calcium: blue.
Read the original laboratory report as text
The following text and tables are transcribed from the original laboratory document. Figure captions identify the report images; the laboratory interpretations and limitations are preserved.
Laboratory report 1
Analytical Result Report
Sample id: 92932 (#17, specular hematite from Ukraine)
Submitted by: K. Bitner
Date submitted: July 14, 2022.
Date completed: Aug. 2, 2022.
Operating conditions: An AMRAY 1830 SEM operated at 25 kV acceleration potential, 26 mm working distance, 15 degrees sample tilt, coated with 250 Å carbon. Using the X-ray fluorescence attachment with 35 kV potential in conjunction with the EDS system. A Bruker D2 Phaser X-ray diffractometer was used and operated at 30 kV and 10 mA.
Fig. 1: Photograph of the specimen. Approximately 5 cm across
.
Fig. 2: Backscattered electron image of an area of the specimen.
Fig. 3: Energy dispersive spectral analysis of the area shown in Fig. 2 (hematite/magnetite)
Fig. 4: Energy dispersive spectral analysis of the area shown in Fig. 2 (quartz)
Fig. 5: Energy dispersive spectral analysis of the area shown in Fig. 2 (tremolite-actinolite series, could also be the pyroxene analogue)
Fig. 6: X-ray map of the area shown in Fig. 2. Silicon: red, iron: green, calcium: blue.
Table 1: Minor and trace element composition of the specimen. (in wt. %).
Laboratory data as recorded in the report
Element
Reported value
Aluminum
0.24
Calcium
2.44
Chromium
0.02
Cobalt
0.15
Manganese
0.05
Magnesium
1.11
Phosphorus
0.02
Vanadium
0.11
Summary of findings: This specimen (Fig. 1) is a very nice example of metamorphosed banded iron formation. The initially red, earthy hematite has become coarser crystalline and has now the luster of specular hematite (Figs. 2 and 3). Bands of quartz (Figs. 2 and 4) are typical. Some magnetite has also formed during the metamorphism. Some tremolite-actinolite (Figs. 2 and 5) or its pyroxene equivalents are also present. This composition resembles a lot the Proterozoic banded iron formations of the Great Lakes region for example. There also, some have been affected by metamorphism which produced specular hematite plus some magnetite. Very high metamorphism may result in pure hematite/magnetite deposits sich as the Champion mine in Marquette Co., Michigan.
Date: Aug. 2, 2022 Signature
A 4.5 cm banded orange specimen was tested to identify its bulk mineral composition.
Finding: Sample #20, completed September 16, 2022, consists predominantly of calcite. Minor magnesium, manganese and iron substitute within it; aluminum and silicon likely reflect clay-related impurities.
The report suggests fine-grained limestone with possible slight metamorphic overprinting. Its manganese content exceeded its iron content in the tested specimen. The visible bands may reflect grain-size differences rather than simple changes in minor-element concentration.
View the original report
Select a page to enlarge it. 3 pages; findings are summarized in accessible text above.
Use this guide alongside the written findings and the original report transcript. It explains the purpose of each analytical figure and preserves the laboratory’s own figure labels. The interpretations apply to the tested specimen; signals alone do not establish the identity of every similar-looking stone.
Electron microscope image: This view shows small-scale regions selected for analysis. Its brightness contrast helps distinguish regions with different compositions; it is not a photograph of their natural colors. Numbered spots connect this view to the analyses listed in the report.
Laboratory figure caption: Fig. 2 Backscattered electron image of an area of the specimen shown in Fig.1.
Elemental spectrum: The peaks record characteristic X-ray signals from elements in the analyzed spot or area. This is an analysis of that location, not automatically of the entire specimen. Any mineral identification or uncertainty named in the laboratory caption is retained below.
Laboratory figure caption: Fig. 3: Energy dispersive spectral analysis of spot 1 in Fig. 2 (calcite)
Elemental spectrum: The peaks record characteristic X-ray signals from elements in the analyzed spot or area. This is an analysis of that location, not automatically of the entire specimen. Any mineral identification or uncertainty named in the laboratory caption is retained below.
Laboratory figure caption: Fig. 4: Energy dispersive spectral analysis of spot 2 in Fig. 3 (calcite).
Element map: This map shows where the named elements occur within the analyzed area. Its colors represent the laboratory’s selected element channels, rather than the specimen’s visible colors. The caption below preserves any color key or distribution noted by the laboratory.
Laboratory figure caption: Fig. 5: X-ray map of the area shown in Fig. 2. Calcium: orange, aluminum: greeen, manganese: blue
Read the original laboratory report as text
The following text and tables are transcribed from the original laboratory document. Figure captions identify the report images; the laboratory interpretations and limitations are preserved.
Laboratory report 1
Analytical Result Report
Sample id: 92913 (#20)
Submitted by: K. Bitner
Date submitted: July 14, 2022.
Date completed: September 16, 2022.
Operating conditions: An AMRAY 1830 SEM operated at 25 kV acceleration potential, 26 mm working distance, 15 degrees sample tilt, coated with 250 Å carbon. Using the X-ray fluorescence attachment with 35 kV potential in conjunction with the EDS system.
Fig. 1: Photograph of the specimen. Approximately 4.5 cm maximum dimension
Fig. 2 Backscattered electron image of an area of the specimen shown in Fig.1.
Fig. 3: Energy dispersive spectral analysis of spot 1 in Fig. 2 (calcite)
Fig. 4: Energy dispersive spectral analysis of spot 2 in Fig. 3 (calcite).
.
Fig. 5: X-ray map of the area shown in Fig. 2. Calcium: orange, aluminum: greeen, manganese: blue
Table 1: Minor and trace element composition of the specimen. (in wt. %).
Laboratory data as recorded in the report
Element
Reported value
Aluminum
1.1
Iron
0.2
Magnesium
0.4
Manganese
0.9
Silicon
0.7
Summary of findings: This specimen is interesting (Fig. 1). The bulk composition is calcite (Figs. 2-4) wit minor substitution of magnesium, manganese and iron and impurities of aluminum and silicon which are likely clay species. This likely a fine-grained or micritic limestone with possibly slight metamorphic overprinting. What is interesting is the manganese content being higher than the iron content. The distribution of the minor elements is largely homogenous, the color banding noticeable is likely due to variations in grain size rather than absolute concentration of the minor substituting elements. Aluminum shows a distinct increase in rough spots and is likely to the use of aluminum oxide polishing agents.
Garden Quartz Skulls · Soul Body Gems, November 2024.
The scenic inclusions in this quartz are the reason “Garden Quartz” and “Lodolite Quartz” are used as market names for the same examined piece.
Finding: Sample 92916 (#21), completed September 20, 2022, is quartz with hematite/goethite and chlorite-group inclusions, plus a bastnäsite-group mineral. A rutile-looking crystal was suggested from its shape but could not be confirmed spectroscopically.
The laboratory described a hydrothermal-quartz assemblage. Its report discusses the rare-earth mineral as likely bastnäsite-(Ce), while noting that a precise fluorine determination was difficult. These particular inclusions belong to the tested specimen, not every stone sold as garden quartz.
Use this guide alongside the written findings and the original report transcript. It explains the purpose of each analytical figure and preserves the laboratory’s own figure labels. The interpretations apply to the tested specimen; signals alone do not establish the identity of every similar-looking stone.
Electron microscope image: This view shows small-scale regions selected for analysis. Its brightness contrast helps distinguish regions with different compositions; it is not a photograph of their natural colors. Numbered spots connect this view to the analyses listed in the report.
Laboratory figure caption: Fig. 2 Backscattered electron image of an area of the specimen shown in Fig.1.
Elemental spectrum: The peaks record characteristic X-ray signals from elements in the analyzed spot or area. This is an analysis of that location, not automatically of the entire specimen. Any mineral identification or uncertainty named in the laboratory caption is retained below.
Laboratory figure caption: Fig. 3: Energy dispersive spectral analysis of spot 1 in Fig. 2 (hematite/goethite)
Elemental spectrum: The peaks record characteristic X-ray signals from elements in the analyzed spot or area. This is an analysis of that location, not automatically of the entire specimen. Any mineral identification or uncertainty named in the laboratory caption is retained below.
Laboratory figure caption: Fig. 4: Energy dispersive spectral analysis of spot 2 in Fig. 3 (Bastnaesite).
Elemental spectrum: The peaks record characteristic X-ray signals from elements in the analyzed spot or area. This is an analysis of that location, not automatically of the entire specimen. Any mineral identification or uncertainty named in the laboratory caption is retained below.
Laboratory figure caption: Fig. 5: Energy dispersive spectral analysis of spot 2 in Fig. 3 (quartz).
Electron microscope image: This view shows small-scale regions selected for analysis. Its brightness contrast helps distinguish regions with different compositions; it is not a photograph of their natural colors. Numbered spots connect this view to the analyses listed in the report.
Laboratory figure caption: Fig. 6 Backscattered electron image of another area of the specimen shown in Fig.1.
Elemental spectrum: The peaks record characteristic X-ray signals from elements in the analyzed spot or area. This is an analysis of that location, not automatically of the entire specimen. Any mineral identification or uncertainty named in the laboratory caption is retained below.
Laboratory figure caption: Fig. 7: Energy dispersive spectral analysis of spot 2 in Fig. 6 (chlorite group).
Element map: This map shows where the named elements occur within the analyzed area. Its colors represent the laboratory’s selected element channels, rather than the specimen’s visible colors. The caption below preserves any color key or distribution noted by the laboratory.
Laboratory figure caption: Fig. 8: X-ray map of the area shown in Fig. 2. Iron: green, cerium,: purple-red.
Read the original laboratory report as text
The following text and tables are transcribed from the original laboratory document. Figure captions identify the report images; the laboratory interpretations and limitations are preserved.
Laboratory report 1
Analytical Result Report
Sample id: 92916 (#21)
Submitted by: K. Bitner
Date submitted: July 14, 2022.
Date completed: September 20, 2022.
Operating conditions: An AMRAY 1830 SEM operated at 25 kV acceleration potential, 26 mm working distance, 15 degrees sample tilt, coated with 250 Å carbon. Using the X-ray fluorescence attachment with 35 kV potential in conjunction with the EDS system.
Fig. 1: Photograph of the specimen. Approximately 4.5. cm maximum dimension
Fig. 2 Backscattered electron image of an area of the specimen shown in Fig.1.
Fig. 3: Energy dispersive spectral analysis of spot 1 in Fig. 2 (hematite/goethite)
Fig. 4: Energy dispersive spectral analysis of spot 2 in Fig. 3 (Bastnaesite).
Fig. 5: Energy dispersive spectral analysis of spot 2 in Fig. 3 (quartz).
Fig. 6 Backscattered electron image of another area of the specimen shown in Fig.1.
Fig. 7: Energy dispersive spectral analysis of spot 2 in Fig. 6 (chlorite group).
.
Fig. 8: X-ray map of the area shown in Fig. 2. Iron: green, cerium,: purple-red.
Fig. 9: Photomicrographs of inclusions in the quartz. Reddish: hematite, ochre: goethite, green: chlorite group species. Upper left shows a crysral of rutile (dark, elongated on right side of theeimage.
Table 1: Minor and trace element composition of the specimen. (in wt. %).
Laboratory data as recorded in the report
Element
Reported value
Aluminum
0.1
Iron
0.1
Titanium
0.02
Summary of findings: This specimen is intriguing! Quartz with inclusions (Figs. 1, 2 and 5) and lots of inclusions of hematite/goethite (Figs. 2, 3, 8 and 9), a rutile crystal that was identified from morphology since no good spectra could be collected and a surprise: a bastnaesite (Figs. 2, 4, and 6) group member (Bastnaesite-(Ce) as it looks like, to determine the fluorine amount is a lot trickier. A chlorite group species is present as well (Figs. 6, 7, and 9). This looks like typical hydrothermal quartz such an environment similar to an Alpine vein type assemblage.
Lodolite is another market name for the included quartz shown in the Garden Quartz entry. Both names here lead to the same tested specimen.
Finding: Sample 92916 (#21) contains quartz with hematite/goethite, chlorite-group material and a bastnäsite-group mineral. A possible rutile crystal was not verified by a good spectrum.
“Lodolite” describes an appearance or trade category, not one fixed inclusion recipe. See the Garden Quartz entry for the full context.
View the original report
Select a page to enlarge it. 5 pages; findings are summarized in accessible text above.
Use this guide alongside the written findings and the original report transcript. It explains the purpose of each analytical figure and preserves the laboratory’s own figure labels. The interpretations apply to the tested specimen; signals alone do not establish the identity of every similar-looking stone.
Electron microscope image: This view shows small-scale regions selected for analysis. Its brightness contrast helps distinguish regions with different compositions; it is not a photograph of their natural colors. Numbered spots connect this view to the analyses listed in the report.
Laboratory figure caption: Fig. 2 Backscattered electron image of an area of the specimen shown in Fig.1.
Elemental spectrum: The peaks record characteristic X-ray signals from elements in the analyzed spot or area. This is an analysis of that location, not automatically of the entire specimen. Any mineral identification or uncertainty named in the laboratory caption is retained below.
Laboratory figure caption: Fig. 3: Energy dispersive spectral analysis of spot 1 in Fig. 2 (hematite/goethite)
Elemental spectrum: The peaks record characteristic X-ray signals from elements in the analyzed spot or area. This is an analysis of that location, not automatically of the entire specimen. Any mineral identification or uncertainty named in the laboratory caption is retained below.
Laboratory figure caption: Fig. 4: Energy dispersive spectral analysis of spot 2 in Fig. 3 (Bastnaesite).
Elemental spectrum: The peaks record characteristic X-ray signals from elements in the analyzed spot or area. This is an analysis of that location, not automatically of the entire specimen. Any mineral identification or uncertainty named in the laboratory caption is retained below.
Laboratory figure caption: Fig. 5: Energy dispersive spectral analysis of spot 2 in Fig. 3 (quartz).
Electron microscope image: This view shows small-scale regions selected for analysis. Its brightness contrast helps distinguish regions with different compositions; it is not a photograph of their natural colors. Numbered spots connect this view to the analyses listed in the report.
Laboratory figure caption: Fig. 6 Backscattered electron image of another area of the specimen shown in Fig.1.
Elemental spectrum: The peaks record characteristic X-ray signals from elements in the analyzed spot or area. This is an analysis of that location, not automatically of the entire specimen. Any mineral identification or uncertainty named in the laboratory caption is retained below.
Laboratory figure caption: Fig. 7: Energy dispersive spectral analysis of spot 2 in Fig. 6 (chlorite group).
Element map: This map shows where the named elements occur within the analyzed area. Its colors represent the laboratory’s selected element channels, rather than the specimen’s visible colors. The caption below preserves any color key or distribution noted by the laboratory.
Laboratory figure caption: Fig. 8: X-ray map of the area shown in Fig. 2. Iron: green, cerium,: purple-red.
Read the original laboratory report as text
The following text and tables are transcribed from the original laboratory document. Figure captions identify the report images; the laboratory interpretations and limitations are preserved.
Laboratory report 1
Analytical Result Report
Sample id: 92916 (#21)
Submitted by: K. Bitner
Date submitted: July 14, 2022.
Date completed: September 20, 2022.
Operating conditions: An AMRAY 1830 SEM operated at 25 kV acceleration potential, 26 mm working distance, 15 degrees sample tilt, coated with 250 Å carbon. Using the X-ray fluorescence attachment with 35 kV potential in conjunction with the EDS system.
Fig. 1: Photograph of the specimen. Approximately 4.5. cm maximum dimension
Fig. 2 Backscattered electron image of an area of the specimen shown in Fig.1.
Fig. 3: Energy dispersive spectral analysis of spot 1 in Fig. 2 (hematite/goethite)
Fig. 4: Energy dispersive spectral analysis of spot 2 in Fig. 3 (Bastnaesite).
Fig. 5: Energy dispersive spectral analysis of spot 2 in Fig. 3 (quartz).
Fig. 6 Backscattered electron image of another area of the specimen shown in Fig.1.
Fig. 7: Energy dispersive spectral analysis of spot 2 in Fig. 6 (chlorite group).
.
Fig. 8: X-ray map of the area shown in Fig. 2. Iron: green, cerium,: purple-red.
Fig. 9: Photomicrographs of inclusions in the quartz. Reddish: hematite, ochre: goethite, green: chlorite group species. Upper left shows a crysral of rutile (dark, elongated on right side of theeimage.
Table 1: Minor and trace element composition of the specimen. (in wt. %).
Laboratory data as recorded in the report
Element
Reported value
Aluminum
0.1
Iron
0.1
Titanium
0.02
Summary of findings: This specimen is intriguing! Quartz with inclusions (Figs. 1, 2 and 5) and lots of inclusions of hematite/goethite (Figs. 2, 3, 8 and 9), a rutile crystal that was identified from morphology since no good spectra could be collected and a surprise: a bastnaesite (Figs. 2, 4, and 6) group member (Bastnaesite-(Ce) as it looks like, to determine the fluorine amount is a lot trickier. A chlorite group species is present as well (Figs. 6, 7, and 9). This looks like typical hydrothermal quartz such an environment similar to an Alpine vein type assemblage.
Date: September 20, 2022 Signature
A blue thumb stone sold as “Blue Obsidian” was analyzed to determine whether it was natural volcanic glass.
Finding: Sample 92904 (#3), completed April 15, 2022, was interpreted by the laboratory as man-made material, predominantly sodium-rich glassy silicate with some crystalline sodium-calcium-aluminum silicate. It is not natural obsidian.
Cobalt was detected as a possible contributor to the blue color, perhaps aided by iron and chromium. The report found no removable dye by solvent testing. A product can be blue throughout and still be manufactured glass; color alone is not proof of natural origin.
View the original report
Select a page to enlarge it. 4 pages; findings are summarized in accessible text above.
Use this guide alongside the written findings and the original report transcript. It explains the purpose of each analytical figure and preserves the laboratory’s own figure labels. The interpretations apply to the tested specimen; signals alone do not establish the identity of every similar-looking stone.
Electron microscope image: This view shows small-scale regions selected for analysis. Its brightness contrast helps distinguish regions with different compositions; it is not a photograph of their natural colors. Numbered spots connect this view to the analyses listed in the report.
Laboratory figure caption: Fig. 2: Backscattered electron images of two areas the specimen.
Elemental spectrum: The peaks record characteristic X-ray signals from elements in the analyzed spot or area. This is an analysis of that location, not automatically of the entire specimen. Any mineral identification or uncertainty named in the laboratory caption is retained below.
Laboratory figure caption: Fig. 3: Energy dispersive spectral analysis of spot 1 in Fig. 2 (sodium calcium aluminum silicate)
Elemental spectrum: The peaks record characteristic X-ray signals from elements in the analyzed spot or area. This is an analysis of that location, not automatically of the entire specimen. Any mineral identification or uncertainty named in the laboratory caption is retained below.
Laboratory figure caption: Fig. 4: Energy dispersive spectral analysis of spot 2 in Fig. 2. (sodium-rich glass
Element map: This map shows where the named elements occur within the analyzed area. Its colors represent the laboratory’s selected element channels, rather than the specimen’s visible colors. The caption below preserves any color key or distribution noted by the laboratory.
Laboratory figure caption: Fig. 5: X-ray map of the area shown in Fig. 2: Sodium: yellow, calcium: red.
Read the original laboratory report as text
The following text and tables are transcribed from the original laboratory document. Figure captions identify the report images; the laboratory interpretations and limitations are preserved.
Laboratory report 1
Analytical Result Report
Sample id: 92904 (#3) blue thumb stone
Submitted by: K. Bitner
Date submitted: April 15, 2022.
Date completed: April 115, 2022.
Operating conditions: An AMRAY 1830 SEM operated at 25 kV acceleration potential, 26 mm working distance, 15 degrees sample tilt, coated with 250 Å carbon. Using the X-ray fluorescence attachment with 35 kV potential in conjunction with the EDS system.
Fig. 1: Photograph of the specimen. 5.5 cm maximum dimensions. Right: close-uo showing diverging needles.
Fig. 2: Backscattered electron images of two areas the specimen.
Fig. 3: Energy dispersive spectral analysis of spot 1 in Fig. 2 (sodium calcium aluminum silicate)
Fig. 4: Energy dispersive spectral analysis of spot 2 in Fig. 2. (sodium-rich glass
Fig. 5: X-ray map of the area shown in Fig. 2: Sodium: yellow, calcium: red.
Fig. 6: Petrographic images: plane polarized light on the left, crossed Nichols on the right.
Table 1: Minor and trace element composition of the specimen. (in wt. %).
Laboratory data as recorded in the report
Element
Reported value
Calcium
5.10
Chromium
0.05
Cobalt
0.10
Iron
0.30
Manganese
0.02
Sodium
6.70
Summary of findings: This specimen (Fig. 1) is unusual. Some radiating fibers (Fig. 1) can be seen microscopically and in backscattered electron mode, elongate crystals are seen which tend to line up in en echelon rows (Fig. 2). These crystals are composed of a sodium calcium aluminum silicate (Figs. 2 and 3). The bulk material is a sodium rich aluminum silicate material with very high silicon content. The aluminum content is not very high, no more than 5 wt. %. An X-ray map shows elevated calcium along linear trends (Fig. 5). Under polarized light, glassy particles are the high sodium silicate materials whereas the birefringent parts are the sodium calcium silicate (Fig. 6). Thus, the sodium calcium silicate is crystalline whereas the sodium-rich silicate is a glassy material. The trace element composition (Table 1) shows cobalt as a potential blue chromophore, possibly aided by the presence of iron and chromium. I believe this is man-made material, dominantly glassy with some crystalline components. It is not dyed, nothing can be extracted with solvents.
Date: April 15, 2022 Signature
A dark sphere sold under the “Black Rose Quartz” name was examined for its mineral composition and inclusions.
Finding: Sample 92934, completed January 24, 2023, was identified as quartz with abundant fluid inclusions. The lab did not detect dumortierite or another mineral by its extended X-ray diffraction scans, and could only identify it as dark-colored quartz.
The specimen had a slightly turbid appearance reminiscent of rose quartz, but appearance alone does not verify the cause of color or establish it as a separate “black rose quartz” mineral variety. Trace iron and manganese were detected. See the alternate search name.
View the original report
Select a page to enlarge it. 3 pages; findings are summarized in accessible text above.
Use this guide alongside the written findings and the original report transcript. It explains the purpose of each analytical figure and preserves the laboratory’s own figure labels. The interpretations apply to the tested specimen; signals alone do not establish the identity of every similar-looking stone.
Elemental spectrum: The peaks record characteristic X-ray signals from elements in the analyzed spot or area. This is an analysis of that location, not automatically of the entire specimen. Any mineral identification or uncertainty named in the laboratory caption is retained below.
Laboratory figure caption: Fig. 4: Energy dispersive spectrum of spot 1 in Fig. 3. (Quartz)
Read the original laboratory report as text
The following text and tables are transcribed from the original laboratory document. Figure captions identify the report images; the laboratory interpretations and limitations are preserved.
Laboratory report 1
Analytical Result Report
Sample id: 92934 (sphere)
Submitted by: K. Bitner
Date submitted: Jan. 13, 2023.
Date completed: Jan. 24, 2023.
Operating conditions: An AMRAY 1830 SEM operated at 25 kV acceleration potential, 26 mm working distance, 15 degrees sample tilt, coated with 250 Å carbon. Using the X-ray fluorescence attachment with 35kVpotental in conjunction with the EDS system.
A Bruker Titan X-ray fluorescence spectrometer was also used and operated with 50, 25 and 10 kV.
Fig. 1: Photograph of the specimen. Approximately 5 cm maximum dimension
Fig. 2: Fluid inclusions in the specimen. Width of view approximately 2 mm.
Fig. 3: Baclscattered electron image of an area of the specimen.
Fig. 4: Energy dispersive spectrum of spot 1 in Fig. 3. (Quartz)
Table 1: Minor and trace element composition of the specimen. (in wt. %).
Laboratory data as recorded in the report
Element
Reported value
Iron
0.002
Manganese
0.01
Summary of findings: This specimen is an interesting dark quartz sphere. Fluid inclusions are seen abundantly (Fig. 2). The material has a slight turbid appearance similar to rose quartz but no inclusions of fibrous minerals such as dumortierite could be discerned. Only quartz was identified, nothing else protruded from the surface. An attempt of long running X-ray diffraction scans did not reveal any dumortierite or any other mineral but quartz. Chemically, only trace amounts of iron and manganese were detected besides silicon. At this point, it can only be said that it is a dark-colored quartz.
Date: January 24, 2023 Signature
Alternate market-name listing for the same dark quartz sphere shown under Black Rose Quartz.
Finding: Sample 92934 was confirmed as quartz, with abundant fluid inclusions. The laboratory did not identify a second mineral or determine the source of its dark color, so the precise description is dark-colored quartz.
Both directory names display the same report. See Black Rose Quartz for the fuller explanation.
View the original report
Select a page to enlarge it. 3 pages; findings are summarized in accessible text above.
Use this guide alongside the written findings and the original report transcript. It explains the purpose of each analytical figure and preserves the laboratory’s own figure labels. The interpretations apply to the tested specimen; signals alone do not establish the identity of every similar-looking stone.
Elemental spectrum: The peaks record characteristic X-ray signals from elements in the analyzed spot or area. This is an analysis of that location, not automatically of the entire specimen. Any mineral identification or uncertainty named in the laboratory caption is retained below.
Laboratory figure caption: Fig. 4: Energy dispersive spectrum of spot 1 in Fig. 3. (Quartz)
Read the original laboratory report as text
The following text and tables are transcribed from the original laboratory document. Figure captions identify the report images; the laboratory interpretations and limitations are preserved.
Laboratory report 1
Analytical Result Report
Sample id: 92934 (sphere)
Submitted by: K. Bitner
Date submitted: Jan. 13, 2023.
Date completed: Jan. 24, 2023.
Operating conditions: An AMRAY 1830 SEM operated at 25 kV acceleration potential, 26 mm working distance, 15 degrees sample tilt, coated with 250 Å carbon. Using the X-ray fluorescence attachment with 35kVpotental in conjunction with the EDS system.
A Bruker Titan X-ray fluorescence spectrometer was also used and operated with 50, 25 and 10 kV.
Fig. 1: Photograph of the specimen. Approximately 5 cm maximum dimension
Fig. 2: Fluid inclusions in the specimen. Width of view approximately 2 mm.
Fig. 3: Baclscattered electron image of an area of the specimen.
Fig. 4: Energy dispersive spectrum of spot 1 in Fig. 3. (Quartz)
Table 1: Minor and trace element composition of the specimen. (in wt. %).
Laboratory data as recorded in the report
Element
Reported value
Iron
0.002
Manganese
0.01
Summary of findings: This specimen is an interesting dark quartz sphere. Fluid inclusions are seen abundantly (Fig. 2). The material has a slight turbid appearance similar to rose quartz but no inclusions of fibrous minerals such as dumortierite could be discerned. Only quartz was identified, nothing else protruded from the surface. An attempt of long running X-ray diffraction scans did not reveal any dumortierite or any other mineral but quartz. Chemically, only trace amounts of iron and manganese were detected besides silicon. At this point, it can only be said that it is a dark-colored quartz.
Date: January 24, 2023 Signature
Common search spellings include nuummite, nuumite, nummite and Nuummit. These spelling variants refer to the name; Greenland and Finland remain separate locality guides.
A Finnish nuummite specimen from Kainuanmäki, Paltamo, Kainuu, examined for Soul Body Gems. This locality material was introduced at the Tucson Gem Show in 2026, according to Soul Body Gems’ sourcing history.
Finding: Sample 1516, completed August 12, 2025, contains abundant labradorite and the amphiboles anthophyllite and gedrite. The researcher also found minor quartz, greenalite and probable ilmenite. Pyrite, pyrrhotite and a grain of chalcopyrite were observed in another area of the specimen.
Nuummite is a rock made of multiple minerals, not a single mineral species or a crystal form. The report concludes this specimen has the characteristic mineral assemblage seen in nuummite. Its optical shimmer arises from light interacting with fine internal structures; appearance can vary with composition and lighting.
Locality and scope: These observations are for the submitted Finnish specimen. They do not establish the composition of every material marketed as nuummite.
View the original report
Select a page to enlarge it. 4 pages; findings are summarized in accessible text above.
Use this guide alongside the written findings and the original report transcript. It explains the purpose of each analytical figure and preserves the laboratory’s own figure labels. The interpretations apply to the tested specimen; signals alone do not establish the identity of every similar-looking stone.
Electron microscope image: This view shows small-scale regions selected for analysis. Its brightness contrast helps distinguish regions with different compositions; it is not a photograph of their natural colors. Numbered spots connect this view to the analyses listed in the report.
Laboratory figure caption: Fig. 2: Backscattered electron photomicrograph of the specimen.
Elemental spectrum: The peaks record characteristic X-ray signals from elements in the analyzed spot or area. This is an analysis of that location, not automatically of the entire specimen. Any mineral identification or uncertainty named in the laboratory caption is retained below.
Laboratory figure caption: Fig. 3: Energy dispersive spectrum of spot 1 in Fig. 2. (plagioclase)
Elemental spectrum: The peaks record characteristic X-ray signals from elements in the analyzed spot or area. This is an analysis of that location, not automatically of the entire specimen. Any mineral identification or uncertainty named in the laboratory caption is retained below.
Laboratory figure caption: Fig. 4: Energy dispersive spectrum of spot 2 in Fig. 2. (amphibole)
Elemental spectrum: The peaks record characteristic X-ray signals from elements in the analyzed spot or area. This is an analysis of that location, not automatically of the entire specimen. Any mineral identification or uncertainty named in the laboratory caption is retained below.
Laboratory figure caption: Fig. 5: Energy dispersive spectrum of spot 3 in Fig. 2. (iron titanium oxide)
Diffraction scan: This scan helps identify crystalline minerals by comparing the measured pattern with reference patterns. The laboratory interpretation explains which minerals the comparison supports.
The following text and tables are transcribed from the original laboratory document. Figure captions identify the report images; the laboratory interpretations and limitations are preserved.
Laboratory report 1
Analytical Result Report
Sample id: 1516 (Nuummite from Kainuanmaki, Paltamo, Kainuu, Northern Finland Region)
Submitted by: Soul Body Gems
Date completed: 8-12-2025
Operating conditions: An AMRAY 1830 scanning electron microscope was used in the study and operated at 25 kV acceleration potential
In addition, a Bruker D2-Phaser X-ray diffractometer was used and operatedat 30 kV and 10 mA.
Fig. 1: Photograph of the specimens. 6 cm maximum dimension.
Fig. 2: Backscattered electron photomicrograph of the specimen.
Fig. 3: Energy dispersive spectrum of spot 1 in Fig. 2. (plagioclase)
Fig. 4: Energy dispersive spectrum of spot 2 in Fig. 2. (amphibole)
Fig. 5: Energy dispersive spectrum of spot 3 in Fig. 2. (iron titanium oxide)
Fig. 6: X-ray diffraction scan with reference stick patterns overlaid.
Fig. 7: Photomicrograph of an area of the specimen with pyrite, pyrrhotite and chalcopyrite.
Summary of findings: This is a very interesting specimen! A calcic plagioclase, labradorite is abundant (Figs. 2 and 3). It is associated by magnesium-iron silicates (Figs. 2 and 4). Minor iron titanium oxides, likely ilmenite, were also found (Figs. 2 and 5). X-ray diffraction was very useful in determining the species and anthophyllite and gedrite were seen to be abundant. A minor presence of quartz, greenalite, and other minerals was also noted. The sample prepared for the analysis did not reveal any of the sulfides, but they are indeed present in other areas of the specimen (Fig. 7). Pyrite, pyrrhotite and a grain of chalcopyrite were detected. Thus, the specimen has the typical minerals present that are seen in nuummite.
As an optical phenomenon, schiller/adularescence exists only in the presence of light; it is a product of the interaction between light and the internal microstructures of the mineral and not a property of the mineral itself. The effect is produced by alternating layers of two types at a scale near the wavelength of light (approximately 0.5 microns)– this leads to light scattering and interference, aided by the fact that the refractive indices of the two components differ slightly. In addition, if the minerals have an inherent color, this is added to the effect. And similar material from different locations will have somewhat differing compositions and this means that some variations in color and other properties are possible.
Labradorite occurs in mafic igneous rocks and is the feldspar variety most common in basalt and gabbro. The uncommon anorthosite bodies are composed almost entirely of high calcium plagioclase. It also is found in metamorphic amphibolites and as a detrital component of some sediments.
Nuummite is usually black in color and opaque. It consists of two amphiboles, gedrite and anthophyllite, which form exsolution lamellae that give the rock its typical iridescence. Other common minerals in the rock are pyrite, pyrrhotite and chalcopyrite, which form shimmering yellow bands in polished specimens.
In Greenland the rock was formed by two consecutive metamorphic overprints of an originally igneous rock. The intrusion took place in the Archean around 2800 million years ago and the metamorphic overprint was dated at 2700 and 2500 million years ago.
Nuummite has been identified from several locations: Greenland, Finland, Mauretania.
Nummite is not a mineral but a rock. There are no nuummite crystals!
Date: 8-12-2025 Signature
A specimen from a small Brazilian pocket find, examined for its dark prismatic crystals and inclusions in quartz.
Finding: Sample 9274, specimen 2, completed June 11, 2021, is quartz with dark dravite–schorl-series tourmaline and inclusions of muscovite, potassium feldspar and fluid. The quartz had trace titanium and iron in the measured area.
The report suggests a quartz vein related to a granitic pegmatite or a pegmatite influenced by magnesium-bearing surrounding rock. “Quartz Muscovite” is a practical market label for this material, but muscovite is not the only included mineral. A separate product photograph can be added later; the original report contains the specimen image.
View the original report
Select a page to enlarge it. 5 pages; findings are summarized in accessible text above.
Use this guide alongside the written findings and the original report transcript. It explains the purpose of each analytical figure and preserves the laboratory’s own figure labels. The interpretations apply to the tested specimen; signals alone do not establish the identity of every similar-looking stone.
Electron microscope image: This view shows small-scale regions selected for analysis. Its brightness contrast helps distinguish regions with different compositions; it is not a photograph of their natural colors. Numbered spots connect this view to the analyses listed in the report.
Laboratory figure caption: Fig. 2: Backscattered electron image of sample 2.
Elemental spectrum: The peaks record characteristic X-ray signals from elements in the analyzed spot or area. This is an analysis of that location, not automatically of the entire specimen. Any mineral identification or uncertainty named in the laboratory caption is retained below.
Laboratory figure caption: Fig. 3: Energy dispersive spectral analysis of spot 1 in Fig. 2. (dravite-schorl series)
Elemental spectrum: The peaks record characteristic X-ray signals from elements in the analyzed spot or area. This is an analysis of that location, not automatically of the entire specimen. Any mineral identification or uncertainty named in the laboratory caption is retained below.
Laboratory figure caption: Fig. 4: Energy dispersive spectral analysis of spot 2 in Fig. 2. (quartz)
Electron microscope image: This view shows small-scale regions selected for analysis. Its brightness contrast helps distinguish regions with different compositions; it is not a photograph of their natural colors. Numbered spots connect this view to the analyses listed in the report.
Laboratory figure caption: Fig. 5: Backscattered electron image of another area ofsample 2.
Elemental spectrum: The peaks record characteristic X-ray signals from elements in the analyzed spot or area. This is an analysis of that location, not automatically of the entire specimen. Any mineral identification or uncertainty named in the laboratory caption is retained below.
Laboratory figure caption: Fig. 6 : Energy dispersive spectral analysis of spot 1 in Fig. 5. (potassium feldspar)
Electron microscope image: This view shows small-scale regions selected for analysis. Its brightness contrast helps distinguish regions with different compositions; it is not a photograph of their natural colors. Numbered spots connect this view to the analyses listed in the report.
Laboratory figure caption: Fig. 7: Backscattered electron image of another area ofs ample 2.
Elemental spectrum: The peaks record characteristic X-ray signals from elements in the analyzed spot or area. This is an analysis of that location, not automatically of the entire specimen. Any mineral identification or uncertainty named in the laboratory caption is retained below.
Laboratory figure caption: Fig. 8 : Energy dispersive spectral analysis of spot 1 in Fig. 5. (muscovite)
Read the original laboratory report as text
The following text and tables are transcribed from the original laboratory document. Figure captions identify the report images; the laboratory interpretations and limitations are preserved.
Laboratory report 1
Analytical Result Report
Sample id: 9274 (sample 2)
Submitted by: K. Bitner
Date submitted: June 2, 2021.
Date completed: June 11, 2021.
Operating conditions: An AMRAY 1830 SEM operated at 25 kV acceleration potential, 26 mm working distance, 15 degrees sample tilt, coated with 250 Å carbon. Using the X-ray fluorescence attachment with 35kVpotental in conjunction with the EDS system.
Fig. 1: Photograph of the specimens #2, 6 cm maximum.
Fig. 2: Backscattered electron image of sample 2.
Fig. 3: Energy dispersive spectral analysis of spot 1 in Fig. 2. (dravite-schorl series)
Fig. 4: Energy dispersive spectral analysis of spot 2 in Fig. 2. (quartz)
Fig. 5: Backscattered electron image of another area ofsample 2.
Fig. 6 : Energy dispersive spectral analysis of spot 1 in Fig. 5. (potassium feldspar)
Fig. 7: Backscattered electron image of another area ofs ample 2.
Fig. 8 : Energy dispersive spectral analysis of spot 1 in Fig. 5. (muscovite)
Fig. 9: Photomicrographs of the dravite-schorl and muscovite/potassium feldspar inclusions. 2 mm width of view in each image.
Summary of findings: This is a beautiful specimen: (Fig. 1). Most noticeable are the dark prismatic crystals on the quartz (Figs. 2-4 and Fig. 9). Besides lots of fluid inclusions, there are also inclusions of potassium feldspar (Figs. 5 and 6 and Fig. 9) and muscovite (Figs. 7-9). The quartz itself only contains traces of titanium (170 ppm) and iron (110 ppm). Specimens like this are likely found in quartz veins closely associated with granitic pegmatites or in pegmatites that have assimilated sufficient amounts of mafic country rock which would bring up the magnesium. Phlogopite is a mineral more typical for metamorphic rocks that had a provenance of a mafic igneous rock.
Date: June 11, 2021 Signature
A white Indonesian material marketed as Snow Quartz and described to us as a newer find.
Finding: Sample 9274, specimen 4, completed June 15, 2021, consists of coarse quartz and fine-grained chalcedony. The reported impurity was 120 ppm iron; ultraviolet fluorescence was weak.
The swirled textures, delicate banding and small quartz-lined cavities led the researcher to suggest an earlier hydrous silica stage that later became chalcedony and quartz. This is an interpretation of how the submitted specimen formed.
Market note: Indonesian white silica material can take dye readily, and colorful pieces offered as naturally colored “Snow Quartz” should be evaluated carefully. This particular report documents the tested white specimen; it did not test colored pieces or establish that every colorful specimen is dyed.
View the original report
Select a page to enlarge it. 3 pages; findings are summarized in accessible text above.
Use this guide alongside the written findings and the original report transcript. It explains the purpose of each analytical figure and preserves the laboratory’s own figure labels. The interpretations apply to the tested specimen; signals alone do not establish the identity of every similar-looking stone.
Electron microscope image: This view shows small-scale regions selected for analysis. Its brightness contrast helps distinguish regions with different compositions; it is not a photograph of their natural colors. Numbered spots connect this view to the analyses listed in the report.
Laboratory figure caption: Fig. 2: Backscattered electron image of sample 4.
Elemental spectrum: The peaks record characteristic X-ray signals from elements in the analyzed spot or area. This is an analysis of that location, not automatically of the entire specimen. Any mineral identification or uncertainty named in the laboratory caption is retained below.
Laboratory figure caption: Fig. 3: Energy dispersive spectral analysis of spot 1 in Fig. 2. (quartz)
Elemental spectrum: The peaks record characteristic X-ray signals from elements in the analyzed spot or area. This is an analysis of that location, not automatically of the entire specimen. Any mineral identification or uncertainty named in the laboratory caption is retained below.
Laboratory figure caption: Fig. 4: Energy dispersive spectral analysis of spot 2 in Fig. 2. (quartz)
Read the original laboratory report as text
The following text and tables are transcribed from the original laboratory document. Figure captions identify the report images; the laboratory interpretations and limitations are preserved.
Laboratory report 1
Analytical Result Report
Sample id: 9274 (sample 4)
Submitted by: K. Bitner
Date submitted: June 2, 2021.
Date completed: June 15, 2021.
Operating conditions: An AMRAY 1830 SEM operated at 25 kV acceleration potential, 26 mm working distance, 15 degrees sample tilt, coated with 250 Å carbon. Using the X-ray fluorescence attachment with 35kVpotental in conjunction with the EDS system.
Fig. 1: Photograph of the specimens #4, 6 cm maximum dimension.
Fig. 2: Backscattered electron image of sample 4.
Fig. 3: Energy dispersive spectral analysis of spot 1 in Fig. 2. (quartz)
Fig. 4: Energy dispersive spectral analysis of spot 2 in Fig. 2. (quartz)
Fig. 5: Photomicrographs of specimen. Left: quartz crystal-lined cavity, right: swirly texture with minor banding.
Fig. 6: The specimen under UV light (both short and long wave UV).
Summary of findings: This is a beautiful specimen! (Fig. 1). It is composed of quartz, both coarse and fine grained (chalcedony) (Figs 2-5). The only impurity detected was 120 ppm of iron. UV fluorescence is not pronounced (Fig. 6).
This likely had its origin as a gel, opal essentially, that eventually dried out and formed chalcedony and even some little quartz crystals in cavities (Fig. 5). The swirly textures and thin banding around coarser crystallized portion indicate formation from a material that was hydrous silica, basically opal. The lack of intense green UV fluorescence (Fig. 6)indicates a lack of uranium which is often present when chalcedony forms but in this case, it was lacking.
Date: June 15, 2021 Signature
An unnamed heart-shaped specimen from Pakistan examined to identify its main components.
Finding: Sample 8114, completed April 14, 2020, is a coarse-grained amphibole- and plagioclase-rich metamorphic rock, essentially amphibolite. Clay alteration was noted at contacts between amphibole and plagioclase.
The researcher interpreted a mafic precursor, such as basalt. “Mystery Stone 3” is a directory label for the submitted specimen, not a formal mineral name. Other unnamed materials require separate identification.
View the original report
Select a page to enlarge it. 2 pages; findings are summarized in accessible text above.
Use this guide alongside the written findings and the original report transcript. It explains the purpose of each analytical figure and preserves the laboratory’s own figure labels. The interpretations apply to the tested specimen; signals alone do not establish the identity of every similar-looking stone.
Electron microscope image: This view shows small-scale regions selected for analysis. Its brightness contrast helps distinguish regions with different compositions; it is not a photograph of their natural colors. Numbered spots connect this view to the analyses listed in the report.
Laboratory figure caption: Fig 1: Backscattered electron photomicrograph of area 1 in sample 8114.
Elemental spectrum: The peaks record characteristic X-ray signals from elements in the analyzed spot or area. This is an analysis of that location, not automatically of the entire specimen. Any mineral identification or uncertainty named in the laboratory caption is retained below.
Laboratory figure caption: Fig. 2: Energy dispersive spectrum of spot 1 in Fig. 1. (plagioclase feldspar)
Elemental spectrum: The peaks record characteristic X-ray signals from elements in the analyzed spot or area. This is an analysis of that location, not automatically of the entire specimen. Any mineral identification or uncertainty named in the laboratory caption is retained below.
Laboratory figure caption: Fig. 3: Energy dispersive spectrum of spot 2 in Fig. 1. (amphibole)
Read the original laboratory report as text
The following text and tables are transcribed from the original laboratory document. Figure captions identify the report images; the laboratory interpretations and limitations are preserved.
Laboratory report 1
Analytical Result Report
Sample id: 8114 Pakistan heart
Submitted by: Kathreen Bitner
Date submitted: April 10, 2020
Date completed: April 14, 2020
Operating conditions: JEOL JSM-6400 operated at 25 kV acceleration potential, 15 mm working distance, 15 degrees sample tilt, coated with 250 Å carbon. Using the X-ray fluorescence attacement with 35kv potental in conjunction with the EDS system
Fig 1: Backscattered electron photomicrograph of area 1 in sample 8114.
Fig. 2: Energy dispersive spectrum of spot 1 in Fig. 1. (plagioclase feldspar)
Fig. 3: Energy dispersive spectrum of spot 2 in Fig. 1. (amphibole)
Summary of findings: This material is a coarse-grained amphibole/plagioclase-rich rock. Essentially a coarse-grained amphibolite, a metamorphic rock that had a mafic rock as protolith, such as a basalt. Around the amphiboles in contact with the plagioclase, some clay alteration is present, as seen in spot 3 in Fig. 1.
Date: 4-14-2020 Signature
A large brown tower tested to identify its composition and likely origin.
Finding: Sample 9115, completed July 6, 2020, was described as brown jasper with 3,300 ppm iron, 280 ppm titanium and 85 ppm manganese.
The researcher found no aluminum signal suggesting silicified rhyolite and favored a sedimentary setting. “Mystery Stone 4” is our directory label for this specific tower, not a mineral species.
View the original report
Select a page to enlarge it. 2 pages; findings are summarized in accessible text above.
Use this guide alongside the written findings and the original report transcript. It explains the purpose of each analytical figure and preserves the laboratory’s own figure labels. The interpretations apply to the tested specimen; signals alone do not establish the identity of every similar-looking stone.
Electron microscope image: This view shows small-scale regions selected for analysis. Its brightness contrast helps distinguish regions with different compositions; it is not a photograph of their natural colors. Numbered spots connect this view to the analyses listed in the report.
Laboratory figure caption: Fig. 1: Backscattered electron image (large brown tower)
Elemental spectrum: The peaks record characteristic X-ray signals from elements in the analyzed spot or area. This is an analysis of that location, not automatically of the entire specimen. Any mineral identification or uncertainty named in the laboratory caption is retained below.
Laboratory figure caption: Fig. 2: Energy dispersive spectrum of spot 1 in Fig. 1. (jasper).
Read the original laboratory report as text
The following text and tables are transcribed from the original laboratory document. Figure captions identify the report images; the laboratory interpretations and limitations are preserved.
Laboratory report 1
Analytical Result Report
Sample id: 9115 (large brown tower)
Submitted by: K.Bitner
Date submitted: June 24, 2020
Date completed: July 6, 2020
Operating conditions: JEOL JSM-6400 operated at 25 kV acceleration potential, 15 mm working distance, 15 degrees sample tilt, coated with 250 Å carbon. Using the X-ray fluorescence attachment with 35kv potental in conjunction with the EDS system.
Fig. 1: Backscattered electron image (large brown tower)
Fig. 2: Energy dispersive spectrum of spot 1 in Fig. 1. (jasper).
Summary of findings: A nice brown jasper tower with 3300 ppm iron, 280 ppm titanium and 85 ppm manganese. Since no indications (such as aluminum) are present to suggest a silicified rhyolite, it appears that is formed in a sedimentary environment.
Date: July 6 ,2020 Signature
A white-and-gray palm stone with distinct mineral assemblages in its two areas.
Finding: Sample 9118, completed July 6, 2020, has a white portion mainly of albite and potassium feldspar, likely microcline, with minor zircon and nepheline. Its darker portion contains nepheline–kalsilite solid solution and a scapolite-group mineral, dominantly marialite.
This complex assemblage is reported for the examined areas of this specimen. The directory label does not imply a single mineral identity.
View the original report
Select a page to enlarge it. 4 pages; findings are summarized in accessible text above.
Use this guide alongside the written findings and the original report transcript. It explains the purpose of each analytical figure and preserves the laboratory’s own figure labels. The interpretations apply to the tested specimen; signals alone do not establish the identity of every similar-looking stone.
Electron microscope image: This view shows small-scale regions selected for analysis. Its brightness contrast helps distinguish regions with different compositions; it is not a photograph of their natural colors. Numbered spots connect this view to the analyses listed in the report.
Laboratory figure caption: Fig. 1: Backscattered electron image (palm stone)
Elemental spectrum: The peaks record characteristic X-ray signals from elements in the analyzed spot or area. This is an analysis of that location, not automatically of the entire specimen. Any mineral identification or uncertainty named in the laboratory caption is retained below.
Laboratory figure caption: Fig. 2: Energy dispersive spectrum of spot 1 in Fig. 1. (potassium feldspar).
Elemental spectrum: The peaks record characteristic X-ray signals from elements in the analyzed spot or area. This is an analysis of that location, not automatically of the entire specimen. Any mineral identification or uncertainty named in the laboratory caption is retained below.
Laboratory figure caption: Fig. 3: Energy dispersive spectrum of spot 2 in Fig. 1. (albite).
Elemental spectrum: The peaks record characteristic X-ray signals from elements in the analyzed spot or area. This is an analysis of that location, not automatically of the entire specimen. Any mineral identification or uncertainty named in the laboratory caption is retained below.
Laboratory figure caption: Fig. 4: Energy dispersive spectrum of spot 3 in Fig. 1. (nepheline).
Electron microscope image: This view shows small-scale regions selected for analysis. Its brightness contrast helps distinguish regions with different compositions; it is not a photograph of their natural colors. Numbered spots connect this view to the analyses listed in the report.
Laboratory figure caption: Fig. 5: Backscattered electron image (palm stone)
Elemental spectrum: The peaks record characteristic X-ray signals from elements in the analyzed spot or area. This is an analysis of that location, not automatically of the entire specimen. Any mineral identification or uncertainty named in the laboratory caption is retained below.
Laboratory figure caption: Fig. 6: Energy dispersive spectrum of spot 1 in Fig. 5. (zircon).
Electron microscope image: This view shows small-scale regions selected for analysis. Its brightness contrast helps distinguish regions with different compositions; it is not a photograph of their natural colors. Numbered spots connect this view to the analyses listed in the report.
Laboratory figure caption: Fig. 7: Backscattered electron image (palm stone)
Elemental spectrum: The peaks record characteristic X-ray signals from elements in the analyzed spot or area. This is an analysis of that location, not automatically of the entire specimen. Any mineral identification or uncertainty named in the laboratory caption is retained below.
Laboratory figure caption: Fig. 8: Energy dispersive spectrum of area 1 in Fig. 7. (nepheline/kalsilite).
Elemental spectrum: The peaks record characteristic X-ray signals from elements in the analyzed spot or area. This is an analysis of that location, not automatically of the entire specimen. Any mineral identification or uncertainty named in the laboratory caption is retained below.
Laboratory figure caption: Fig. 9: Energy dispersive spectrum of spot 3 in Fig. 7. (scapolite group species, such as marialite).
Read the original laboratory report as text
The following text and tables are transcribed from the original laboratory document. Figure captions identify the report images; the laboratory interpretations and limitations are preserved.
Laboratory report 1
Analytical Result Report
Sample id: 9118 (palm stone)
Submitted by: K.Bitner
Date submitted: June 24, 2020
Date completed: July 6, 2020
Operating conditions: JEOL JSM-6400 operated at 25 kV acceleration potential, 15 mm working distance, 15 degrees sample tilt, coated with 250 Å carbon. Using the X-ray fluorescence attachment with 35kv potental in conjunction with the EDS system.
Fig. 1: Backscattered electron image (palm stone)
Fig. 2: Energy dispersive spectrum of spot 1 in Fig. 1. (potassium feldspar).
Fig. 3: Energy dispersive spectrum of spot 2 in Fig. 1. (albite).
Fig. 4: Energy dispersive spectrum of spot 3 in Fig. 1. (nepheline).
Fig. 5: Backscattered electron image (palm stone)
Fig. 6: Energy dispersive spectrum of spot 1 in Fig. 5. (zircon).
Fig. 7: Backscattered electron image (palm stone)
Fig. 8: Energy dispersive spectrum of area 1 in Fig. 7. (nepheline/kalsilite).
Fig. 9: Energy dispersive spectrum of spot 3 in Fig. 7. (scapolite group species, such as marialite).
Summary of findings: This specimen is most interesting! The white area (Figs. 1-6) are mainly composed of albite (Figs. 1 and 3), a potassium feldspar (Figs. 1 and 2), likely microcline with minor zircon (Figs. 5 and 6) and nepheline (Figs. 1 and 4). The dark portion appear to be a solid solution of nepheline and kalsilite (Figs 7 and 8) with some scapolite group species (marialite dominantly). Trace elements in the white area include 373 ppm strontium, 976 ppm iron, 379 ppm zirconium and 2010 ppm titanium. In the gray area, it contains 2200 ppm iron, 55 ppm strontium and 300 ppm titanium.
Date: July 6 ,2020 Signature
A purple-and-white tower supplied from Afghanistan.
Finding: Sample 9147, completed July 16, 2020, contains clean calcite in the white region and quartz, partly amethyst, in the purplish region.
The researcher suggested a possible hydrothermal vein environment. The two colors represent different minerals in this tested tower.
View the original report
Select a page to enlarge it. 2 pages; findings are summarized in accessible text above.
Use this guide alongside the written findings and the original report transcript. It explains the purpose of each analytical figure and preserves the laboratory’s own figure labels. The interpretations apply to the tested specimen; signals alone do not establish the identity of every similar-looking stone.
Electron microscope image: This view shows small-scale regions selected for analysis. Its brightness contrast helps distinguish regions with different compositions; it is not a photograph of their natural colors. Numbered spots connect this view to the analyses listed in the report.
Elemental spectrum: The peaks record characteristic X-ray signals from elements in the analyzed spot or area. This is an analysis of that location, not automatically of the entire specimen. Any mineral identification or uncertainty named in the laboratory caption is retained below.
Laboratory figure caption: Fig. 2: Energy dispersive spectrum of spot 1 in Fig. 1. (calcite).
Elemental spectrum: The peaks record characteristic X-ray signals from elements in the analyzed spot or area. This is an analysis of that location, not automatically of the entire specimen. Any mineral identification or uncertainty named in the laboratory caption is retained below.
Laboratory figure caption: Fig. 3: Energy dispersive spectrum of spot 2 in Fig. 1. (quartz).
Read the original laboratory report as text
The following text and tables are transcribed from the original laboratory document. Figure captions identify the report images; the laboratory interpretations and limitations are preserved.
Laboratory report 1
Analytical Result Report
Sample id: 9147 (#4 purple/white tower Afghan)
Submitted by: K. Bitner
Date submitted: July 13, 2020
Date completed: July 16, 2020
Operating conditions: JEOL JSM-6400 operated at 25 kV acceleration potential, 15 mm working distance, 15 degrees sample tilt, coated with 250 Å carbon. Using the X-ray fluorescence attachment with 35kv potental in conjunction with the EDS system.
Fig. 1: Backscattered electron image (purple/white tower Afghan)
Fig. 2: Energy dispersive spectrum of spot 1 in Fig. 1. (calcite).
Fig. 3: Energy dispersive spectrum of spot 2 in Fig. 1. (quartz).
Summary of findings: This is a specimen that surprised me. The white portion is very clean calcite (Figs. 1 and 2) (240 ppm iron, 50 ppm manganese) whereas the purplish portion is quartz (Figs. and 3), essentially amethyst in part. The iron content is a little higher (400 ppm) and no manganese detectable. This material could have come from a hydrothermal vein environment.
Russian Chalcedony Towers · Soul Body Gems, September 2024.
A green-and-brown tumbled stone supplied from Russia.
Finding: Sample 9144, completed July 16, 2020, is predominantly quartz with minor iron- and chromium-bearing muscovite. The report found no phosphorus or copper and concluded the specimen is not turquoise.
The researcher linked the green/brown differences to iron oxidation state and possibly chromium-bearing mica. That interpretation applies to this one sample.
View the original report
Select a page to enlarge it. 3 pages; findings are summarized in accessible text above.
Use this guide alongside the written findings and the original report transcript. It explains the purpose of each analytical figure and preserves the laboratory’s own figure labels. The interpretations apply to the tested specimen; signals alone do not establish the identity of every similar-looking stone.
Electron microscope image: This view shows small-scale regions selected for analysis. Its brightness contrast helps distinguish regions with different compositions; it is not a photograph of their natural colors. Numbered spots connect this view to the analyses listed in the report.
Laboratory figure caption: Fig. 1: Backscattered electron image (Russian tumble green/brown, brown area)
Elemental spectrum: The peaks record characteristic X-ray signals from elements in the analyzed spot or area. This is an analysis of that location, not automatically of the entire specimen. Any mineral identification or uncertainty named in the laboratory caption is retained below.
Laboratory figure caption: Fig. 2: Energy dispersive spectrum of spot 1 in Fig. 1. (quartz).
Elemental spectrum: The peaks record characteristic X-ray signals from elements in the analyzed spot or area. This is an analysis of that location, not automatically of the entire specimen. Any mineral identification or uncertainty named in the laboratory caption is retained below.
Laboratory figure caption: Fig. 2: Energy dispersive spectrum of spot 2 in Fig. 1. (chromium-bearing muscovite).
Electron microscope image: This view shows small-scale regions selected for analysis. Its brightness contrast helps distinguish regions with different compositions; it is not a photograph of their natural colors. Numbered spots connect this view to the analyses listed in the report.
Laboratory figure caption: Fig. 3: Backscattered electron image (Russian tumble green/brown, green area)
Elemental spectrum: The peaks record characteristic X-ray signals from elements in the analyzed spot or area. This is an analysis of that location, not automatically of the entire specimen. Any mineral identification or uncertainty named in the laboratory caption is retained below.
Laboratory figure caption: Fig. 4: Energy dispersive spectrum of spot 1 in Fig. 4
Read the original laboratory report as text
The following text and tables are transcribed from the original laboratory document. Figure captions identify the report images; the laboratory interpretations and limitations are preserved.
Laboratory report 1
Analytical Result Report
Sample id: 9144 (#1green brown Russian tumble)
Submitted by: K. Bitner
Date submitted: July 13, 2020
Date completed: July 16, 2020
Operating conditions: JEOL JSM-6400 operated at 25 kV acceleration potential, 15 mm working distance, 15 degrees sample tilt, coated with 250 Å carbon. Using the X-ray fluorescence attachment with 35kv potental in conjunction with the EDS system.
Fig. 1: Backscattered electron image (Russian tumble green/brown, brown area)
Fig. 2: Energy dispersive spectrum of spot 1 in Fig. 1. (quartz).
Fig. 2: Energy dispersive spectrum of spot 2 in Fig. 1. (chromium-bearing muscovite).
Fig. 3: Backscattered electron image (Russian tumble green/brown, green area)
Fig. 4: Energy dispersive spectrum of spot 1 in Fig. 4
Summary of findings: Interesting stone! Compositionally, it is made up dominantly of quartz with minor muscovite which is iron bearing as well as chromium bearing. XF trace element analysis yields similar results for the brown and green areas: Fe 9300 ppm in the brown and 9100 ppm in the green areas, Chromium and titanium are both in the 1300 ppm range in both areas. What is not present is phosphorus! Nor is there any cooper and insufficient aluminum present! Thus, it can’t be turquoise! The color difference is likely related to the oxidation state of iron, trivalent results in brown color, divalent in green color, possibly supported by the green chromium muscovite.
Date: July 16 ,2020 Signature
Now indexed in our collection as Russian Chalcedony; formerly Mystery Stone 7 (Russia). The original specimen report remains available above.
An Australian Noreena Jasper palm stone examined for its banding, fracture fillings and color.
Finding: Sample 9145, completed July 16, 2020, was interpreted as silicified mudstone or silicified volcanic rock, possibly a mixture. Fractures contain hematite or goethite, and the specimen had a weak magnetic response suggesting a little magnetite.
The report describes late Archean material and notes that the brown coloration may have developed through later oxidation. The findings apply to this palm stone; Noreena Jasper is a locality market name rather than a mineral species.
View the original report
Select a page to enlarge it. 2 pages; findings are summarized in accessible text above.
Use this guide alongside the written findings and the original report transcript. It explains the purpose of each analytical figure and preserves the laboratory’s own figure labels. The interpretations apply to the tested specimen; signals alone do not establish the identity of every similar-looking stone.
Electron microscope image: This view shows small-scale regions selected for analysis. Its brightness contrast helps distinguish regions with different compositions; it is not a photograph of their natural colors. Numbered spots connect this view to the analyses listed in the report.
Laboratory figure caption: Fig. 1: Backscattered electron image (Noreena jasper)
Elemental spectrum: The peaks record characteristic X-ray signals from elements in the analyzed spot or area. This is an analysis of that location, not automatically of the entire specimen. Any mineral identification or uncertainty named in the laboratory caption is retained below.
Laboratory figure caption: Fig. 2: Energy dispersive spectrum of spot 1 in Fig. 1. (silicified mudstone or silicified volcanic rock).
Elemental spectrum: The peaks record characteristic X-ray signals from elements in the analyzed spot or area. This is an analysis of that location, not automatically of the entire specimen. Any mineral identification or uncertainty named in the laboratory caption is retained below.
Laboratory figure caption: Fig. 2: Energy dispersive spectrum of spot 2 in Fig. 1. (silicified mudstone or silicified volcanic rock).
Elemental spectrum: The peaks record characteristic X-ray signals from elements in the analyzed spot or area. This is an analysis of that location, not automatically of the entire specimen. Any mineral identification or uncertainty named in the laboratory caption is retained below.
Laboratory figure caption: Fig. 3: Energy dispersive spectrum of spot 3 in Fig. 1. (silicified mudstone or silicified volcanic rock).
Read the original laboratory report as text
The following text and tables are transcribed from the original laboratory document. Figure captions identify the report images; the laboratory interpretations and limitations are preserved.
Laboratory report 1
Analytical Result Report
Sample id: 9145 (#2 Noreena jasper palm)
Submitted by: K. Bitner
Date submitted: July 13, 2020
Date completed: July 16, 2020
Operating conditions: JEOL JSM-6400 operated at 25 kV acceleration potential, 15 mm working distance, 15 degrees sample tilt, coated with 250 Å carbon. Using the X-ray fluorescence attachment with 35kv potental in conjunction with the EDS system.
Fig. 1: Backscattered electron image (Noreena jasper)
Fig. 2: Energy dispersive spectrum of spot 1 in Fig. 1. (silicified mudstone or silicified volcanic rock).
Fig. 2: Energy dispersive spectrum of spot 2 in Fig. 1. (silicified mudstone or silicified volcanic rock).
Fig. 3: Energy dispersive spectrum of spot 3 in Fig. 1. (silicified mudstone or silicified volcanic rock).
Summary of findings: This is a very old specimen, late Archaean. It is essentially a silicified mudstone of silicified volcanic rock, possibly a mixture of each (Figs. 1-3). The fractures are filled with hematite or goethite and the color is a result of trivalent iron which imparts the tan to brown colors. Total iron content is around 7000-8200 ppm. Manganese is very low, only about 120 ppm. The weak magnetic response suggests that a little magnetite is present as well, thus a little divalent iron is left. At the end of the Archaean, only very little free oxygen was present, it is very possible that the brown colors are the result of much later oxidation.
Sunstone Moonstone (Tanzania) · Soul Body Gems, July 2024.
A Tanzanian material with the optical effects associated with both moonstone and sunstone, examined for Soul Body Gems.
Finding: Sample 9234, completed April 6, 2021, has a potassium feldspar groundmass interpreted as microcline with exsolved sodic plagioclase lamellae, likely albite-rich. Hematite inclusions and a distinct schiller effect were also documented.
The report concludes that the submitted specimen displays both sunstone-like effects from hematite and moonstone-like schiller from its feldspar microstructure. This is one specimen, not a claim that every item sold under either name has the same composition.
Market history: Soul Body Gems brought this Tanzanian material for laboratory testing early in its introduction to the market and regards its report as the first such test it presented to customers. That market-history statement is from Soul Body Gems; the laboratory report itself documents the specimen and its findings.
Use this guide alongside the written findings and the original report transcript. It explains the purpose of each analytical figure and preserves the laboratory’s own figure labels. The interpretations apply to the tested specimen; signals alone do not establish the identity of every similar-looking stone.
Electron microscope image: This view shows small-scale regions selected for analysis. Its brightness contrast helps distinguish regions with different compositions; it is not a photograph of their natural colors. Numbered spots connect this view to the analyses listed in the report.
Laboratory figure caption: Fig. 2: Backscattered electron image of area 1 in sample 3. Note exsolution lamellae, slightly darker gray.
Elemental spectrum: The peaks record characteristic X-ray signals from elements in the analyzed spot or area. This is an analysis of that location, not automatically of the entire specimen. Any mineral identification or uncertainty named in the laboratory caption is retained below.
Laboratory figure caption: Fig. 3: Energy dispersive spectrum of spot 1 in Fig. 2. (potassium feldspar).
Elemental spectrum: The peaks record characteristic X-ray signals from elements in the analyzed spot or area. This is an analysis of that location, not automatically of the entire specimen. Any mineral identification or uncertainty named in the laboratory caption is retained below.
Laboratory figure caption: Fig. 4: Energy dispersive spectrum of spot 2 (3 and 4 are similar) in Fig. 2. (sodic plagioclase, albite most likely)
Electron microscope image: This view shows small-scale regions selected for analysis. Its brightness contrast helps distinguish regions with different compositions; it is not a photograph of their natural colors. Numbered spots connect this view to the analyses listed in the report.
Laboratory figure caption: Fig. 5: Backscattered electron image of area 2 in sample 3.
Elemental spectrum: The peaks record characteristic X-ray signals from elements in the analyzed spot or area. This is an analysis of that location, not automatically of the entire specimen. Any mineral identification or uncertainty named in the laboratory caption is retained below.
Laboratory figure caption: Fig. 6: Energy dispersive spectrum of spot 1 in Fig. 5. (hematite)
Read the original laboratory report as text
The following text and tables are transcribed from the original laboratory document. Figure captions identify the report images; the laboratory interpretations and limitations are preserved.
Laboratory report 1
Analytical Result Report
Sample id: 9234 (sample 3, moonstone/sunstone)
Submitted by: K. Bitner
Date submitted: March 27, 2021.
Date completed: April 6, 2021.
Operating conditions: An AMRAY 1830 SEM operated at 25 kV acceleration potential, 26 mm working distance, 15 degrees sample tilt, coated with 250 Å carbon. Using the X-ray fluorescence attachment with 35kv potental in conjunction with the EDS system.
Fig. 1: Photograph of the specimen #3, approximately 35 mm across.
Fig. 2: Backscattered electron image of area 1 in sample 3. Note exsolution lamellae, slightly darker gray.
Fig. 3: Energy dispersive spectrum of spot 1 in Fig. 2. (potassium feldspar).
Fig. 4: Energy dispersive spectrum of spot 2 (3 and 4 are similar) in Fig. 2. (sodic plagioclase, albite most likely)
Fig. 5: Backscattered electron image of area 2 in sample 3.
Fig. 6: Energy dispersive spectrum of spot 1 in Fig. 5. (hematite)
Fig. 7: Photomicrograph of hematite inclusions in sample 3. 700 microns across the field of view.
Fig. 8: Photomicrograph of schiller along planes in sample 3. 1200 microns field of view.
Table 1: Trace element composition of sample 3. (in ppm)
Laboratory data as recorded in the report
Element
Reported value
Barium
9294
Calcium
2100
Iron
500
Manganese
110
Lead
380
Strontium
770
Summary of findings: A very interesting specimen we have here Fig. 1). Backscattered electron imaging reveals exsolution lamellae (Fig. 2) of sodic plagioclase, most likely an albite with some anorthite component) (Fig. 4) in a groundmass of potassium feldspar (Fig. 3). Since the potassium feldspar has exsolved the plagioclase component, it must be ordered, so it is a microcline. The elevated barium content (Table 1) is typical for potassium feldspars only. The specimen shows inclusions of hematite (Figs. 5-7). In addition, a distinction schiller effect (Fig. 8) is seen aside from reflections of the hematite inclusions. Thus, this sample displays the effects seen in a sunstone as well as the schiller effect seen in moonstone!
Sunstone Moonstone (Tanzania) · Soul Body Gems, July 2024.
A Tanzanian material with the optical effects associated with both moonstone and sunstone, examined for Soul Body Gems.
Finding: Sample 9234, completed April 6, 2021, has a potassium feldspar groundmass interpreted as microcline with exsolved sodic plagioclase lamellae, likely albite-rich. Hematite inclusions and a distinct schiller effect were also documented.
The report concludes that the submitted specimen displays both sunstone-like effects from hematite and moonstone-like schiller from its feldspar microstructure. This is one specimen, not a claim that every item sold under either name has the same composition.
Market history: Soul Body Gems brought this Tanzanian material for laboratory testing early in its introduction to the market and regards its report as the first such test it presented to customers. That market-history statement is from Soul Body Gems; the laboratory report itself documents the specimen and its findings.
Use this guide alongside the written findings and the original report transcript. It explains the purpose of each analytical figure and preserves the laboratory’s own figure labels. The interpretations apply to the tested specimen; signals alone do not establish the identity of every similar-looking stone.
Electron microscope image: This view shows small-scale regions selected for analysis. Its brightness contrast helps distinguish regions with different compositions; it is not a photograph of their natural colors. Numbered spots connect this view to the analyses listed in the report.
Laboratory figure caption: Fig. 2: Backscattered electron image of area 1 in sample 3. Note exsolution lamellae, slightly darker gray.
Elemental spectrum: The peaks record characteristic X-ray signals from elements in the analyzed spot or area. This is an analysis of that location, not automatically of the entire specimen. Any mineral identification or uncertainty named in the laboratory caption is retained below.
Laboratory figure caption: Fig. 3: Energy dispersive spectrum of spot 1 in Fig. 2. (potassium feldspar).
Elemental spectrum: The peaks record characteristic X-ray signals from elements in the analyzed spot or area. This is an analysis of that location, not automatically of the entire specimen. Any mineral identification or uncertainty named in the laboratory caption is retained below.
Laboratory figure caption: Fig. 4: Energy dispersive spectrum of spot 2 (3 and 4 are similar) in Fig. 2. (sodic plagioclase, albite most likely)
Electron microscope image: This view shows small-scale regions selected for analysis. Its brightness contrast helps distinguish regions with different compositions; it is not a photograph of their natural colors. Numbered spots connect this view to the analyses listed in the report.
Laboratory figure caption: Fig. 5: Backscattered electron image of area 2 in sample 3.
Elemental spectrum: The peaks record characteristic X-ray signals from elements in the analyzed spot or area. This is an analysis of that location, not automatically of the entire specimen. Any mineral identification or uncertainty named in the laboratory caption is retained below.
Laboratory figure caption: Fig. 6: Energy dispersive spectrum of spot 1 in Fig. 5. (hematite)
Read the original laboratory report as text
The following text and tables are transcribed from the original laboratory document. Figure captions identify the report images; the laboratory interpretations and limitations are preserved.
Laboratory report 1
Analytical Result Report
Sample id: 9234 (sample 3, moonstone/sunstone)
Submitted by: K. Bitner
Date submitted: March 27, 2021.
Date completed: April 6, 2021.
Operating conditions: An AMRAY 1830 SEM operated at 25 kV acceleration potential, 26 mm working distance, 15 degrees sample tilt, coated with 250 Å carbon. Using the X-ray fluorescence attachment with 35kv potental in conjunction with the EDS system.
Fig. 1: Photograph of the specimen #3, approximately 35 mm across.
Fig. 2: Backscattered electron image of area 1 in sample 3. Note exsolution lamellae, slightly darker gray.
Fig. 3: Energy dispersive spectrum of spot 1 in Fig. 2. (potassium feldspar).
Fig. 4: Energy dispersive spectrum of spot 2 (3 and 4 are similar) in Fig. 2. (sodic plagioclase, albite most likely)
Fig. 5: Backscattered electron image of area 2 in sample 3.
Fig. 6: Energy dispersive spectrum of spot 1 in Fig. 5. (hematite)
Fig. 7: Photomicrograph of hematite inclusions in sample 3. 700 microns across the field of view.
Fig. 8: Photomicrograph of schiller along planes in sample 3. 1200 microns field of view.
Table 1: Trace element composition of sample 3. (in ppm)
Laboratory data as recorded in the report
Element
Reported value
Barium
9294
Calcium
2100
Iron
500
Manganese
110
Lead
380
Strontium
770
Summary of findings: A very interesting specimen we have here Fig. 1). Backscattered electron imaging reveals exsolution lamellae (Fig. 2) of sodic plagioclase, most likely an albite with some anorthite component) (Fig. 4) in a groundmass of potassium feldspar (Fig. 3). Since the potassium feldspar has exsolved the plagioclase component, it must be ordered, so it is a microcline. The elevated barium content (Table 1) is typical for potassium feldspars only. The specimen shows inclusions of hematite (Figs. 5-7). In addition, a distinction schiller effect (Fig. 8) is seen aside from reflections of the hematite inclusions. Thus, this sample displays the effects seen in a sunstone as well as the schiller effect seen in moonstone!
Natrolite Bracelet · Soul Body Gems, October 2024.
The orange-pink Indonesian material has been offered as “pink Larimar” and “pink thomsonite,” names that do not match the tested mineral.
Finding: Sample 9236, completed April 7, 2021, is a sodium-dominant aluminum silicate with some calcium substitution. The researcher favored natrolite and specifically excluded thomsonite and mesolite on the observed sodium-to-calcium relationship.
Larimar is a blue pectolite variety associated with the Dominican Republic; visual resemblance does not make the Indonesian material Larimar. GIA’s published account of a separate Indonesian parcel also identified natrolite by Raman spectroscopy and EDXRF after it had been offered as thomsonite or “pink Larimar.” Those results support the broader identification, while our report applies to our own specimen.
Market history: Soul Body Gems regards its submitted specimen as its first market test of this material. That priority statement is our account, not a finding contained in the analytical report.
Use this guide alongside the written findings and the original report transcript. It explains the purpose of each analytical figure and preserves the laboratory’s own figure labels. The interpretations apply to the tested specimen; signals alone do not establish the identity of every similar-looking stone.
Electron microscope image: This view shows small-scale regions selected for analysis. Its brightness contrast helps distinguish regions with different compositions; it is not a photograph of their natural colors. Numbered spots connect this view to the analyses listed in the report.
Laboratory figure caption: Fig. 2: Backscattered electron image of area 1 in sample 5.
Elemental spectrum: The peaks record characteristic X-ray signals from elements in the analyzed spot or area. This is an analysis of that location, not automatically of the entire specimen. Any mineral identification or uncertainty named in the laboratory caption is retained below.
Laboratory figure caption: Fig. 3: Energy dispersive spectrum of area 1 in Fig. 2. (natrolite)
Read the original laboratory report as text
The following text and tables are transcribed from the original laboratory document. Figure captions identify the report images; the laboratory interpretations and limitations are preserved.
Laboratory report 1
Analytical Result Report
Sample id: 9236 (sample 5, new material from Indonesia: thomsonite or natrolite)
Submitted by: K. Bitner
Date submitted: March 27, 2021.
Date completed: April 7, 2021.
Operating conditions: An AMRAY 1830 SEM operated at 25 kV acceleration potential, 26 mm working distance, 15 degrees sample tilt, coated with 250 Å carbon. Using the X-ray fluorescence attachment with 35kv potental in conjunction with the EDS system.
Fig. 1: Photograph of the specimen #5, approximately 27 mm across.
Fig. 2: Backscattered electron image of area 1 in sample 5.
Fig. 3: Energy dispersive spectrum of area 1 in Fig. 2. (natrolite)
Table 1: Chemical composition of sample 5. (in wt. %)
Laboratory data as recorded in the report
Silicon dioxide
48.11
Aluminum oxide
27.06
Potassium oxide
0.15
Sodium oxide
14.75
Calcium oxide
2.33
Iron
0.02
Summary of findings: This specimen (Figs. 1 and 2) is essentially a sodium aluminum silicate with some calcium substitution. Sodium is far dominant over calcium, thus the specimen is not thomsonite. Nor is it mesolite which also requires more calcium. Natrolite with a little calcium substitution seems to be the best choice.
The orange-pink Indonesian material has been offered as “pink Larimar” and “pink thomsonite,” names that do not match the tested mineral.
Finding: Sample 9236, completed April 7, 2021, is a sodium-dominant aluminum silicate with some calcium substitution. The researcher favored natrolite and specifically excluded thomsonite and mesolite on the observed sodium-to-calcium relationship.
Larimar is a blue pectolite variety associated with the Dominican Republic; visual resemblance does not make the Indonesian material Larimar. GIA’s published account of a separate Indonesian parcel also identified natrolite by Raman spectroscopy and EDXRF after it had been offered as thomsonite or “pink Larimar.” Those results support the broader identification, while our report applies to our own specimen.
Market history: Soul Body Gems regards its submitted specimen as its first market test of this material. That priority statement is our account, not a finding contained in the analytical report.
Use this guide alongside the written findings and the original report transcript. It explains the purpose of each analytical figure and preserves the laboratory’s own figure labels. The interpretations apply to the tested specimen; signals alone do not establish the identity of every similar-looking stone.
Electron microscope image: This view shows small-scale regions selected for analysis. Its brightness contrast helps distinguish regions with different compositions; it is not a photograph of their natural colors. Numbered spots connect this view to the analyses listed in the report.
Laboratory figure caption: Fig. 2: Backscattered electron image of area 1 in sample 5.
Elemental spectrum: The peaks record characteristic X-ray signals from elements in the analyzed spot or area. This is an analysis of that location, not automatically of the entire specimen. Any mineral identification or uncertainty named in the laboratory caption is retained below.
Laboratory figure caption: Fig. 3: Energy dispersive spectrum of area 1 in Fig. 2. (natrolite)
Read the original laboratory report as text
The following text and tables are transcribed from the original laboratory document. Figure captions identify the report images; the laboratory interpretations and limitations are preserved.
Laboratory report 1
Analytical Result Report
Sample id: 9236 (sample 5, new material from Indonesia: thomsonite or natrolite)
Submitted by: K. Bitner
Date submitted: March 27, 2021.
Date completed: April 7, 2021.
Operating conditions: An AMRAY 1830 SEM operated at 25 kV acceleration potential, 26 mm working distance, 15 degrees sample tilt, coated with 250 Å carbon. Using the X-ray fluorescence attachment with 35kv potental in conjunction with the EDS system.
Fig. 1: Photograph of the specimen #5, approximately 27 mm across.
Fig. 2: Backscattered electron image of area 1 in sample 5.
Fig. 3: Energy dispersive spectrum of area 1 in Fig. 2. (natrolite)
Table 1: Chemical composition of sample 5. (in wt. %)
Laboratory data as recorded in the report
Silicon dioxide
48.11
Aluminum oxide
27.06
Potassium oxide
0.15
Sodium oxide
14.75
Calcium oxide
2.33
Iron
0.02
Summary of findings: This specimen (Figs. 1 and 2) is essentially a sodium aluminum silicate with some calcium substitution. Sodium is far dominant over calcium, thus the specimen is not thomsonite. Nor is it mesolite which also requires more calcium. Natrolite with a little calcium substitution seems to be the best choice.
The orange-pink Indonesian material has been offered as “pink Larimar” and “pink thomsonite,” names that do not match the tested mineral.
Finding: Sample 9236, completed April 7, 2021, is a sodium-dominant aluminum silicate with some calcium substitution. The researcher favored natrolite and specifically excluded thomsonite and mesolite on the observed sodium-to-calcium relationship.
Larimar is a blue pectolite variety associated with the Dominican Republic; visual resemblance does not make the Indonesian material Larimar. GIA’s published account of a separate Indonesian parcel also identified natrolite by Raman spectroscopy and EDXRF after it had been offered as thomsonite or “pink Larimar.” Those results support the broader identification, while our report applies to our own specimen.
Market history: Soul Body Gems regards its submitted specimen as its first market test of this material. That priority statement is our account, not a finding contained in the analytical report.
Use this guide alongside the written findings and the original report transcript. It explains the purpose of each analytical figure and preserves the laboratory’s own figure labels. The interpretations apply to the tested specimen; signals alone do not establish the identity of every similar-looking stone.
Electron microscope image: This view shows small-scale regions selected for analysis. Its brightness contrast helps distinguish regions with different compositions; it is not a photograph of their natural colors. Numbered spots connect this view to the analyses listed in the report.
Laboratory figure caption: Fig. 2: Backscattered electron image of area 1 in sample 5.
Elemental spectrum: The peaks record characteristic X-ray signals from elements in the analyzed spot or area. This is an analysis of that location, not automatically of the entire specimen. Any mineral identification or uncertainty named in the laboratory caption is retained below.
Laboratory figure caption: Fig. 3: Energy dispersive spectrum of area 1 in Fig. 2. (natrolite)
Read the original laboratory report as text
The following text and tables are transcribed from the original laboratory document. Figure captions identify the report images; the laboratory interpretations and limitations are preserved.
Laboratory report 1
Analytical Result Report
Sample id: 9236 (sample 5, new material from Indonesia: thomsonite or natrolite)
Submitted by: K. Bitner
Date submitted: March 27, 2021.
Date completed: April 7, 2021.
Operating conditions: An AMRAY 1830 SEM operated at 25 kV acceleration potential, 26 mm working distance, 15 degrees sample tilt, coated with 250 Å carbon. Using the X-ray fluorescence attachment with 35kv potental in conjunction with the EDS system.
Fig. 1: Photograph of the specimen #5, approximately 27 mm across.
Fig. 2: Backscattered electron image of area 1 in sample 5.
Fig. 3: Energy dispersive spectrum of area 1 in Fig. 2. (natrolite)
Table 1: Chemical composition of sample 5. (in wt. %)
Laboratory data as recorded in the report
Silicon dioxide
48.11
Aluminum oxide
27.06
Potassium oxide
0.15
Sodium oxide
14.75
Calcium oxide
2.33
Iron
0.02
Summary of findings: This specimen (Figs. 1 and 2) is essentially a sodium aluminum silicate with some calcium substitution. Sodium is far dominant over calcium, thus the specimen is not thomsonite. Nor is it mesolite which also requires more calcium. Natrolite with a little calcium substitution seems to be the best choice.
Natrolite polished slabs from Indonesia · May 2025 collection
A large specimen supplied to us as originating from Madagascar; its report lists the source as unknown.
Finding: Sample 9237, completed April 7, 2021, contains abundant calcite and dolomite, with magnetite, intermediate plagioclase and phlogopite. The researcher interpreted a metamorphosed limestone/shale package, a calc-silicate rock or skarn.
The report also observed corundum in some areas but raised the possibility that it came from polishing material lodged in fractures. We do not present corundum as a confirmed natural constituent of this rock. The Madagascar locality is the sourcing information supplied by Soul Body Gems; the lab report itself said “parts unknown.”
View the original report
Select a page to enlarge it. 7 pages; findings are summarized in accessible text above.
Use this guide alongside the written findings and the original report transcript. It explains the purpose of each analytical figure and preserves the laboratory’s own figure labels. The interpretations apply to the tested specimen; signals alone do not establish the identity of every similar-looking stone.
Electron microscope image: This view shows small-scale regions selected for analysis. Its brightness contrast helps distinguish regions with different compositions; it is not a photograph of their natural colors. Numbered spots connect this view to the analyses listed in the report.
Laboratory figure caption: Fig. 2: Backscattered electron image of area 1 in sample 6.
Elemental spectrum: The peaks record characteristic X-ray signals from elements in the analyzed spot or area. This is an analysis of that location, not automatically of the entire specimen. Any mineral identification or uncertainty named in the laboratory caption is retained below.
Laboratory figure caption: Fig. 3: Energy dispersive spectrum of spot 1 in Fig. 2. (calcite)
Elemental spectrum: The peaks record characteristic X-ray signals from elements in the analyzed spot or area. This is an analysis of that location, not automatically of the entire specimen. Any mineral identification or uncertainty named in the laboratory caption is retained below.
Laboratory figure caption: Fig. 4: Energy dispersive spectrum of spot 2 in Fig. 2. (dolomite)
Electron microscope image: This view shows small-scale regions selected for analysis. Its brightness contrast helps distinguish regions with different compositions; it is not a photograph of their natural colors. Numbered spots connect this view to the analyses listed in the report.
Laboratory figure caption: Fig. 5: Backscattered electron image of area 2 in sample 6.
Elemental spectrum: The peaks record characteristic X-ray signals from elements in the analyzed spot or area. This is an analysis of that location, not automatically of the entire specimen. Any mineral identification or uncertainty named in the laboratory caption is retained below.
Laboratory figure caption: Fig. 6: Energy dispersive spectrum of spot 1 in Fig. 5. (magnetite)
Elemental spectrum: The peaks record characteristic X-ray signals from elements in the analyzed spot or area. This is an analysis of that location, not automatically of the entire specimen. Any mineral identification or uncertainty named in the laboratory caption is retained below.
Laboratory figure caption: Fig. 7: Energy dispersive spectrum of spot 2 in Fig. 5. (dolomite)
Elemental spectrum: The peaks record characteristic X-ray signals from elements in the analyzed spot or area. This is an analysis of that location, not automatically of the entire specimen. Any mineral identification or uncertainty named in the laboratory caption is retained below.
Laboratory figure caption: Fig. 8: Energy dispersive spectrum of spot 3 in Fig. 5. (calcite)
Elemental spectrum: The peaks record characteristic X-ray signals from elements in the analyzed spot or area. This is an analysis of that location, not automatically of the entire specimen. Any mineral identification or uncertainty named in the laboratory caption is retained below.
Laboratory figure caption: Fig. 9: Energy dispersive spectrum of spot 4 in Fig. 5. (corundum, poss. polishing material)
Elemental spectrum: The peaks record characteristic X-ray signals from elements in the analyzed spot or area. This is an analysis of that location, not automatically of the entire specimen. Any mineral identification or uncertainty named in the laboratory caption is retained below.
Laboratory figure caption: Fig. 10: Energy dispersive spectrum of spot in Fig. 5. (plagioclase)
Electron microscope image: This view shows small-scale regions selected for analysis. Its brightness contrast helps distinguish regions with different compositions; it is not a photograph of their natural colors. Numbered spots connect this view to the analyses listed in the report.
Laboratory figure caption: Fig. 11: Backscattered electron image of area 3 in sample 6.
Elemental spectrum: The peaks record characteristic X-ray signals from elements in the analyzed spot or area. This is an analysis of that location, not automatically of the entire specimen. Any mineral identification or uncertainty named in the laboratory caption is retained below.
Laboratory figure caption: Fig. 12: Energy dispersive spectrum of spot 1 in Fig. 8. (phlogopite)
Element map: This map shows where the named elements occur within the analyzed area. Its colors represent the laboratory’s selected element channels, rather than the specimen’s visible colors. The caption below preserves any color key or distribution noted by the laboratory.
Laboratory figure caption: Fig. 13: X-ray map of the area shown in Fig. 11. Mg: red, Ca: yellow, Fe: blue, K: green
Read the original laboratory report as text
The following text and tables are transcribed from the original laboratory document. Figure captions identify the report images; the laboratory interpretations and limitations are preserved.
Laboratory report 1
                                                Analytical Result Report

Sample id: 9237 (sample 6, new find from parts unknown)
Submitted by: K. Bitner
Date submitted: March 27, 2021.
Date completed: April 7, 2021.
Operating conditions: An AMRAY 1830 SEM operated at 25 kV acceleration potential, 26 mm working distance, 15
degrees sample tilt, coated with 250 Å carbon. Using the X-ray fluorescence attachment with 35kv potental in
conjunction with the EDS system.


Fig. 1: Photograph of the specimen #6, approximately 86 mm across.


Fig. 2: Backscattered electron image of area 1 in sample 6.
Fig. 3: Energy dispersive spectrum of spot 1 in Fig. 2. (calcite)


Fig. 4: Energy dispersive spectrum of spot 2 in Fig. 2.  (dolomite)
Fig. 5: Backscattered electron image of area 2 in sample 6.


Fig. 6: Energy dispersive spectrum of spot 1 in Fig. 5.  (magnetite)
Fig. 7: Energy dispersive spectrum of spot 2 in Fig. 5.  (dolomite)


Fig. 8: Energy dispersive spectrum of spot 3 in Fig. 5. (calcite)
Fig. 9: Energy dispersive spectrum of spot 4 in Fig. 5. (corundum, poss. polishing material)


Fig. 10: Energy dispersive spectrum of spot in Fig. 5.  (plagioclase)
Fig. 11: Backscattered electron image of area 3 in sample 6.


Fig. 12: Energy dispersive spectrum of spot 1 in Fig. 8.  (phlogopite)


Fig. 13: X-ray map of the area shown in Fig. 11. Mg: red, Ca: yellow, Fe: blue, K: green
Summary of findings: This specimen (Figs. 1, 2, 5, and 11) is a from a metamorphosed limestone/shale package. Calcite
(Figs. 3 and 8) and dolomite (Figs. 4 and 7) are abundant. The dolomite contains a small amount of iron (Figs. 4 and 7)
Magnetite (more likely than hematite as it contains some titanium) occurs as tiny grains (Fig. 6), plagioclase of an
intermediate composition is present (Fig. 10) and phlogopite is he only mica species (Fig. 12). There is corundum
present (Fig. 9), but it could possibly be from polishing? In Fig. 11 near spot 3, the darker gray band is all corundum,
there are several cracks visible in this material which suggests that it is something that ended up filling a fracture during
polishing. The material slows the effects of fracturing (Fig. 1) of the originally bedded material (Fig. 5, 11 and 13). This
material is a calc silicate rock or skarn of previously fractured sedimentary material.


Date:  April 7, 2021                     Signature
A purple quartz sphere sold under the Super Seven trade name. The seven-mineral marketing claim does not identify the inclusions in an individual specimen.
Original Super Seven from Brazil · frame from our January 2025 video. This collection image illustrates the material; the reports below identify their submitted specimens.
Finding: The submitted sphere contained amethyst/quartz with goethite, hematite, pyrite, chlorite-group material, clay and calcite. The needlelike goethite sprays were not identified as cacoxenite.
Report: Sample 9238, specimen 7, completed April 8, 2021. These findings describe the tested sphere and should not be taken as a composition for all material sold as Super Seven.
Additional report: original Super Seven from Brazil
Sample: 1205 (#2 original super 7 from Brazil). Completed: January 12, 2025.
Finding: Quartz, partly amethyst and partly smoky, with abundant fibrous goethite sprays and some hematite.
This second specimen gives another view of material sold under the Super Seven name. The brown fibrous inclusions are goethite, explicitly distinguished from cacoxenite. The report notes iron associated with the amethyst color and aluminum associated with smoky coloration, together with natural radiation.
These results are the property of Soul Body Gems, Alexander Falster, and the Maine Mineral & Gem Museum. Any mention requires full acknowledgment.
Understanding the report figures
Use this guide alongside the written findings and the original report transcript. It explains the purpose of each analytical figure and preserves the laboratory’s own figure labels. The interpretations apply to the tested specimen; signals alone do not establish the identity of every similar-looking stone.
Electron microscope image: This view shows small-scale regions selected for analysis. Its brightness contrast helps distinguish regions with different compositions; it is not a photograph of their natural colors. Numbered spots connect this view to the analyses listed in the report.
Laboratory figure caption: Fig. 2: Backscattered electron image of an area of the specimen.
Elemental spectrum: The peaks record characteristic X-ray signals from elements in the analyzed spot or area. This is an analysis of that location, not automatically of the entire specimen. Any mineral identification or uncertainty named in the laboratory caption is retained below.
Laboratory figure caption: Fig. 3: Energy dispersive spectrum of spot 1 in Fig. 2. (quartz)
Elemental spectrum: The peaks record characteristic X-ray signals from elements in the analyzed spot or area. This is an analysis of that location, not automatically of the entire specimen. Any mineral identification or uncertainty named in the laboratory caption is retained below.
Laboratory figure caption: Fig. 4: Energy dispersive spectrum of spot 2 in Fig. 2. (iron oxide)
Read the additional report as text
Analytical Result Report
Sample id: 1205 (#2 original super 7 from Brazil)
Submitted by: Soul Body Gems
Date completed: 1-12-2025
Operating conditions: An AMRAY 1830 SEM operated at 25 kV acceleration potential, 24 mm working distance, 0 degrees sample tilt, coated with 250 Å carbon, and also using the attached XRF unit operated at 30 kV.
Fig. 1: Photograph of the specimens and close-ups. 5 cm maximum dimensions.
Fig. 2: Backscattered electron image of an area of the specimen.
Fig. 3: Energy dispersive spectrum of spot 1 in Fig. 2. (quartz)
Fig. 4: Energy dispersive spectrum of spot 2 in Fig. 2. (iron oxide)
Summary of findings: These specimens (Fig. 1) are very pretty, quartz (Figs. 2 and 3), partially amethyst, partially smoky, with abundant brown sprays of fibrous inclusions which are goethite (Figs. 2 and 4). A few hematites have also been noted, they appear black to deep red. A common misidentification of the goethite is often made by calling it cacoxenite, it is not. The quartz, especially the amethyst portions contain iron, up to 0.08 wt. %, this iron, as trivalent iron plus effects of natural radiation, is responsible for the amethyst color. A little aluminum, around 0.2 wt. % plus natural radiation, causes the smoky color.
Date: 1-12-2025. Signature.
A green zeolite material offered as apophyllite, examined to determine the minerals responsible for its color.
Finding: The principal zeolite was identified as stilbite-(Ca), not apophyllite. Chlorite-group material contributes green color; hematite or altered chlorite contributes reddish-brown areas. The report also notes possible laumontite.
Report: Sample 9238, specimen 8, completed April 15, 2021. The analysis applies to this tested green specimen.
Use this guide alongside the written findings and the original report transcript. It explains the purpose of each analytical figure and preserves the laboratory’s own figure labels. The interpretations apply to the tested specimen; signals alone do not establish the identity of every similar-looking stone.
Electron microscope image: This view shows small-scale regions selected for analysis. Its brightness contrast helps distinguish regions with different compositions; it is not a photograph of their natural colors. Numbered spots connect this view to the analyses listed in the report.
Laboratory figure caption: Fig. 2: Backscattered electron image of area 1 in sample 8.
Elemental spectrum: The peaks record characteristic X-ray signals from elements in the analyzed spot or area. This is an analysis of that location, not automatically of the entire specimen. Any mineral identification or uncertainty named in the laboratory caption is retained below.
Laboratory figure caption: Fig. 3: Energy dispersive spectrum of spot 1 in Fig. 2. (stilbite-Ca))
Electron microscope image: This view shows small-scale regions selected for analysis. Its brightness contrast helps distinguish regions with different compositions; it is not a photograph of their natural colors. Numbered spots connect this view to the analyses listed in the report.
Laboratory figure caption: Fig. 4: Backscattered electron image of area 2 in sample 8.
Elemental spectrum: The peaks record characteristic X-ray signals from elements in the analyzed spot or area. This is an analysis of that location, not automatically of the entire specimen. Any mineral identification or uncertainty named in the laboratory caption is retained below.
Laboratory figure caption: Fig. 5: Energy dispersive spectrum of spot 1 in Fig. 4. (chlorite group clay species intergrown with stilbite-Ca))
Electron microscope image: This view shows small-scale regions selected for analysis. Its brightness contrast helps distinguish regions with different compositions; it is not a photograph of their natural colors. Numbered spots connect this view to the analyses listed in the report.
Laboratory figure caption: Fig. 6: Backscattered electron image of area 3 in sample 8.
Elemental spectrum: The peaks record characteristic X-ray signals from elements in the analyzed spot or area. This is an analysis of that location, not automatically of the entire specimen. Any mineral identification or uncertainty named in the laboratory caption is retained below.
Laboratory figure caption: Fig. 7: Energy dispersive spectrum of spot 1 in Fig. 6. (intergrowth of chlorite, stilbite-(Ca) and hematite which may be derived from altered chlorite).
Electron microscope image: This view shows small-scale regions selected for analysis. Its brightness contrast helps distinguish regions with different compositions; it is not a photograph of their natural colors. Numbered spots connect this view to the analyses listed in the report.
Laboratory figure caption: Fig. 8: Backscattered electron image of area 4 in sample 8.
Elemental spectrum: The peaks record characteristic X-ray signals from elements in the analyzed spot or area. This is an analysis of that location, not automatically of the entire specimen. Any mineral identification or uncertainty named in the laboratory caption is retained below.
Laboratory figure caption: Fig. 9: Energy dispersive spectrum of spot 1 in Fig. 6. (hematite)
Electron microscope image: This view shows small-scale regions selected for analysis. Its brightness contrast helps distinguish regions with different compositions; it is not a photograph of their natural colors. Numbered spots connect this view to the analyses listed in the report.
Laboratory figure caption: Fig. 10: Backscattered electron image of the desiccated material in sample 8 after being in the samaple chamber of the SEM.
Elemental spectrum: The peaks record characteristic X-ray signals from elements in the analyzed spot or area. This is an analysis of that location, not automatically of the entire specimen. Any mineral identification or uncertainty named in the laboratory caption is retained below.
Laboratory figure caption: Fig. 11: Energy dispersive spectrum of spot 1 in Fig. 8. (at least partially dehydrated stilbite-(Ca)).
Read the original laboratory report as text
The following text and tables are transcribed from the original laboratory document. Figure captions identify the report images; the laboratory interpretations and limitations are preserved.
Laboratory report 1
Analytical Result Report
Sample id: 9238 (sample 8, oval and crescent)
Submitted by: K. Bitner
Date submitted: March 27, 2021.
Date completed: April 15, 2021.
Operating conditions: An AMRAY 1830 SEM operated at 25 kV acceleration potential, 26 mm working distance, 15 degrees sample tilt, coated with 250 Å carbon. Using the X-ray fluorescence attachment with 35kv potental in conjunction with the EDS system.
Fig. 1: Photograph of the specimen #8, Crescent is 9 cm in maximum dimension, the oval is 6.5 cm in maximum dimension. The whiter areas in the oval spepcimena re the result oof dehydration in the sample cahamber of the SEM.
Fig. 2: Backscattered electron image of area 1 in sample 8.
.
Fig. 3: Energy dispersive spectrum of spot 1 in Fig. 2. (stilbite-Ca))
Fig. 4: Backscattered electron image of area 2 in sample 8.
Fig. 5: Energy dispersive spectrum of spot 1 in Fig. 4. (chlorite group clay species intergrown with stilbite-Ca))
Fig. 6: Backscattered electron image of area 3 in sample 8.
Fig. 7: Energy dispersive spectrum of spot 1 in Fig. 6. (intergrowth of chlorite, stilbite-(Ca) and hematite which may be derived from altered chlorite).
Fig. 8: Backscattered electron image of area 4 in sample 8.
Fig. 9: Energy dispersive spectrum of spot 1 in Fig. 6. (hematite)
Fig. 10: Backscattered electron image of the desiccated material in sample 8 after being in the samaple chamber of the SEM.
Fig. 11: Energy dispersive spectrum of spot 1 in Fig. 8. (at least partially dehydrated stilbite-(Ca)).
Table 1: Trace elements of the specimen (in wt. %).
Laboratory data as recorded in the report
White area
Red area
Green area
Iron
0.01
0.44
0.46
Manganese
nd
0.02
0.01
Summary of findings: This sample (Fig. 1) is very interesting. It is mainly zeolite material; best match is a stilbite-(Ca) (Figs. 2 and 3). The green coloration is due to intimately intergrown chlorite group species (Figs. 4 and 5). The red -brown areas are due to an intergrowth of hematite, chlorite (likely oxidized chlorite) and stilbite-(Ca). The coloration is likely due to very tiny particles of hematite (Figs. 6-9) and oxidized chlorite rather than substitution of trivalent iron for aluminum in the stilbite structure since these reactions were taken place likely at low temperature which make it unlikely for the iron to have been mobile. It is possible, that some laumontite is present as well. A surprise came when the oval specimen as retrieved from the sample chamber, it had undergone partial dehydration (Figs. 1, 10, and 11).
The amounts of iron and lesser amounts on manganese are shown for the different colors in Table 1. Note that the iron content for the green and red colors is quite similar, it is likely the response to the oxidation state that yields red versus green colors
Date: April 15, 2021 Signature
A green zeolite material offered as apophyllite, examined to determine the minerals responsible for its color.
Finding: The principal zeolite was identified as stilbite-(Ca), not apophyllite. Chlorite-group material contributes green color; hematite or altered chlorite contributes reddish-brown areas. The report also notes possible laumontite.
Report: Sample 9238, specimen 8, completed April 15, 2021. The analysis applies to this tested green specimen.
Use this guide alongside the written findings and the original report transcript. It explains the purpose of each analytical figure and preserves the laboratory’s own figure labels. The interpretations apply to the tested specimen; signals alone do not establish the identity of every similar-looking stone.
Electron microscope image: This view shows small-scale regions selected for analysis. Its brightness contrast helps distinguish regions with different compositions; it is not a photograph of their natural colors. Numbered spots connect this view to the analyses listed in the report.
Laboratory figure caption: Fig. 2: Backscattered electron image of area 1 in sample 8.
Elemental spectrum: The peaks record characteristic X-ray signals from elements in the analyzed spot or area. This is an analysis of that location, not automatically of the entire specimen. Any mineral identification or uncertainty named in the laboratory caption is retained below.
Laboratory figure caption: Fig. 3: Energy dispersive spectrum of spot 1 in Fig. 2. (stilbite-Ca))
Electron microscope image: This view shows small-scale regions selected for analysis. Its brightness contrast helps distinguish regions with different compositions; it is not a photograph of their natural colors. Numbered spots connect this view to the analyses listed in the report.
Laboratory figure caption: Fig. 4: Backscattered electron image of area 2 in sample 8.
Elemental spectrum: The peaks record characteristic X-ray signals from elements in the analyzed spot or area. This is an analysis of that location, not automatically of the entire specimen. Any mineral identification or uncertainty named in the laboratory caption is retained below.
Laboratory figure caption: Fig. 5: Energy dispersive spectrum of spot 1 in Fig. 4. (chlorite group clay species intergrown with stilbite-Ca))
Electron microscope image: This view shows small-scale regions selected for analysis. Its brightness contrast helps distinguish regions with different compositions; it is not a photograph of their natural colors. Numbered spots connect this view to the analyses listed in the report.
Laboratory figure caption: Fig. 6: Backscattered electron image of area 3 in sample 8.
Elemental spectrum: The peaks record characteristic X-ray signals from elements in the analyzed spot or area. This is an analysis of that location, not automatically of the entire specimen. Any mineral identification or uncertainty named in the laboratory caption is retained below.
Laboratory figure caption: Fig. 7: Energy dispersive spectrum of spot 1 in Fig. 6. (intergrowth of chlorite, stilbite-(Ca) and hematite which may be derived from altered chlorite).
Electron microscope image: This view shows small-scale regions selected for analysis. Its brightness contrast helps distinguish regions with different compositions; it is not a photograph of their natural colors. Numbered spots connect this view to the analyses listed in the report.
Laboratory figure caption: Fig. 8: Backscattered electron image of area 4 in sample 8.
Elemental spectrum: The peaks record characteristic X-ray signals from elements in the analyzed spot or area. This is an analysis of that location, not automatically of the entire specimen. Any mineral identification or uncertainty named in the laboratory caption is retained below.
Laboratory figure caption: Fig. 9: Energy dispersive spectrum of spot 1 in Fig. 6. (hematite)
Electron microscope image: This view shows small-scale regions selected for analysis. Its brightness contrast helps distinguish regions with different compositions; it is not a photograph of their natural colors. Numbered spots connect this view to the analyses listed in the report.
Laboratory figure caption: Fig. 10: Backscattered electron image of the desiccated material in sample 8 after being in the samaple chamber of the SEM.
Elemental spectrum: The peaks record characteristic X-ray signals from elements in the analyzed spot or area. This is an analysis of that location, not automatically of the entire specimen. Any mineral identification or uncertainty named in the laboratory caption is retained below.
Laboratory figure caption: Fig. 11: Energy dispersive spectrum of spot 1 in Fig. 8. (at least partially dehydrated stilbite-(Ca)).
Read the original laboratory report as text
The following text and tables are transcribed from the original laboratory document. Figure captions identify the report images; the laboratory interpretations and limitations are preserved.
Laboratory report 1
Analytical Result Report
Sample id: 9238 (sample 8, oval and crescent)
Submitted by: K. Bitner
Date submitted: March 27, 2021.
Date completed: April 15, 2021.
Operating conditions: An AMRAY 1830 SEM operated at 25 kV acceleration potential, 26 mm working distance, 15 degrees sample tilt, coated with 250 Å carbon. Using the X-ray fluorescence attachment with 35kv potental in conjunction with the EDS system.
Fig. 1: Photograph of the specimen #8, Crescent is 9 cm in maximum dimension, the oval is 6.5 cm in maximum dimension. The whiter areas in the oval spepcimena re the result oof dehydration in the sample cahamber of the SEM.
Fig. 2: Backscattered electron image of area 1 in sample 8.
.
Fig. 3: Energy dispersive spectrum of spot 1 in Fig. 2. (stilbite-Ca))
Fig. 4: Backscattered electron image of area 2 in sample 8.
Fig. 5: Energy dispersive spectrum of spot 1 in Fig. 4. (chlorite group clay species intergrown with stilbite-Ca))
Fig. 6: Backscattered electron image of area 3 in sample 8.
Fig. 7: Energy dispersive spectrum of spot 1 in Fig. 6. (intergrowth of chlorite, stilbite-(Ca) and hematite which may be derived from altered chlorite).
Fig. 8: Backscattered electron image of area 4 in sample 8.
Fig. 9: Energy dispersive spectrum of spot 1 in Fig. 6. (hematite)
Fig. 10: Backscattered electron image of the desiccated material in sample 8 after being in the samaple chamber of the SEM.
Fig. 11: Energy dispersive spectrum of spot 1 in Fig. 8. (at least partially dehydrated stilbite-(Ca)).
Table 1: Trace elements of the specimen (in wt. %).
Laboratory data as recorded in the report
White area
Red area
Green area
Iron
0.01
0.44
0.46
Manganese
nd
0.02
0.01
Summary of findings: This sample (Fig. 1) is very interesting. It is mainly zeolite material; best match is a stilbite-(Ca) (Figs. 2 and 3). The green coloration is due to intimately intergrown chlorite group species (Figs. 4 and 5). The red -brown areas are due to an intergrowth of hematite, chlorite (likely oxidized chlorite) and stilbite-(Ca). The coloration is likely due to very tiny particles of hematite (Figs. 6-9) and oxidized chlorite rather than substitution of trivalent iron for aluminum in the stilbite structure since these reactions were taken place likely at low temperature which make it unlikely for the iron to have been mobile. It is possible, that some laumontite is present as well. A surprise came when the oval specimen as retrieved from the sample chamber, it had undergone partial dehydration (Figs. 1, 10, and 11).
The amounts of iron and lesser amounts on manganese are shown for the different colors in Table 1. Note that the iron content for the green and red colors is quite similar, it is likely the response to the oxidation state that yields red versus green colors
Date: April 15, 2021 Signature
A green amphibole specimen sourced as Indian material.
Finding: The bulk composition was a calcium-magnesium amphibole, probably pargasite. The report also documents minor pyrite, phlogopite, calcite and plagioclase, with chromium in some areas.
Report: Sample 9239, specimen 9, completed April 17, 2021. India is supplier locality information; the laboratory report identifies the mineralogy but does not independently verify the locality.
Use this guide alongside the written findings and the original report transcript. It explains the purpose of each analytical figure and preserves the laboratory’s own figure labels. The interpretations apply to the tested specimen; signals alone do not establish the identity of every similar-looking stone.
Electron microscope image: This view shows small-scale regions selected for analysis. Its brightness contrast helps distinguish regions with different compositions; it is not a photograph of their natural colors. Numbered spots connect this view to the analyses listed in the report.
Laboratory figure caption: Fig. 2: Backscattered electron image of area 1 in sample 9.
Elemental spectrum: The peaks record characteristic X-ray signals from elements in the analyzed spot or area. This is an analysis of that location, not automatically of the entire specimen. Any mineral identification or uncertainty named in the laboratory caption is retained below.
Laboratory figure caption: Fig. 3: Energy dispersive spectrum of spot 1 in Fig. 2. (pyrite)
Elemental spectrum: The peaks record characteristic X-ray signals from elements in the analyzed spot or area. This is an analysis of that location, not automatically of the entire specimen. Any mineral identification or uncertainty named in the laboratory caption is retained below.
Laboratory figure caption: Fig. 4: Energy dispersive spectrum of spot 2 in Fig. 2. (pargasite)
Elemental spectrum: The peaks record characteristic X-ray signals from elements in the analyzed spot or area. This is an analysis of that location, not automatically of the entire specimen. Any mineral identification or uncertainty named in the laboratory caption is retained below.
Laboratory figure caption: Fig. 5: Energy dispersive spectrum of spot 3 in Fig. 3. (phlogopite)
Electron microscope image: This view shows small-scale regions selected for analysis. Its brightness contrast helps distinguish regions with different compositions; it is not a photograph of their natural colors. Numbered spots connect this view to the analyses listed in the report.
Laboratory figure caption: Fig. 6: Backscattered electron image of area 2 in sample 9 .
Elemental spectrum: The peaks record characteristic X-ray signals from elements in the analyzed spot or area. This is an analysis of that location, not automatically of the entire specimen. Any mineral identification or uncertainty named in the laboratory caption is retained below.
Laboratory figure caption: Fig. 7: Energy dispersive spectrum of spot 1 in Fig. 6. (calcite)
Elemental spectrum: The peaks record characteristic X-ray signals from elements in the analyzed spot or area. This is an analysis of that location, not automatically of the entire specimen. Any mineral identification or uncertainty named in the laboratory caption is retained below.
Laboratory figure caption: Fig. 8: Energy dispersive spectrum of spot 2 in Fig. 6. (margasite with minor amounts of chromium)
Elemental spectrum: The peaks record characteristic X-ray signals from elements in the analyzed spot or area. This is an analysis of that location, not automatically of the entire specimen. Any mineral identification or uncertainty named in the laboratory caption is retained below.
Laboratory figure caption: Fig. 9: Energy dispersive spectrum of spot 4 in Fig. 6. (phlogopite)
Electron microscope image: This view shows small-scale regions selected for analysis. Its brightness contrast helps distinguish regions with different compositions; it is not a photograph of their natural colors. Numbered spots connect this view to the analyses listed in the report.
Laboratory figure caption: Fig. 10: Backscattered electron image of area 3 in sample 9.
Elemental spectrum: The peaks record characteristic X-ray signals from elements in the analyzed spot or area. This is an analysis of that location, not automatically of the entire specimen. Any mineral identification or uncertainty named in the laboratory caption is retained below.
Laboratory figure caption: Fig. 11: Energy dispersive spectrum of spot 1 in Fig. 10. (plagioclase)
Element map: This map shows where the named elements occur within the analyzed area. Its colors represent the laboratory’s selected element channels, rather than the specimen’s visible colors. The caption below preserves any color key or distribution noted by the laboratory.
The following text and tables are transcribed from the original laboratory document. Figure captions identify the report images; the laboratory interpretations and limitations are preserved.
Laboratory report 1
                                                Analytical Result Report

Sample id: 9239 (sample 9, tower)
Submitted by: K. Bitner
Date submitted: March 27, 2021.
Date completed: April 17, 2021.
Operating conditions: An AMRAY 1830 SEM operated at 25 kV acceleration potential, 26 mm working distance, 15
degrees sample tilt, coated with 250 Å carbon. Using the X-ray fluorescence attachment with 35kv potental in
conjunction with the EDS system.


Fig. 1: Photograph of the specimen #9, 7.5 cm tall.


Fig. 2: Backscattered electron image of area 1 in sample 9.
Fig. 3: Energy dispersive spectrum of spot 1 in Fig. 2. (pyrite)


Fig. 4: Energy dispersive spectrum of spot 2 in Fig. 2. (pargasite)
Fig. 5: Energy dispersive spectrum of spot 3 in Fig. 3. (phlogopite)


Fig. 6: Backscattered electron image of area 2 in sample 9
                                                                                                                                 .

Fig. 7: Energy dispersive spectrum of spot 1 in Fig. 6. (calcite)


Fig. 8: Energy dispersive spectrum of spot 2 in Fig. 6. (margasite with minor amounts of chromium)
Fig. 9: Energy dispersive spectrum of spot 4 in Fig. 6. (phlogopite)


Fig. 10: Backscattered electron image of area 3 in sample 9.
Fig. 11: Energy dispersive spectrum of spot 1 in Fig. 10. (plagioclase)


Fig. 12: X-ray maps. Silicon: red, calcium: green, iron: blue, aluminum: yellow, magnesium dark green.


Table 1: Trace elements of the specimen (in wt. %).

 Titanium                                               0.13
 Vanadium                                              0.02
 Chromium                                             0.04
 Barium                                                0.02
 Strontium                                              0.03
Summary of findings: This sample (Fig. 1) is not quartz with pyrite. There is pyrite present (Figs. 1-3). The bulk of the
material is a calcium magnesium amphibole, likely pargasite (Figs. 1, 2, 4 and 8). Note a small chromium peak in Fig. 8.
The green color in Patches is caused by a little chromium. Minor amounts of calcite (Figs. 6 and 7), plagioclase (Figs. 10
and 11) (intermediate to sodium-dominant), and phlogopite (Figs. 6 and 9). The X-ray maps in Fig. 12 show where the
calcite is, bright green in the left image, the remaining calcium in the pargasite makes the red color of the silicon more
orangey. Magnesium follows the calcium in the pargasite as is evident by the two maps. The material is essentially a
metamorphic rock with minor pyrite.  It is interesting to note that most of the iron is basically in the pyrite. Minor
amounts of titanium (mainly in the phlogopite) and chromium, vanadium, barium and strontium have been found in the
specimen and are shown in Table 1.


Date:  April 17, 2021                     Signature
An orange sphere sourced from Brazil and offered under labels including Orchid Calcite and Brazilian Sunstone.
Finding: Bulk analysis shows the stone is dominantly calcite: an impure marble formed from metamorphosed limestone. Potassium feldspar, diopside, quartz, muscovite and calcic plagioclase occur as inclusions. It is not the feldspar gem sunstone.
Report: Sample 9239, specimen 10, completed April 20, 2021. Brazil is supplied locality information. The specific laboratory report identifies the submitted sphere, not every piece sold under these labels.
Use this guide alongside the written findings and the original report transcript. It explains the purpose of each analytical figure and preserves the laboratory’s own figure labels. The interpretations apply to the tested specimen; signals alone do not establish the identity of every similar-looking stone.
Electron microscope image: This view shows small-scale regions selected for analysis. Its brightness contrast helps distinguish regions with different compositions; it is not a photograph of their natural colors. Numbered spots connect this view to the analyses listed in the report.
Laboratory figure caption: Fig. 2: Backscattered electron image of area 1 in sample 10.
Elemental spectrum: The peaks record characteristic X-ray signals from elements in the analyzed spot or area. This is an analysis of that location, not automatically of the entire specimen. Any mineral identification or uncertainty named in the laboratory caption is retained below.
Laboratory figure caption: Fig. 3: Energy dispersive spectrum of spot 1 in Fig. 2. (potasssium feldspar)
Elemental spectrum: The peaks record characteristic X-ray signals from elements in the analyzed spot or area. This is an analysis of that location, not automatically of the entire specimen. Any mineral identification or uncertainty named in the laboratory caption is retained below.
Laboratory figure caption: Fig. 4: Energy dispersive spectrum of spot 2 in Fig. 2. (diopside)
Elemental spectrum: The peaks record characteristic X-ray signals from elements in the analyzed spot or area. This is an analysis of that location, not automatically of the entire specimen. Any mineral identification or uncertainty named in the laboratory caption is retained below.
Laboratory figure caption: Fig. 5: Energy dispersive spectrum of spot 3 in Fig. 2. (quartz)
Electron microscope image: This view shows small-scale regions selected for analysis. Its brightness contrast helps distinguish regions with different compositions; it is not a photograph of their natural colors. Numbered spots connect this view to the analyses listed in the report.
Laboratory figure caption: Fig. 6: Backscattered electron image of area 2 in sample 10.
Elemental spectrum: The peaks record characteristic X-ray signals from elements in the analyzed spot or area. This is an analysis of that location, not automatically of the entire specimen. Any mineral identification or uncertainty named in the laboratory caption is retained below.
Laboratory figure caption: Fig. 7: Energy dispersive spectrum of spot 1 in Fig. 36. (muscovite).
Elemental spectrum: The peaks record characteristic X-ray signals from elements in the analyzed spot or area. This is an analysis of that location, not automatically of the entire specimen. Any mineral identification or uncertainty named in the laboratory caption is retained below.
Laboratory figure caption: Fig. 8: Energy dispersive spectrum of spot 1 in Fig. 36. (calcic plagioclase).
Element map: This map shows where the named elements occur within the analyzed area. Its colors represent the laboratory’s selected element channels, rather than the specimen’s visible colors. The caption below preserves any color key or distribution noted by the laboratory.
The following text and tables are transcribed from the original laboratory document. Figure captions identify the report images; the laboratory interpretations and limitations are preserved.
Laboratory report 1
Analytical Result Report
Sample id: 9239 (sample 10, orange sphere)
Submitted by: K. Bitner
Date submitted: March 27, 2021.
Date completed: April 20, 2021.
Operating conditions: An AMRAY 1830 SEM operated at 25 kV acceleration potential, 26 mm working distance, 15 degrees sample tilt, coated with 250 Å carbon. Using the X-ray fluorescence attachment with 35kv potental in conjunction with the EDS system.
Fig. 1: Photograph of the specimen #10, 4.5 cm diameter.
Fig. 2: Backscattered electron image of area 1 in sample 10.
.
Fig. 3: Energy dispersive spectrum of spot 1 in Fig. 2. (potasssium feldspar)
)
Fig. 4: Energy dispersive spectrum of spot 2 in Fig. 2. (diopside)
Fig. 5: Energy dispersive spectrum of spot 3 in Fig. 2. (quartz)
Fig. 6: Backscattered electron image of area 2 in sample 10.
Fig. 7: Energy dispersive spectrum of spot 1 in Fig. 36. (muscovite).
Fig. 8: Energy dispersive spectrum of spot 1 in Fig. 36. (calcic plagioclase).
Summary of findings: This is a very pretty specimen (Fig. 1). Backscattered electron images show several inclusions (Figs.2 and 6): Potassium feldspar (Fig. 3), diopside (Fig. 4), quartz (Fig. 5), muscovite (Fig. 7), and calcic plagioclase (Fig. 8), likely something in the labradorite range of composition. X-ray mapping shows nicely some of the species showing up, the bright green appearing potassium feldspar, quartz grains associated with the diopside for example. The bulk composition (Table 1) clearly shows that it is dominantly calcite. The material is essentially a metamorphic rock, an impure marble, which started out as a limestone with a few clastic grains that in some cases at least in part survived metamorphism like quartz, in other cases they came into being as a result of interaction of the clasts with calcite, as for example diopside. Likely, the original limestone contained some magnesium that then may have ended up in the diopside.
Date: April 20, 2021 Signature
An orange sphere sourced from Brazil and offered under labels including Orchid Calcite and Brazilian Sunstone.
Finding: Bulk analysis shows the stone is dominantly calcite: an impure marble formed from metamorphosed limestone. Potassium feldspar, diopside, quartz, muscovite and calcic plagioclase occur as inclusions. It is not the feldspar gem sunstone.
Market-name context: An alternate name for this calcite-rich material.
Report: Sample 9239, specimen 10, completed April 20, 2021. Brazil is supplied locality information. The specific laboratory report identifies the submitted sphere, not every piece sold under these labels.
Use this guide alongside the written findings and the original report transcript. It explains the purpose of each analytical figure and preserves the laboratory’s own figure labels. The interpretations apply to the tested specimen; signals alone do not establish the identity of every similar-looking stone.
Electron microscope image: This view shows small-scale regions selected for analysis. Its brightness contrast helps distinguish regions with different compositions; it is not a photograph of their natural colors. Numbered spots connect this view to the analyses listed in the report.
Laboratory figure caption: Fig. 2: Backscattered electron image of area 1 in sample 10.
Elemental spectrum: The peaks record characteristic X-ray signals from elements in the analyzed spot or area. This is an analysis of that location, not automatically of the entire specimen. Any mineral identification or uncertainty named in the laboratory caption is retained below.
Laboratory figure caption: Fig. 3: Energy dispersive spectrum of spot 1 in Fig. 2. (potasssium feldspar)
Elemental spectrum: The peaks record characteristic X-ray signals from elements in the analyzed spot or area. This is an analysis of that location, not automatically of the entire specimen. Any mineral identification or uncertainty named in the laboratory caption is retained below.
Laboratory figure caption: Fig. 4: Energy dispersive spectrum of spot 2 in Fig. 2. (diopside)
Elemental spectrum: The peaks record characteristic X-ray signals from elements in the analyzed spot or area. This is an analysis of that location, not automatically of the entire specimen. Any mineral identification or uncertainty named in the laboratory caption is retained below.
Laboratory figure caption: Fig. 5: Energy dispersive spectrum of spot 3 in Fig. 2. (quartz)
Electron microscope image: This view shows small-scale regions selected for analysis. Its brightness contrast helps distinguish regions with different compositions; it is not a photograph of their natural colors. Numbered spots connect this view to the analyses listed in the report.
Laboratory figure caption: Fig. 6: Backscattered electron image of area 2 in sample 10.
Elemental spectrum: The peaks record characteristic X-ray signals from elements in the analyzed spot or area. This is an analysis of that location, not automatically of the entire specimen. Any mineral identification or uncertainty named in the laboratory caption is retained below.
Laboratory figure caption: Fig. 7: Energy dispersive spectrum of spot 1 in Fig. 36. (muscovite).
Elemental spectrum: The peaks record characteristic X-ray signals from elements in the analyzed spot or area. This is an analysis of that location, not automatically of the entire specimen. Any mineral identification or uncertainty named in the laboratory caption is retained below.
Laboratory figure caption: Fig. 8: Energy dispersive spectrum of spot 1 in Fig. 36. (calcic plagioclase).
Element map: This map shows where the named elements occur within the analyzed area. Its colors represent the laboratory’s selected element channels, rather than the specimen’s visible colors. The caption below preserves any color key or distribution noted by the laboratory.
The following text and tables are transcribed from the original laboratory document. Figure captions identify the report images; the laboratory interpretations and limitations are preserved.
Laboratory report 1
Analytical Result Report
Sample id: 9239 (sample 10, orange sphere)
Submitted by: K. Bitner
Date submitted: March 27, 2021.
Date completed: April 20, 2021.
Operating conditions: An AMRAY 1830 SEM operated at 25 kV acceleration potential, 26 mm working distance, 15 degrees sample tilt, coated with 250 Å carbon. Using the X-ray fluorescence attachment with 35kv potental in conjunction with the EDS system.
Fig. 1: Photograph of the specimen #10, 4.5 cm diameter.
Fig. 2: Backscattered electron image of area 1 in sample 10.
.
Fig. 3: Energy dispersive spectrum of spot 1 in Fig. 2. (potasssium feldspar)
)
Fig. 4: Energy dispersive spectrum of spot 2 in Fig. 2. (diopside)
Fig. 5: Energy dispersive spectrum of spot 3 in Fig. 2. (quartz)
Fig. 6: Backscattered electron image of area 2 in sample 10.
Fig. 7: Energy dispersive spectrum of spot 1 in Fig. 36. (muscovite).
Fig. 8: Energy dispersive spectrum of spot 1 in Fig. 36. (calcic plagioclase).
Summary of findings: This is a very pretty specimen (Fig. 1). Backscattered electron images show several inclusions (Figs.2 and 6): Potassium feldspar (Fig. 3), diopside (Fig. 4), quartz (Fig. 5), muscovite (Fig. 7), and calcic plagioclase (Fig. 8), likely something in the labradorite range of composition. X-ray mapping shows nicely some of the species showing up, the bright green appearing potassium feldspar, quartz grains associated with the diopside for example. The bulk composition (Table 1) clearly shows that it is dominantly calcite. The material is essentially a metamorphic rock, an impure marble, which started out as a limestone with a few clastic grains that in some cases at least in part survived metamorphism like quartz, in other cases they came into being as a result of interaction of the clasts with calcite, as for example diopside. Likely, the original limestone contained some magnesium that then may have ended up in the diopside.
Date: April 20, 2021 Signature
An orange sphere sourced from Brazil and offered under labels including Orchid Calcite and Brazilian Sunstone.
Finding: Bulk analysis shows the stone is dominantly calcite: an impure marble formed from metamorphosed limestone. Potassium feldspar, diopside, quartz, muscovite and calcic plagioclase occur as inclusions. It is not the feldspar gem sunstone.
Market-name context: The submitted orange sphere is calcite-rich impure marble rather than feldspar sunstone.
Report: Sample 9239, specimen 10, completed April 20, 2021. Brazil is supplied locality information. The specific laboratory report identifies the submitted sphere, not every piece sold under these labels.
Use this guide alongside the written findings and the original report transcript. It explains the purpose of each analytical figure and preserves the laboratory’s own figure labels. The interpretations apply to the tested specimen; signals alone do not establish the identity of every similar-looking stone.
Electron microscope image: This view shows small-scale regions selected for analysis. Its brightness contrast helps distinguish regions with different compositions; it is not a photograph of their natural colors. Numbered spots connect this view to the analyses listed in the report.
Laboratory figure caption: Fig. 2: Backscattered electron image of area 1 in sample 10.
Elemental spectrum: The peaks record characteristic X-ray signals from elements in the analyzed spot or area. This is an analysis of that location, not automatically of the entire specimen. Any mineral identification or uncertainty named in the laboratory caption is retained below.
Laboratory figure caption: Fig. 3: Energy dispersive spectrum of spot 1 in Fig. 2. (potasssium feldspar)
Elemental spectrum: The peaks record characteristic X-ray signals from elements in the analyzed spot or area. This is an analysis of that location, not automatically of the entire specimen. Any mineral identification or uncertainty named in the laboratory caption is retained below.
Laboratory figure caption: Fig. 4: Energy dispersive spectrum of spot 2 in Fig. 2. (diopside)
Elemental spectrum: The peaks record characteristic X-ray signals from elements in the analyzed spot or area. This is an analysis of that location, not automatically of the entire specimen. Any mineral identification or uncertainty named in the laboratory caption is retained below.
Laboratory figure caption: Fig. 5: Energy dispersive spectrum of spot 3 in Fig. 2. (quartz)
Electron microscope image: This view shows small-scale regions selected for analysis. Its brightness contrast helps distinguish regions with different compositions; it is not a photograph of their natural colors. Numbered spots connect this view to the analyses listed in the report.
Laboratory figure caption: Fig. 6: Backscattered electron image of area 2 in sample 10.
Elemental spectrum: The peaks record characteristic X-ray signals from elements in the analyzed spot or area. This is an analysis of that location, not automatically of the entire specimen. Any mineral identification or uncertainty named in the laboratory caption is retained below.
Laboratory figure caption: Fig. 7: Energy dispersive spectrum of spot 1 in Fig. 36. (muscovite).
Elemental spectrum: The peaks record characteristic X-ray signals from elements in the analyzed spot or area. This is an analysis of that location, not automatically of the entire specimen. Any mineral identification or uncertainty named in the laboratory caption is retained below.
Laboratory figure caption: Fig. 8: Energy dispersive spectrum of spot 1 in Fig. 36. (calcic plagioclase).
Element map: This map shows where the named elements occur within the analyzed area. Its colors represent the laboratory’s selected element channels, rather than the specimen’s visible colors. The caption below preserves any color key or distribution noted by the laboratory.
The following text and tables are transcribed from the original laboratory document. Figure captions identify the report images; the laboratory interpretations and limitations are preserved.
Laboratory report 1
Analytical Result Report
Sample id: 9239 (sample 10, orange sphere)
Submitted by: K. Bitner
Date submitted: March 27, 2021.
Date completed: April 20, 2021.
Operating conditions: An AMRAY 1830 SEM operated at 25 kV acceleration potential, 26 mm working distance, 15 degrees sample tilt, coated with 250 Å carbon. Using the X-ray fluorescence attachment with 35kv potental in conjunction with the EDS system.
Fig. 1: Photograph of the specimen #10, 4.5 cm diameter.
Fig. 2: Backscattered electron image of area 1 in sample 10.
.
Fig. 3: Energy dispersive spectrum of spot 1 in Fig. 2. (potasssium feldspar)
)
Fig. 4: Energy dispersive spectrum of spot 2 in Fig. 2. (diopside)
Fig. 5: Energy dispersive spectrum of spot 3 in Fig. 2. (quartz)
Fig. 6: Backscattered electron image of area 2 in sample 10.
Fig. 7: Energy dispersive spectrum of spot 1 in Fig. 36. (muscovite).
Fig. 8: Energy dispersive spectrum of spot 1 in Fig. 36. (calcic plagioclase).
Summary of findings: This is a very pretty specimen (Fig. 1). Backscattered electron images show several inclusions (Figs.2 and 6): Potassium feldspar (Fig. 3), diopside (Fig. 4), quartz (Fig. 5), muscovite (Fig. 7), and calcic plagioclase (Fig. 8), likely something in the labradorite range of composition. X-ray mapping shows nicely some of the species showing up, the bright green appearing potassium feldspar, quartz grains associated with the diopside for example. The bulk composition (Table 1) clearly shows that it is dominantly calcite. The material is essentially a metamorphic rock, an impure marble, which started out as a limestone with a few clastic grains that in some cases at least in part survived metamorphism like quartz, in other cases they came into being as a result of interaction of the clasts with calcite, as for example diopside. Likely, the original limestone contained some magnesium that then may have ended up in the diopside.
Date: April 20, 2021 Signature
Two colorful Australian specimens examined to distinguish jasper from chalcedony.
Finding: Both specimens were composed of more than 99 weight percent silicon dioxide (quartz). Minor iron and manganese-related phases account for the ochre, red, brown and dark hues. The researcher favors jasper as the descriptive name.
Report: Sample 9247, specimen 17a and 17b, completed May 3, 2021. The tested pieces support the jasper identification; results apply to those specimens.
Use this guide alongside the written findings and the original report transcript. It explains the purpose of each analytical figure and preserves the laboratory’s own figure labels. The interpretations apply to the tested specimen; signals alone do not establish the identity of every similar-looking stone.
Electron microscope image: This view shows small-scale regions selected for analysis. Its brightness contrast helps distinguish regions with different compositions; it is not a photograph of their natural colors. Numbered spots connect this view to the analyses listed in the report.
Laboratory figure caption: Fig. 2: Backscattered electron image of sample 17a.
Elemental spectrum: The peaks record characteristic X-ray signals from elements in the analyzed spot or area. This is an analysis of that location, not automatically of the entire specimen. Any mineral identification or uncertainty named in the laboratory caption is retained below.
Laboratory figure caption: Fig. 3: Energy dispersive spectral analysis of spot 1 in Fig. 2. (quartz)
Electron microscope image: This view shows small-scale regions selected for analysis. Its brightness contrast helps distinguish regions with different compositions; it is not a photograph of their natural colors. Numbered spots connect this view to the analyses listed in the report.
Laboratory figure caption: Fig. 4: Backscattered electron image of sample 17b.
Elemental spectrum: The peaks record characteristic X-ray signals from elements in the analyzed spot or area. This is an analysis of that location, not automatically of the entire specimen. Any mineral identification or uncertainty named in the laboratory caption is retained below.
Laboratory figure caption: Fig. 5: Energy dispersive spectral analysis of spot 1 in Fig. 4. (quartz)
Read the original laboratory report as text
The following text and tables are transcribed from the original laboratory document. Figure captions identify the report images; the laboratory interpretations and limitations are preserved.
Laboratory report 1
Analytical Result Report
Sample id: 9247 (sample 17, jasper/chalcedony)
Submitted by: K. Bitner
Date submitted: March 27, 2021.
Date completed: May 3, 2021.
Operating conditions: An AMRAY 1830 SEM operated at 25 kV acceleration potential, 26 mm working distance, 15 degrees sample tilt, coated with 250 Å carbon. Using the X-ray fluorescence attachment with 35kVpotental in conjunction with the EDS system.
Fig. 1: Photograph of the specimens #17a and 17b, 5 cm maximum dimension.
Fig. 2: Backscattered electron image of sample 17a.
Fig. 3: Energy dispersive spectral analysis of spot 1 in Fig. 2. (quartz)
Fig. 4: Backscattered electron image of sample 17b.
Fig. 5: Energy dispersive spectral analysis of spot 1 in Fig. 4. (quartz)
Table 1: Trace elements in ppm in sample 17.
Laboratory data as recorded in the report
17a
17b
Aluminum
0.50
0.53
Calcium
0.05
0.04
Iron
0.14
0.13
Manganese
0.06
0.05
Titanium
0.14
0.11
Summary of findings: These specimens (Fig. 1) are composed to over 99 wt. % of silicon dioxide, quartz (Figs. 2-5). The colors are essentially caused by a fraction of a weight percent, dominantly iron, with lesser effects of manganese (Table 1). The ochre to tan or brown hues are dominantly caused by goethite, the red ones by hematite and black portions are colored by manganese oxide species. The other elements don’t play a role in the colors. Chalcedony versus jasper can be a close call, chalcedony has a tendency to be more translucent and jasper a bit less with pronounced ochres, reds and browns. I would be more inclined to call it a jasper.
Zultanite Imitation SS Jewelry · May 2025 · Soul Body Gems collection photograph.
A pendant sold as Zultanite had a man-made neodymium-rich potassium silicate glass center stone, not natural diaspore. The clear melee are zirconium oxide and the setting is sterling silver.
Report: Sample 1198, completed December 14, 2024. The report identifies this pendant, not every item sold as Zultanite. It does not prove a branded glass manufacturer.
Two stones submitted as diaspore—a loose faceted stone and a ring stone—were identified as man-made glass.
Sample 1090 · October 1, 2024.
The laboratory compared both stones with a natural Turkish diaspore crystal. The imitations showed neodymium-rich silicate compositions and isotropic optical behavior, unlike the diaspore reference. This finding applies to the tested stones; natural diaspore exists.
Use this guide alongside the written findings and the original report transcript. It explains the purpose of each analytical figure and preserves the laboratory’s own figure labels. The interpretations apply to the tested specimen; signals alone do not establish the identity of every similar-looking stone.
Electron microscope image: This view shows small-scale regions selected for analysis. Its brightness contrast helps distinguish regions with different compositions; it is not a photograph of their natural colors. Numbered spots connect this view to the analyses listed in the report.
Laboratory figure caption: Fig.2: Backscattered electron images of the areas of the specimen.s analyzed Left: large loose stone, right: stone set in ring.
Elemental spectrum: The peaks record characteristic X-ray signals from elements in the analyzed spot or area. This is an analysis of that location, not automatically of the entire specimen. Any mineral identification or uncertainty named in the laboratory caption is retained below.
Laboratory figure caption: Fig. 3: Energy dispersive spectrum of spot 1 in Fig. 2. left (glass)
Elemental spectrum: The peaks record characteristic X-ray signals from elements in the analyzed spot or area. This is an analysis of that location, not automatically of the entire specimen. Any mineral identification or uncertainty named in the laboratory caption is retained below.
Laboratory figure caption: Fig. 4: Energy dispersive spectrum of spot 1 in Fig. 2 right (glass as for the loose stone)
Elemental spectrum: The peaks record characteristic X-ray signals from elements in the analyzed spot or area. This is an analysis of that location, not automatically of the entire specimen. Any mineral identification or uncertainty named in the laboratory caption is retained below.
Laboratory figure caption: Fig. 6: Energy dispersive spectrum of the specimen shown in Fig. 5.
Electron microscope image: This view shows small-scale regions selected for analysis. Its brightness contrast helps distinguish regions with different compositions; it is not a photograph of their natural colors. Numbered spots connect this view to the analyses listed in the report.
Laboratory figure caption: Fig.2: Backscattered electron image of an area of the specimen.
Elemental spectrum: The peaks record characteristic X-ray signals from elements in the analyzed spot or area. This is an analysis of that location, not automatically of the entire specimen. Any mineral identification or uncertainty named in the laboratory caption is retained below.
Laboratory figure caption: Fig. 3: Energy dispersive spectrum of spot 1 in Fig. 2. (neodymium-rich man-made material - glass)
Elemental spectrum: The peaks record characteristic X-ray signals from elements in the analyzed spot or area. This is an analysis of that location, not automatically of the entire specimen. Any mineral identification or uncertainty named in the laboratory caption is retained below.
Laboratory figure caption: Fig. 4: Energy dispersive spectrum of spot 2 in Fig. 2 (zirconium oxide).
Elemental spectrum: The peaks record characteristic X-ray signals from elements in the analyzed spot or area. This is an analysis of that location, not automatically of the entire specimen. Any mineral identification or uncertainty named in the laboratory caption is retained below.
Laboratory figure caption: Fig. 5: Energy dispersive spectrum of spot 3 in Fig. 2 (silver alloy).
Read the complete report as text
Analytical Result Report
Sample id: 1090 (#1, diaspore)
Submitted by: Soul Body Gems
Date completed: 10-1-2024
Operating conditions: An AMRAY 1830 SEM operated at 25 kV acceleration potential, 24 mm working distance, 0 degrees sample tilt, coated with 250 Å carbon, and also using the attached XRF unit operated at 30 kV.
Fig. 1: Photograph of the specimen. Approximately 18mm maximum dimension for the large cut stone.
Fig.2: Backscattered electron images of the areas of the specimen.s analyzed Left: large loose stone, right: stone set in ring.
Fig. 3: Energy dispersive spectrum of spot 1 in Fig. 2. left (glass)
Fig. 4: Energy dispersive spectrum of spot 1 in Fig. 2 right (glass as for the loose stone)
Fig. 5: a crystal of diaspore for comparison. 6.5 cm maximum dimension.
Fig. 6: Energy dispersive spectrum of the specimen shown in Fig. 5.
Table 1: comparison of compositions of the specimens in wt. %.
Laboratory data as recorded in the report
Element
Reference specimen from Fig. 5
Unmounted stone
Stone from ring
Al
43.1
0.59
0.39
Calcium
0.02
0.04
0.55
Chromium
0.02
nd
0.04
Copper
0.07
0.18
0.15
Iron
0.41
0.04
0.05
Magnesium
0.47
0.30
0.27
Manganese
0.04
nd
0.01
Neodymium
nd
7.55
8.11
Potassium
0.01
7.25
7.88
Silicon
0.33
34.5
32.53
Sodium
0.03
3.33
4.55
Titanium
0.03
0.08
0.07
Vanadium
0.03
0.46
0.78
Zinc
0.05
0.50
0.66
Fig. 7: Photographs of the large stone in polarized light. Left: plane polarized light, right: crossed Nichols.
Summary of findings: These two specimens (Fig. 1) are not diaspore! They are booth a man-made glass with a composition to simulate the well-known Turkish diaspores (Figs. 2-4, 7 and Table 1. I diaspore crystal from the Turkish location was also analyzed for comparison. Table 1 shows the results. In particular, the neodymium content is clear evidence that the material was man-made. Neodymium does not occur alone in natural minerals, other lanthanides are always present. Last not least, the isotropic optical behavior of the material is demonstrated in Fig. 7. It behaves like glass.
Date: 10-1-2024 Signature
Read the laboratory document as text
Text and tables from the laboratory document are provided below. Consult the adjacent findings for the interpretation of each tested specimen.
Laboratory document 1
Analytical Result Report
Sample id: 1198 (zultanite pendant)
Submitted by: Soul Body Gems
Date completed: 12-14-2024
Operating conditions: An AMRAY 1830 SEM operated at 25 kV acceleration potential, 24 mm working distance, 0 degrees sample tilt, coated with 250 Å carbon, and also using the attached XRF unit operated at 30 kV.
Fig. 1: Photograph of the specimens. 4.8cm maximum dimensions
Fig.2: Backscattered electron image of an area of the specimen.
Fig. 3: Energy dispersive spectrum of spot 1 in Fig. 2. (neodymium-rich man-made material - glass)
Fig. 4: Energy dispersive spectrum of spot 2 in Fig. 2 (zirconium oxide).
Fig. 5: Energy dispersive spectrum of spot 3 in Fig. 2 (silver alloy).
Summary of findings: This specimen (Fig. 1) has a large synthetic stone in it, it is a neodymium-rich potassium silicate (Figs. 2 and 3). It contains a little over 8 wt. % neodymium but is lacking other rare earth elements. There are no natural materials that contain only neodymium excluding other rare Earth elements. It is man-made. It is not natural. This is glass. It is not zultanite. The colorless melee stones are zirconium oxide (Figs. 2 and 4), commonly referred to as ‘cubic’ zirconia. The cubic/isometric form exists only at high temperature, the low temperature polymorph is orthorhombic. The melees (small side stones) are also man-made. The silver alloy (Figs. 2 and 5) is sterling silver’
Zultanite Imitation SS Jewelry · May 2025 · Soul Body Gems collection photograph.
The submitted pendant contained neodymium-rich glass, a man-made material that can imitate a color-changing gem. It was not natural Zultanite.
Report: Sample 1198, completed December 14, 2024. Zandrite is a name used for man-made color-change glass; this report cannot establish that the tested stone was a branded Zandrite product.
Two stones submitted as diaspore—a loose faceted stone and a ring stone—were identified as man-made glass.
Sample 1090 · October 1, 2024.
The laboratory compared both stones with a natural Turkish diaspore crystal. The imitations showed neodymium-rich silicate compositions and isotropic optical behavior, unlike the diaspore reference. This finding applies to the tested stones; natural diaspore exists.
Use this guide alongside the written findings and the original report transcript. It explains the purpose of each analytical figure and preserves the laboratory’s own figure labels. The interpretations apply to the tested specimen; signals alone do not establish the identity of every similar-looking stone.
Electron microscope image: This view shows small-scale regions selected for analysis. Its brightness contrast helps distinguish regions with different compositions; it is not a photograph of their natural colors. Numbered spots connect this view to the analyses listed in the report.
Laboratory figure caption: Fig.2: Backscattered electron images of the areas of the specimen.s analyzed Left: large loose stone, right: stone set in ring.
Elemental spectrum: The peaks record characteristic X-ray signals from elements in the analyzed spot or area. This is an analysis of that location, not automatically of the entire specimen. Any mineral identification or uncertainty named in the laboratory caption is retained below.
Laboratory figure caption: Fig. 3: Energy dispersive spectrum of spot 1 in Fig. 2. left (glass)
Elemental spectrum: The peaks record characteristic X-ray signals from elements in the analyzed spot or area. This is an analysis of that location, not automatically of the entire specimen. Any mineral identification or uncertainty named in the laboratory caption is retained below.
Laboratory figure caption: Fig. 4: Energy dispersive spectrum of spot 1 in Fig. 2 right (glass as for the loose stone)
Elemental spectrum: The peaks record characteristic X-ray signals from elements in the analyzed spot or area. This is an analysis of that location, not automatically of the entire specimen. Any mineral identification or uncertainty named in the laboratory caption is retained below.
Laboratory figure caption: Fig. 6: Energy dispersive spectrum of the specimen shown in Fig. 5.
Electron microscope image: This view shows small-scale regions selected for analysis. Its brightness contrast helps distinguish regions with different compositions; it is not a photograph of their natural colors. Numbered spots connect this view to the analyses listed in the report.
Laboratory figure caption: Fig.2: Backscattered electron image of an area of the specimen.
Elemental spectrum: The peaks record characteristic X-ray signals from elements in the analyzed spot or area. This is an analysis of that location, not automatically of the entire specimen. Any mineral identification or uncertainty named in the laboratory caption is retained below.
Laboratory figure caption: Fig. 3: Energy dispersive spectrum of spot 1 in Fig. 2. (neodymium-rich man-made material - glass)
Elemental spectrum: The peaks record characteristic X-ray signals from elements in the analyzed spot or area. This is an analysis of that location, not automatically of the entire specimen. Any mineral identification or uncertainty named in the laboratory caption is retained below.
Laboratory figure caption: Fig. 4: Energy dispersive spectrum of spot 2 in Fig. 2 (zirconium oxide).
Elemental spectrum: The peaks record characteristic X-ray signals from elements in the analyzed spot or area. This is an analysis of that location, not automatically of the entire specimen. Any mineral identification or uncertainty named in the laboratory caption is retained below.
Laboratory figure caption: Fig. 5: Energy dispersive spectrum of spot 3 in Fig. 2 (silver alloy).
Read the complete report as text
Analytical Result Report
Sample id: 1090 (#1, diaspore)
Submitted by: Soul Body Gems
Date completed: 10-1-2024
Operating conditions: An AMRAY 1830 SEM operated at 25 kV acceleration potential, 24 mm working distance, 0 degrees sample tilt, coated with 250 Å carbon, and also using the attached XRF unit operated at 30 kV.
Fig. 1: Photograph of the specimen. Approximately 18mm maximum dimension for the large cut stone.
Fig.2: Backscattered electron images of the areas of the specimen.s analyzed Left: large loose stone, right: stone set in ring.
Fig. 3: Energy dispersive spectrum of spot 1 in Fig. 2. left (glass)
Fig. 4: Energy dispersive spectrum of spot 1 in Fig. 2 right (glass as for the loose stone)
Fig. 5: a crystal of diaspore for comparison. 6.5 cm maximum dimension.
Fig. 6: Energy dispersive spectrum of the specimen shown in Fig. 5.
Table 1: comparison of compositions of the specimens in wt. %.
Laboratory data as recorded in the report
Element
Reference specimen from Fig. 5
Unmounted stone
Stone from ring
Al
43.1
0.59
0.39
Calcium
0.02
0.04
0.55
Chromium
0.02
nd
0.04
Copper
0.07
0.18
0.15
Iron
0.41
0.04
0.05
Magnesium
0.47
0.30
0.27
Manganese
0.04
nd
0.01
Neodymium
nd
7.55
8.11
Potassium
0.01
7.25
7.88
Silicon
0.33
34.5
32.53
Sodium
0.03
3.33
4.55
Titanium
0.03
0.08
0.07
Vanadium
0.03
0.46
0.78
Zinc
0.05
0.50
0.66
Fig. 7: Photographs of the large stone in polarized light. Left: plane polarized light, right: crossed Nichols.
Summary of findings: These two specimens (Fig. 1) are not diaspore! They are booth a man-made glass with a composition to simulate the well-known Turkish diaspores (Figs. 2-4, 7 and Table 1. I diaspore crystal from the Turkish location was also analyzed for comparison. Table 1 shows the results. In particular, the neodymium content is clear evidence that the material was man-made. Neodymium does not occur alone in natural minerals, other lanthanides are always present. Last not least, the isotropic optical behavior of the material is demonstrated in Fig. 7. It behaves like glass.
Date: 10-1-2024 Signature
Read the laboratory document as text
Text and tables from the laboratory document are provided below. Consult the adjacent findings for the interpretation of each tested specimen.
Laboratory document 1
Analytical Result Report
Sample id: 1198 (zultanite pendant)
Submitted by: Soul Body Gems
Date completed: 12-14-2024
Operating conditions: An AMRAY 1830 SEM operated at 25 kV acceleration potential, 24 mm working distance, 0 degrees sample tilt, coated with 250 Å carbon, and also using the attached XRF unit operated at 30 kV.
Fig. 1: Photograph of the specimens. 4.8cm maximum dimensions
Fig.2: Backscattered electron image of an area of the specimen.
Fig. 3: Energy dispersive spectrum of spot 1 in Fig. 2. (neodymium-rich man-made material - glass)
Fig. 4: Energy dispersive spectrum of spot 2 in Fig. 2 (zirconium oxide).
Fig. 5: Energy dispersive spectrum of spot 3 in Fig. 2 (silver alloy).
Summary of findings: This specimen (Fig. 1) has a large synthetic stone in it, it is a neodymium-rich potassium silicate (Figs. 2 and 3). It contains a little over 8 wt. % neodymium but is lacking other rare earth elements. There are no natural materials that contain only neodymium excluding other rare Earth elements. It is man-made. It is not natural. This is glass. It is not zultanite. The colorless melee stones are zirconium oxide (Figs. 2 and 4), commonly referred to as ‘cubic’ zirconia. The cubic/isometric form exists only at high temperature, the low temperature polymorph is orthorhombic. The melees (small side stones) are also man-made. The silver alloy (Figs. 2 and 5) is sterling silver’
Persian Variscite Various Polished Shapes · Soul Body Gems, November 2024.
The tested tower is an aluminum phosphate, with variscite the researcher's preferred identification; some pyrite was present.
Report: Sample 1112, completed November 16, 2024. Persia is supplied locality information and was not independently established by the laboratory report.
Use this guide alongside the written findings and the original report transcript. It explains the purpose of each analytical figure and preserves the laboratory’s own figure labels. The interpretations apply to the tested specimen; signals alone do not establish the identity of every similar-looking stone.
Electron microscope image: This view shows small-scale regions selected for analysis. Its brightness contrast helps distinguish regions with different compositions; it is not a photograph of their natural colors. Numbered spots connect this view to the analyses listed in the report.
Laboratory figure caption: Fig.2: Backscattered electron images of the areas of the specimen.s analyzed Left: large loose stone, right: stone set in ring.
Elemental spectrum: The peaks record characteristic X-ray signals from elements in the analyzed spot or area. This is an analysis of that location, not automatically of the entire specimen. Any mineral identification or uncertainty named in the laboratory caption is retained below.
Laboratory figure caption: Fig. 3: Energy dispersive spectrum of spot 1 in Fig. 2. (aluminum phosphate, such as variscite)
Elemental spectrum: The peaks record characteristic X-ray signals from elements in the analyzed spot or area. This is an analysis of that location, not automatically of the entire specimen. Any mineral identification or uncertainty named in the laboratory caption is retained below.
Laboratory figure caption: Fig. 4: Energy dispersive spectrum of spot 2 in Fig. 2 (pyrite)
Read the original laboratory report as text
The following text and tables are transcribed from the original laboratory document. Figure captions identify the report images; the laboratory interpretations and limitations are preserved.
Laboratory report 1
                                               Analytical Result Report

Sample id: 1112 (variscite tower)
Submitted by: Soul Body Gems
Date completed: 11-16-2024
Operating conditions: An AMRAY 1830 SEM operated at 25 kV acceleration potential, 24 mm working distance, 0
degrees sample tilt, coated with 250 Å carbon, and also using the attached XRF unit operated at 30 kV.

       @soulbodygems


Fig. 1: Photograph of the specimen. Approximately 45 mm maximum dimension.


Fig.2: Backscattered electron images of the areas of the specimen.s analyzed Left: large loose stone, right: stone set in
ring.
Fig. 3: Energy dispersive spectrum of spot 1 in Fig. 2. (aluminum phosphate, such as variscite)


             @soulbodygems


Fig. 4: Energy dispersive spectrum of spot 2 in Fig. 2 (pyrite)


Table 1: Trace and minor elemenys in the phosphate, in wt. %.

 Chromium                                              0.08
 Iron                                                    0.25
 Vanadium                                              0.38


Summary of findings: This specimen (Fig. 1) is indeed an aluminum phosphate (Figs. 2 and 3). Variscite is the best
choice as other aluminum phosphates such as wavellite tend to be coarser-grained and often show radiating crystal
aggregates. Some pyrite was noted (Figs. 2 and 4). This is very reminiscent of the variscite/wavellite occurrences in
Arkansas such as near Avant. A deep-sea sediment, dark color and rich in vanadium and sulfides was present there and
these phosphates were colored green to blue from trivalent vanadium derived from the deep-sea sediments. This
material; may have been derived from a very similar environment elsewhere.


Date:  11-16-2024            Signature
Persian Variscite Various Polished Shapes · Soul Body Gems, November 2024.
The tested tower is an aluminum phosphate, with variscite the researcher's preferred identification; some pyrite was present.
Report: Sample 1112, completed November 16, 2024. Alternate index name for the same tower. Its geographic origin was not verified by this mineralogical test.
Use this guide alongside the written findings and the original report transcript. It explains the purpose of each analytical figure and preserves the laboratory’s own figure labels. The interpretations apply to the tested specimen; signals alone do not establish the identity of every similar-looking stone.
Electron microscope image: This view shows small-scale regions selected for analysis. Its brightness contrast helps distinguish regions with different compositions; it is not a photograph of their natural colors. Numbered spots connect this view to the analyses listed in the report.
Laboratory figure caption: Fig.2: Backscattered electron images of the areas of the specimen.s analyzed Left: large loose stone, right: stone set in ring.
Elemental spectrum: The peaks record characteristic X-ray signals from elements in the analyzed spot or area. This is an analysis of that location, not automatically of the entire specimen. Any mineral identification or uncertainty named in the laboratory caption is retained below.
Laboratory figure caption: Fig. 3: Energy dispersive spectrum of spot 1 in Fig. 2. (aluminum phosphate, such as variscite)
Elemental spectrum: The peaks record characteristic X-ray signals from elements in the analyzed spot or area. This is an analysis of that location, not automatically of the entire specimen. Any mineral identification or uncertainty named in the laboratory caption is retained below.
Laboratory figure caption: Fig. 4: Energy dispersive spectrum of spot 2 in Fig. 2 (pyrite)
Read the original laboratory report as text
The following text and tables are transcribed from the original laboratory document. Figure captions identify the report images; the laboratory interpretations and limitations are preserved.
Laboratory report 1
                                               Analytical Result Report

Sample id: 1112 (variscite tower)
Submitted by: Soul Body Gems
Date completed: 11-16-2024
Operating conditions: An AMRAY 1830 SEM operated at 25 kV acceleration potential, 24 mm working distance, 0
degrees sample tilt, coated with 250 Å carbon, and also using the attached XRF unit operated at 30 kV.

       @soulbodygems


Fig. 1: Photograph of the specimen. Approximately 45 mm maximum dimension.


Fig.2: Backscattered electron images of the areas of the specimen.s analyzed Left: large loose stone, right: stone set in
ring.
Fig. 3: Energy dispersive spectrum of spot 1 in Fig. 2. (aluminum phosphate, such as variscite)


             @soulbodygems


Fig. 4: Energy dispersive spectrum of spot 2 in Fig. 2 (pyrite)


Table 1: Trace and minor elemenys in the phosphate, in wt. %.

 Chromium                                              0.08
 Iron                                                    0.25
 Vanadium                                              0.38


Summary of findings: This specimen (Fig. 1) is indeed an aluminum phosphate (Figs. 2 and 3). Variscite is the best
choice as other aluminum phosphates such as wavellite tend to be coarser-grained and often show radiating crystal
aggregates. Some pyrite was noted (Figs. 2 and 4). This is very reminiscent of the variscite/wavellite occurrences in
Arkansas such as near Avant. A deep-sea sediment, dark color and rich in vanadium and sulfides was present there and
these phosphates were colored green to blue from trivalent vanadium derived from the deep-sea sediments. This
material; may have been derived from a very similar environment elsewhere.


Date:  11-16-2024            Signature
Cobalto Dolomite Stretch Bracelets · Soul Body Gems, September 2024.
Two pink hearts sold under this name were tested. The larger heart contains cobalt-bearing dolomite with quartz and sparse kolwezite; the smaller contains cobalt-bearing magnesite with carrollite and another cobalt-bearing copper sulfide. Calcite was not identified.
Report: Sample 1216, completed December 25, 2024. The market label does not accurately describe either tested heart.
This separate specimen is predominantly calcite with very low cobalt, rather than the dolomite-rich material described above. Its locality is uncertain: Congo or Morocco.
A pink calcite specimen with low manganese and cobalt contents.
Sample 10505 · February 26, 2024.
Locality uncertain: Congo or Morocco.
What the testing revealed
The specimen is predominantly calcite. The measured trace and minor elements include manganese at 0.15 wt.% and cobalt at 0.07 wt.%. The report suggests manganese may contribute to the pink color alongside cobalt; the color mechanism was not conclusively established.
A small calcium-cobalt arsenate inclusion was also found, with roselite proposed as a possible identity. This is not a confirmed roselite identification. The specimen was originally described as cobaltocalcite.
Use this guide alongside the written findings and the original report transcript. It explains the purpose of each analytical figure and preserves the laboratory’s own figure labels. The interpretations apply to the tested specimen; signals alone do not establish the identity of every similar-looking stone.
Electron microscope image: This view shows small-scale regions selected for analysis. Its brightness contrast helps distinguish regions with different compositions; it is not a photograph of their natural colors. Numbered spots connect this view to the analyses listed in the report.
Laboratory figure caption: Fig.2: Backscattered electron image of an area of the specimen.
Elemental spectrum: The peaks record characteristic X-ray signals from elements in the analyzed spot or area. This is an analysis of that location, not automatically of the entire specimen. Any mineral identification or uncertainty named in the laboratory caption is retained below.
Laboratory figure caption: Fig. 3: Energy dispersive spectrum of spot 1 in Fig. 2 (calcium cobalt arsenate)
Elemental spectrum: The peaks record characteristic X-ray signals from elements in the analyzed spot or area. This is an analysis of that location, not automatically of the entire specimen. Any mineral identification or uncertainty named in the laboratory caption is retained below.
Laboratory figure caption: Fig. 4: Energy dispersive spectrum of spot 2 in Fig. 2 (calcite)
Element map: This map shows where the named elements occur within the analyzed area. Its colors represent the laboratory’s selected element channels, rather than the specimen’s visible colors. The caption below preserves any color key or distribution noted by the laboratory.
Laboratory figure caption: Fig. 5: X-ray maps of the area shown in Fig. 2. Arsenic: violet, calcium: yellow.
Elemental spectrum: The peaks record characteristic X-ray signals from elements in the analyzed spot or area. This is an analysis of that location, not automatically of the entire specimen. Any mineral identification or uncertainty named in the laboratory caption is retained below.
Laboratory figure caption: Fig. 3: Energy dispersive spectrum of spot 1 in Fig. 2. (copper cobalt carbonate)
Elemental spectrum: The peaks record characteristic X-ray signals from elements in the analyzed spot or area. This is an analysis of that location, not automatically of the entire specimen. Any mineral identification or uncertainty named in the laboratory caption is retained below.
Laboratory figure caption: Fig. 4: Energy dispersive spectrum of spot 2 in Fig. 2. (quartz)
Elemental spectrum: The peaks record characteristic X-ray signals from elements in the analyzed spot or area. This is an analysis of that location, not automatically of the entire specimen. Any mineral identification or uncertainty named in the laboratory caption is retained below.
Laboratory figure caption: Fig. 5: Energy dispersive spectrum of spot 3 in Fig. 2. (cobalt-bearing dolomite)
Electron microscope image: This view shows small-scale regions selected for analysis. Its brightness contrast helps distinguish regions with different compositions; it is not a photograph of their natural colors. Numbered spots connect this view to the analyses listed in the report.
Laboratory figure caption: Fig.6: Backscattered electron image of another area of the specimen.
Elemental spectrum: The peaks record characteristic X-ray signals from elements in the analyzed spot or area. This is an analysis of that location, not automatically of the entire specimen. Any mineral identification or uncertainty named in the laboratory caption is retained below.
Laboratory figure caption: Fig. 7: Energy dispersive spectrum of spot 1 in Fig. 6. (magnesium cobalt carbonate)
Elemental spectrum: The peaks record characteristic X-ray signals from elements in the analyzed spot or area. This is an analysis of that location, not automatically of the entire specimen. Any mineral identification or uncertainty named in the laboratory caption is retained below.
Laboratory figure caption: Fig. 8: Energy dispersive spectrum of spot 3 in Fig. 6. (carrollite)
Electron microscope image: This view shows small-scale regions selected for analysis. Its brightness contrast helps distinguish regions with different compositions; it is not a photograph of their natural colors. Numbered spots connect this view to the analyses listed in the report.
Laboratory figure caption: Fig.9: Backscattered electron image of another area of the specimen.
Elemental spectrum: The peaks record characteristic X-ray signals from elements in the analyzed spot or area. This is an analysis of that location, not automatically of the entire specimen. Any mineral identification or uncertainty named in the laboratory caption is retained below.
Laboratory figure caption: Fig. 10: Energy dispersive spectrum of spot 1 in Fig. 9. (carrollite)
Elemental spectrum: The peaks record characteristic X-ray signals from elements in the analyzed spot or area. This is an analysis of that location, not automatically of the entire specimen. Any mineral identification or uncertainty named in the laboratory caption is retained below.
Laboratory figure caption: Fig. 11: Energy dispersive spectrum of spot 2 in Fig. 9. (cobalt-bearing copper sulfide)
Elemental spectrum: The peaks record characteristic X-ray signals from elements in the analyzed spot or area. This is an analysis of that location, not automatically of the entire specimen. Any mineral identification or uncertainty named in the laboratory caption is retained below.
Laboratory figure caption: Fig. 12: Energy dispersive spectrum of spot 3 in Fig. 9. (cobalt magnesium carbonate)
Read the complete report as text
Analytical Result Report
Sample id: 10505 (recent package #1)
Submitted by: Soul Body Gems
Date completed: 2-26-2024
Operating conditions: An AMRAY 1830 SEM operated at 25 kV acceleration potential, 24 mm working distance, 0 degrees sample tilt, coated with 250 Å carbon, and also using the attached XRF unit operated at 30 kV.
A BRUKER Titan X-ray fluorescence spectrometer was also used and operated for 30 seconds at 50, 25, and 10 kV.
Fig. 1: Photograph of the specimen. Approximately 20 mm maximum dimension.
Fig.2: Backscattered electron image of an area of the specimen.
Fig. 3: Energy dispersive spectrum of spot 1 in Fig. 2 (calcium cobalt arsenate)
Fig. 4: Energy dispersive spectrum of spot 2 in Fig. 2 (calcite)
Fig. 5: X-ray maps of the area shown in Fig. 2. Arsenic: violet, calcium: yellow.
Table 1: minor and trace elements in the calcite.
Laboratory data as recorded in the report
Element
Reported value
Arsenic
nd
Cobalt
0.07
Iron
0.15
Magnesium
0.14
Manganese
0.15
Summary of findings: This specimen (Fig. 1) is peculiar. It was said to be cobaltocalcite. Cobaltocalcite is CoCO3. Compositionally, it is calcite (Figs. 2 and 4). A small inclusion was spotted on the back of the specimen which is a calcium cobalt arsenate. The mineral roselite would be a potential choice for this little inclusion. This specimen is essentially just calcite, even calling it contain calcite is pushing it in my opinion when the low quantity of cobalt in it is considered. Maybe one could call it low cobalt-bearing calcite? I am actually amazed about the pink color, is so little cobalt could cause this? Maybe the manganese helped with that, there is about double the amount than cobalt (Table 1).
Date: February 26, 2024 Signature
Read the original laboratory report as text
The following text and tables are transcribed from the original laboratory document. Figure captions identify the report images; the laboratory interpretations and limitations are preserved.
Laboratory report 1
Analytical Result Report
Sample id: 1216 (two hearts)
Submitted by: Soul Body Gems
Date completed: 12-25-2024
Operating conditions: An AMRAY 1830 SEM operated at 25 kV acceleration potential, 24 mm working distance, 0 degrees sample tilt, coated with 250 Å carbon, and also using the attached XRF unit operated at 30 kV.
Fig. 1: Photograph of the specimens. 5 and 3.5 cm maximum dimensions.
Large heart
Fig.2: Backscattered electron image of an area of the specimen.
Fig. 3: Energy dispersive spectrum of spot 1 in Fig. 2. (copper cobalt carbonate)
Fig. 4: Energy dispersive spectrum of spot 2 in Fig. 2. (quartz)
Fig. 5: Energy dispersive spectrum of spot 3 in Fig. 2. (cobalt-bearing dolomite)
Small heart
Fig.6: Backscattered electron image of another area of the specimen.
Fig. 7: Energy dispersive spectrum of spot 1 in Fig. 6. (magnesium cobalt carbonate)
Fig. 8: Energy dispersive spectrum of spot 3 in Fig. 6. (carrollite)
Fig.9: Backscattered electron image of another area of the specimen.
Fig. 10: Energy dispersive spectrum of spot 1 in Fig. 9. (carrollite)
Fig. 11: Energy dispersive spectrum of spot 2 in Fig. 9. (cobalt-bearing copper sulfide)
Fig. 12: Energy dispersive spectrum of spot 3 in Fig. 9. (cobalt magnesium carbonate)
Summary of findings: These specimens (Fig. 1) are fantastic! In the large heart, kolwezite (Figs. 2 and 3) occurs sparingly, it is greenish. It is associated with quartz (Figs. 2 and 4) and cobalt-bearing dolomite (Figs. 2 and 5). This imparts the striking deep pink color. In the small heat, a magnesium cobalt carbonate occurs (Figs. 6 and 7), essentially a cobalt-bearing magnesite. Carrollite, a cobalt copper sulfide, is also present (Figs. 6, 8, 9 and 10). It is associated with a lower cobalt copper sulfide (Figs. 9 and 11) and cobalt-bearing magnesite (Figs. 9 and 12). This material is typical for the Kolwezi area in the DR Congo.
Date: 12-25-2024 Signature
Laboratory report 2
Analytical Result Report
Sample id: 10505 (recent package #1)
Submitted by: Soul Body Gems
Date completed: 2-26-2024
Operating conditions: An AMRAY 1830 SEM operated at 25 kV acceleration potential, 24 mm working distance, 0 degrees sample tilt, coated with 250 Å carbon, and also using the attached XRF unit operated at 30 kV.
A BRUKER Titan X-ray fluorescence spectrometer was also used and operated for 30 seconds at 50, 25, and 10 kV.
Fig. 1: Photograph of the specimen. Approximately 20 mm maximum dimension.
Fig.2: Backscattered electron image of an area of the specimen.
Fig. 3: Energy dispersive spectrum of spot 1 in Fig. 2 (calcium cobalt arsenate)
Fig. 4: Energy dispersive spectrum of spot 2 in Fig. 2 (calcite)
Fig. 5: X-ray maps of the area shown in Fig. 2. Arsenic: violet, calcium: yellow.
Table 1: minor and trace elements in the calcite.
Laboratory data as recorded in the report
Element
Reported value
Arsenic
nd
Cobalt
0.07
Iron
0.15
Magnesium
0.14
Manganese
0.15
Summary of findings: This specimen (Fig. 1) is peculiar. It was said to be cobaltocalcite. Cobaltocalcite is CoCO3. Compositionally, it is calcite (Figs. 2 and 4). A small inclusion was spotted on the back of the specimen which is a calcium cobalt arsenate. The mineral roselite would be a potential choice for this little inclusion. This specimen is essentially just calcite, even calling it contain calcite is pushing it in my opinion when the low quantity of cobalt in it is considered. Maybe one could call it low cobalt-bearing calcite? I am actually amazed about the pink color, is so little cobalt could cause this? Maybe the manganese helped with that, there is about double the amount than cobalt (Table 1).
Cobalto Dolomite · September 2025 collection. This photographed piece is separate from the two hearts in test report 1216; its mineral identity was not individually laboratory verified.
Cobalto Dolomite pendants · October 2025 collection. These pictured pieces are separate from the two hearts in report 1216.
The larger pink heart contains cobalt-bearing dolomite with quartz and sparse kolwezite. The smaller tested heart contains cobalt-bearing magnesite and sulfides; calcite was not identified.
Report: Sample 1216, completed December 25, 2024. This name describes the larger tested heart, while the smaller heart differs.
Use this guide alongside the written findings and the original report transcript. It explains the purpose of each analytical figure and preserves the laboratory’s own figure labels. The interpretations apply to the tested specimen; signals alone do not establish the identity of every similar-looking stone.
Electron microscope image: This view shows small-scale regions selected for analysis. Its brightness contrast helps distinguish regions with different compositions; it is not a photograph of their natural colors. Numbered spots connect this view to the analyses listed in the report.
Laboratory figure caption: Fig.2: Backscattered electron image of an area of the specimen.
Elemental spectrum: The peaks record characteristic X-ray signals from elements in the analyzed spot or area. This is an analysis of that location, not automatically of the entire specimen. Any mineral identification or uncertainty named in the laboratory caption is retained below.
Laboratory figure caption: Fig. 3: Energy dispersive spectrum of spot 1 in Fig. 2. (copper cobalt carbonate)
Elemental spectrum: The peaks record characteristic X-ray signals from elements in the analyzed spot or area. This is an analysis of that location, not automatically of the entire specimen. Any mineral identification or uncertainty named in the laboratory caption is retained below.
Laboratory figure caption: Fig. 4: Energy dispersive spectrum of spot 2 in Fig. 2. (quartz)
Elemental spectrum: The peaks record characteristic X-ray signals from elements in the analyzed spot or area. This is an analysis of that location, not automatically of the entire specimen. Any mineral identification or uncertainty named in the laboratory caption is retained below.
Laboratory figure caption: Fig. 5: Energy dispersive spectrum of spot 3 in Fig. 2. (cobalt-bearing dolomite)
Electron microscope image: This view shows small-scale regions selected for analysis. Its brightness contrast helps distinguish regions with different compositions; it is not a photograph of their natural colors. Numbered spots connect this view to the analyses listed in the report.
Laboratory figure caption: Fig.6: Backscattered electron image of another area of the specimen.
Elemental spectrum: The peaks record characteristic X-ray signals from elements in the analyzed spot or area. This is an analysis of that location, not automatically of the entire specimen. Any mineral identification or uncertainty named in the laboratory caption is retained below.
Laboratory figure caption: Fig. 7: Energy dispersive spectrum of spot 1 in Fig. 6. (magnesium cobalt carbonate)
Elemental spectrum: The peaks record characteristic X-ray signals from elements in the analyzed spot or area. This is an analysis of that location, not automatically of the entire specimen. Any mineral identification or uncertainty named in the laboratory caption is retained below.
Laboratory figure caption: Fig. 8: Energy dispersive spectrum of spot 3 in Fig. 6. (carrollite)
Electron microscope image: This view shows small-scale regions selected for analysis. Its brightness contrast helps distinguish regions with different compositions; it is not a photograph of their natural colors. Numbered spots connect this view to the analyses listed in the report.
Laboratory figure caption: Fig.9: Backscattered electron image of another area of the specimen.
Elemental spectrum: The peaks record characteristic X-ray signals from elements in the analyzed spot or area. This is an analysis of that location, not automatically of the entire specimen. Any mineral identification or uncertainty named in the laboratory caption is retained below.
Laboratory figure caption: Fig. 10: Energy dispersive spectrum of spot 1 in Fig. 9. (carrollite)
Elemental spectrum: The peaks record characteristic X-ray signals from elements in the analyzed spot or area. This is an analysis of that location, not automatically of the entire specimen. Any mineral identification or uncertainty named in the laboratory caption is retained below.
Laboratory figure caption: Fig. 11: Energy dispersive spectrum of spot 2 in Fig. 9. (cobalt-bearing copper sulfide)
Elemental spectrum: The peaks record characteristic X-ray signals from elements in the analyzed spot or area. This is an analysis of that location, not automatically of the entire specimen. Any mineral identification or uncertainty named in the laboratory caption is retained below.
Laboratory figure caption: Fig. 12: Energy dispersive spectrum of spot 3 in Fig. 9. (cobalt magnesium carbonate)
Read the original laboratory report as text
The following text and tables are transcribed from the original laboratory document. Figure captions identify the report images; the laboratory interpretations and limitations are preserved.
Laboratory report 1
Analytical Result Report
Sample id: 1216 (two hearts)
Submitted by: Soul Body Gems
Date completed: 12-25-2024
Operating conditions: An AMRAY 1830 SEM operated at 25 kV acceleration potential, 24 mm working distance, 0 degrees sample tilt, coated with 250 Å carbon, and also using the attached XRF unit operated at 30 kV.
Fig. 1: Photograph of the specimens. 5 and 3.5 cm maximum dimensions.
Large heart
Fig.2: Backscattered electron image of an area of the specimen.
Fig. 3: Energy dispersive spectrum of spot 1 in Fig. 2. (copper cobalt carbonate)
Fig. 4: Energy dispersive spectrum of spot 2 in Fig. 2. (quartz)
Fig. 5: Energy dispersive spectrum of spot 3 in Fig. 2. (cobalt-bearing dolomite)
Small heart
Fig.6: Backscattered electron image of another area of the specimen.
Fig. 7: Energy dispersive spectrum of spot 1 in Fig. 6. (magnesium cobalt carbonate)
Fig. 8: Energy dispersive spectrum of spot 3 in Fig. 6. (carrollite)
Fig.9: Backscattered electron image of another area of the specimen.
Fig. 10: Energy dispersive spectrum of spot 1 in Fig. 9. (carrollite)
Fig. 11: Energy dispersive spectrum of spot 2 in Fig. 9. (cobalt-bearing copper sulfide)
Fig. 12: Energy dispersive spectrum of spot 3 in Fig. 9. (cobalt magnesium carbonate)
Summary of findings: These specimens (Fig. 1) are fantastic! In the large heart, kolwezite (Figs. 2 and 3) occurs sparingly, it is greenish. It is associated with quartz (Figs. 2 and 4) and cobalt-bearing dolomite (Figs. 2 and 5). This imparts the striking deep pink color. In the small heat, a magnesium cobalt carbonate occurs (Figs. 6 and 7), essentially a cobalt-bearing magnesite. Carrollite, a cobalt copper sulfide, is also present (Figs. 6, 8, 9 and 10). It is associated with a lower cobalt copper sulfide (Figs. 9 and 11) and cobalt-bearing magnesite (Figs. 9 and 12). This material is typical for the Kolwezi area in the DR Congo.
Green Rutile in Sunstone Aka Green Amphibole in Quartz · Soul Body Gems, February 2024.
The green areas in this Tanzanian-sourced sphere are a pyribole, likely amphibole such as hornblende, within quartz. Barium-rich potassium feldspar, albite, iron oxide, apatite, and tiny titanium-oxide grains also occur. The green areas are not rutile, and sunstone was not identified.
Report: Sample 10506, completed February 26, 2024. These findings apply to the specimen analyzed.
Use this guide alongside the written findings and the original report transcript. It explains the purpose of each analytical figure and preserves the laboratory’s own figure labels. The interpretations apply to the tested specimen; signals alone do not establish the identity of every similar-looking stone.
Electron microscope image: This view shows small-scale regions selected for analysis. Its brightness contrast helps distinguish regions with different compositions; it is not a photograph of their natural colors. Numbered spots connect this view to the analyses listed in the report.
Laboratory figure caption: Fig.2: Backscattered electron image of an area of the specimen.
Elemental spectrum: The peaks record characteristic X-ray signals from elements in the analyzed spot or area. This is an analysis of that location, not automatically of the entire specimen. Any mineral identification or uncertainty named in the laboratory caption is retained below.
Laboratory figure caption: Fig. 3: Energy dispersive spectrum of spot 1 in Fig. 2 (quartz)
Elemental spectrum: The peaks record characteristic X-ray signals from elements in the analyzed spot or area. This is an analysis of that location, not automatically of the entire specimen. Any mineral identification or uncertainty named in the laboratory caption is retained below.
Laboratory figure caption: Fig. 4: Energy dispersive spectrum of spot 2 in Fig. 2 (pyribole)
Elemental spectrum: The peaks record characteristic X-ray signals from elements in the analyzed spot or area. This is an analysis of that location, not automatically of the entire specimen. Any mineral identification or uncertainty named in the laboratory caption is retained below.
Laboratory figure caption: Fig. 5: Energy dispersive spectrum of spot 3 in Fig. 2 (potassium feldspar)
Electron microscope image: This view shows small-scale regions selected for analysis. Its brightness contrast helps distinguish regions with different compositions; it is not a photograph of their natural colors. Numbered spots connect this view to the analyses listed in the report.
Laboratory figure caption: Fig. 6: Backscattered electron image of another area of the specimen.
Elemental spectrum: The peaks record characteristic X-ray signals from elements in the analyzed spot or area. This is an analysis of that location, not automatically of the entire specimen. Any mineral identification or uncertainty named in the laboratory caption is retained below.
Laboratory figure caption: Fig. 7: Energy dispersive spectrum of spot 1 in Fig. 6 (magnetite or hematite…)
Elemental spectrum: The peaks record characteristic X-ray signals from elements in the analyzed spot or area. This is an analysis of that location, not automatically of the entire specimen. Any mineral identification or uncertainty named in the laboratory caption is retained below.
Laboratory figure caption: Fig. 8: Energy dispersive spectrum of spot 5 in Fig. 6 (apatite)
Elemental spectrum: The peaks record characteristic X-ray signals from elements in the analyzed spot or area. This is an analysis of that location, not automatically of the entire specimen. Any mineral identification or uncertainty named in the laboratory caption is retained below.
Laboratory figure caption: Fig. 9: Energy dispersive spectrum of spot 6 in Fig. 6 (titanium oxide such as rutile)
Elemental spectrum: The peaks record characteristic X-ray signals from elements in the analyzed spot or area. This is an analysis of that location, not automatically of the entire specimen. Any mineral identification or uncertainty named in the laboratory caption is retained below.
Laboratory figure caption: Fig. 10: Energy dispersive spectrum of spot 7 in Fig. 6 (albite)
Element map: This map shows where the named elements occur within the analyzed area. Its colors represent the laboratory’s selected element channels, rather than the specimen’s visible colors. The caption below preserves any color key or distribution noted by the laboratory.
Laboratory figure caption: Fig. 5: X-ray maps of the area shown in Fig. 6. Left image: Calcium: blue, sodium: yellow, potassium: pink. Right image: iron: green, titanium: orange. Note only a few specks of titanium oxide are present.
Read the original laboratory report as text
The following text and tables are transcribed from the original laboratory document. Figure captions identify the report images; the laboratory interpretations and limitations are preserved.
Laboratory report 1
                                                Analytical Result Report

Sample id: 10506 (recent package #3)
Submitted by: Soul Body Gems
Date completed: 2-26-2024
Operating conditions: An AMRAY 1830 SEM operated at 25 kV acceleration potential, 24 mm working distance, 0
degrees sample tilt, coated with 250 Å carbon, and also using the attached XRF unit operated at 30 kV.

A BRUKER Titan X-ray fluorescence spectrometer was also used and operated for 30 seconds at 50, 25, and 10 kV.


Fig. 1: Photograph of the specimen. Approximately 45 mm maximum dimension.


Fig.2: Backscattered electron image of an area of the specimen.
Fig. 3: Energy dispersive spectrum of spot 1 in Fig. 2 (quartz)


Fig. 4: Energy dispersive spectrum of spot 2 in Fig. 2 (pyribole)
Fig. 5: Energy dispersive spectrum of spot 3 in Fig. 2 (potassium feldspar)


Fig. 6: Backscattered electron image of another area of the specimen.
Fig. 7: Energy dispersive spectrum of spot 1 in Fig. 6 (magnetite or hematite…)


Fig. 8: Energy dispersive spectrum of spot 5 in Fig. 6 (apatite)
Fig. 9: Energy dispersive spectrum of spot 6 in Fig. 6 (titanium oxide such as rutile)


Fig. 10: Energy dispersive spectrum of spot 7 in Fig. 6 (albite)
Fig. 5: X-ray maps of the area shown in Fig. 6. Left image: Calcium: blue, sodium: yellow, potassium: pink. Right image:
iron: green, titanium: orange. Note only a few specks of titanium oxide are present.


Table 1: minor and trace elements in the potassium feldspar. (in wt. %)

 Barium                                                2.80
 Iron                                                   0.16
 Manganese                                            0.04
 Sodium                                                0.32
 Titanium                                               0.01


Summary of findings: This specimen (Fig. 1) very interesting. It is composed of: quartz (Figs. 2 and 3), a pyribole (Figs. 2
and 4), the dark green areas, it is likely an amphibole like hornblende, a potassium feldspar (Figs. 2 and 5), this
potassium feldspar is barium-rich (Table 1), an iron oxide such as magnetite or hematite (Figs. 6 and 7), apatite (Figs. 6
and 8), a titanium oxide (Figs 6 and 9) and albite (Figs. 6 and 9).

The green areas are not rutile even though very small amounts of rutile, or another titanium oxide species are present.


Date:  February 26, 2024            Signature
Green Rutile in Sunstone Aka Green Amphibole in Quartz · Soul Body Gems, February 2024.
This sphere sold as Green Rutile with Sunstone contains green areas that are likely amphibole, not rutile. A few tiny titanium-oxide specks may be rutile or a related species, but they do not make the green areas rutile. The report did not identify sunstone.
Report: Sample 10506, completed February 26, 2024. These findings apply to the specimen analyzed.
Use this guide alongside the written findings and the original report transcript. It explains the purpose of each analytical figure and preserves the laboratory’s own figure labels. The interpretations apply to the tested specimen; signals alone do not establish the identity of every similar-looking stone.
Electron microscope image: This view shows small-scale regions selected for analysis. Its brightness contrast helps distinguish regions with different compositions; it is not a photograph of their natural colors. Numbered spots connect this view to the analyses listed in the report.
Laboratory figure caption: Fig.2: Backscattered electron image of an area of the specimen.
Elemental spectrum: The peaks record characteristic X-ray signals from elements in the analyzed spot or area. This is an analysis of that location, not automatically of the entire specimen. Any mineral identification or uncertainty named in the laboratory caption is retained below.
Laboratory figure caption: Fig. 3: Energy dispersive spectrum of spot 1 in Fig. 2 (quartz)
Elemental spectrum: The peaks record characteristic X-ray signals from elements in the analyzed spot or area. This is an analysis of that location, not automatically of the entire specimen. Any mineral identification or uncertainty named in the laboratory caption is retained below.
Laboratory figure caption: Fig. 4: Energy dispersive spectrum of spot 2 in Fig. 2 (pyribole)
Elemental spectrum: The peaks record characteristic X-ray signals from elements in the analyzed spot or area. This is an analysis of that location, not automatically of the entire specimen. Any mineral identification or uncertainty named in the laboratory caption is retained below.
Laboratory figure caption: Fig. 5: Energy dispersive spectrum of spot 3 in Fig. 2 (potassium feldspar)
Electron microscope image: This view shows small-scale regions selected for analysis. Its brightness contrast helps distinguish regions with different compositions; it is not a photograph of their natural colors. Numbered spots connect this view to the analyses listed in the report.
Laboratory figure caption: Fig. 6: Backscattered electron image of another area of the specimen.
Elemental spectrum: The peaks record characteristic X-ray signals from elements in the analyzed spot or area. This is an analysis of that location, not automatically of the entire specimen. Any mineral identification or uncertainty named in the laboratory caption is retained below.
Laboratory figure caption: Fig. 7: Energy dispersive spectrum of spot 1 in Fig. 6 (magnetite or hematite…)
Elemental spectrum: The peaks record characteristic X-ray signals from elements in the analyzed spot or area. This is an analysis of that location, not automatically of the entire specimen. Any mineral identification or uncertainty named in the laboratory caption is retained below.
Laboratory figure caption: Fig. 8: Energy dispersive spectrum of spot 5 in Fig. 6 (apatite)
Elemental spectrum: The peaks record characteristic X-ray signals from elements in the analyzed spot or area. This is an analysis of that location, not automatically of the entire specimen. Any mineral identification or uncertainty named in the laboratory caption is retained below.
Laboratory figure caption: Fig. 9: Energy dispersive spectrum of spot 6 in Fig. 6 (titanium oxide such as rutile)
Elemental spectrum: The peaks record characteristic X-ray signals from elements in the analyzed spot or area. This is an analysis of that location, not automatically of the entire specimen. Any mineral identification or uncertainty named in the laboratory caption is retained below.
Laboratory figure caption: Fig. 10: Energy dispersive spectrum of spot 7 in Fig. 6 (albite)
Element map: This map shows where the named elements occur within the analyzed area. Its colors represent the laboratory’s selected element channels, rather than the specimen’s visible colors. The caption below preserves any color key or distribution noted by the laboratory.
Laboratory figure caption: Fig. 5: X-ray maps of the area shown in Fig. 6. Left image: Calcium: blue, sodium: yellow, potassium: pink. Right image: iron: green, titanium: orange. Note only a few specks of titanium oxide are present.
Read the original laboratory report as text
The following text and tables are transcribed from the original laboratory document. Figure captions identify the report images; the laboratory interpretations and limitations are preserved.
Laboratory report 1
                                                Analytical Result Report

Sample id: 10506 (recent package #3)
Submitted by: Soul Body Gems
Date completed: 2-26-2024
Operating conditions: An AMRAY 1830 SEM operated at 25 kV acceleration potential, 24 mm working distance, 0
degrees sample tilt, coated with 250 Å carbon, and also using the attached XRF unit operated at 30 kV.

A BRUKER Titan X-ray fluorescence spectrometer was also used and operated for 30 seconds at 50, 25, and 10 kV.


Fig. 1: Photograph of the specimen. Approximately 45 mm maximum dimension.


Fig.2: Backscattered electron image of an area of the specimen.
Fig. 3: Energy dispersive spectrum of spot 1 in Fig. 2 (quartz)


Fig. 4: Energy dispersive spectrum of spot 2 in Fig. 2 (pyribole)
Fig. 5: Energy dispersive spectrum of spot 3 in Fig. 2 (potassium feldspar)


Fig. 6: Backscattered electron image of another area of the specimen.
Fig. 7: Energy dispersive spectrum of spot 1 in Fig. 6 (magnetite or hematite…)


Fig. 8: Energy dispersive spectrum of spot 5 in Fig. 6 (apatite)
Fig. 9: Energy dispersive spectrum of spot 6 in Fig. 6 (titanium oxide such as rutile)


Fig. 10: Energy dispersive spectrum of spot 7 in Fig. 6 (albite)
Fig. 5: X-ray maps of the area shown in Fig. 6. Left image: Calcium: blue, sodium: yellow, potassium: pink. Right image:
iron: green, titanium: orange. Note only a few specks of titanium oxide are present.


Table 1: minor and trace elements in the potassium feldspar. (in wt. %)

 Barium                                                2.80
 Iron                                                   0.16
 Manganese                                            0.04
 Sodium                                                0.32
 Titanium                                               0.01


Summary of findings: This specimen (Fig. 1) very interesting. It is composed of: quartz (Figs. 2 and 3), a pyribole (Figs. 2
and 4), the dark green areas, it is likely an amphibole like hornblende, a potassium feldspar (Figs. 2 and 5), this
potassium feldspar is barium-rich (Table 1), an iron oxide such as magnetite or hematite (Figs. 6 and 7), apatite (Figs. 6
and 8), a titanium oxide (Figs 6 and 9) and albite (Figs. 6 and 9).

The green areas are not rutile even though very small amounts of rutile, or another titanium oxide species are present.


Date:  February 26, 2024            Signature
Olivine (China) spheres · October 2025 collection. The laboratory findings below apply only to sample 1523.
A sphere sourced from China is an ultramafic rock dominated by magnesium-rich, forsterite-dominant olivine with some calcium- and magnesium-rich pyroxene, essentially diopside, also chromium-rich. The locality comes from sourcing information rather than the laboratory analysis.
Report: Sample 1523, completed September 25, 2025. These findings apply to the specimen analyzed.
Use this guide alongside the written findings and the original report transcript. It explains the purpose of each analytical figure and preserves the laboratory’s own figure labels. The interpretations apply to the tested specimen; signals alone do not establish the identity of every similar-looking stone.
Electron microscope image: This view shows small-scale regions selected for analysis. Its brightness contrast helps distinguish regions with different compositions; it is not a photograph of their natural colors. Numbered spots connect this view to the analyses listed in the report.
Laboratory figure caption: Fig.2: Backscattered electron image of an area of the specimen in Fig. 1.
Elemental spectrum: The peaks record characteristic X-ray signals from elements in the analyzed spot or area. This is an analysis of that location, not automatically of the entire specimen. Any mineral identification or uncertainty named in the laboratory caption is retained below.
Laboratory figure caption: Fig. 3: Energy dispersive spectrum of spot 1 in Fig. 2. (olivine)
Elemental spectrum: The peaks record characteristic X-ray signals from elements in the analyzed spot or area. This is an analysis of that location, not automatically of the entire specimen. Any mineral identification or uncertainty named in the laboratory caption is retained below.
Laboratory figure caption: Fig. 4: Energy dispersive spectrum of spot 2 in Fig. 2. (pyroxene)
Read the original laboratory report as text
The following text and tables are transcribed from the original laboratory document. Figure captions identify the report images; the laboratory interpretations and limitations are preserved.
Laboratory report 1
Analytical Result Report
Sample id: 1523 (#7 sphere)
Submitted by: Soul Body Gems
Date completed: 9-25-2025
Operating conditions: An AMRAY 1830 SEM operated at 25 kV acceleration potential, 24 mm working distance, 0 degrees sample tilt, coated with 250 Å carbon, and also using the attached XRF unit operated at 30 kV.
Fig. 1: Photograph of the specimens. 5 cm maximum dimension.
Fig.2: Backscattered electron image of an area of the specimen in Fig. 1.
Fig. 3: Energy dispersive spectrum of spot 1 in Fig. 2. (olivine)
Fig. 4: Energy dispersive spectrum of spot 2 in Fig. 2. (pyroxene)
Summary of findings: This is a very interesting specimen! It is in the ultramafic group of rock types and consists dominantly of olivine (Figs. 2 and 3), the olivine is forsterite-dominant, thus it is magnesium-dominant. Additionally, some pyroxene also occurs in the specimen (Figs.2 and 4), The pyroxene is calcium- and magnesium-rich, essentially a calcium-rich diopside. It also is chromium rich. Material like this occurs for example in ophiolite complexes, it is a depleted mantle rock where basaltic magma has been extracted.
Midnight Rose Fluorite spheres · October 2025 collection. The laboratory findings below apply only to sample 1521.
This sphere sourced from China tested as fluorite. Small compositional differences in yttrium (0.22 wt.% in brighter areas versus 0.13 wt.% in dimmer ones), with corresponding heavy rare earth elements, relate to visible geometric patterns. The locality is supplied sourcing information.
Report: Sample 1521, completed September 24, 2025. These findings apply to the specimen analyzed.
Use this guide alongside the written findings and the original report transcript. It explains the purpose of each analytical figure and preserves the laboratory’s own figure labels. The interpretations apply to the tested specimen; signals alone do not establish the identity of every similar-looking stone.
Electron microscope image: This view shows small-scale regions selected for analysis. Its brightness contrast helps distinguish regions with different compositions; it is not a photograph of their natural colors. Numbered spots connect this view to the analyses listed in the report.
Laboratory figure caption: Fig.2: Backscattered electron image of an area of the specimen in Fig. 1.
Elemental spectrum: The peaks record characteristic X-ray signals from elements in the analyzed spot or area. This is an analysis of that location, not automatically of the entire specimen. Any mineral identification or uncertainty named in the laboratory caption is retained below.
Laboratory figure caption: Fig. 3: Energy dispersive spectrum of spot 1 in Fig. 2. (fluorite)
Elemental spectrum: The peaks record characteristic X-ray signals from elements in the analyzed spot or area. This is an analysis of that location, not automatically of the entire specimen. Any mineral identification or uncertainty named in the laboratory caption is retained below.
Laboratory figure caption: Fig. 4: Energy dispersive spectrum of spot 2 in Fig. 2. (fluorite)
Elemental spectrum: The peaks record characteristic X-ray signals from elements in the analyzed spot or area. This is an analysis of that location, not automatically of the entire specimen. Any mineral identification or uncertainty named in the laboratory caption is retained below.
Laboratory figure caption: Fig. 5: Energy dispersive spectrum of spot 3 in Fig. 2. (fluorite)
Read the original laboratory report as text
The following text and tables are transcribed from the original laboratory document. Figure captions identify the report images; the laboratory interpretations and limitations are preserved.
Laboratory report 1
Analytical Result Report
Sample id: 1521 (#6 sphere)
Submitted by: Soul Body Gems
Date completed: 9-24-2025
Operating conditions: An AMRAY 1830 SEM operated at 25 kV acceleration potential, 24 mm working distance, 0 degrees sample tilt, coated with 250 Å carbon, and also using the attached XRF unit operated at 30 kV.
Fig. 1: Photograph of the specimens. 5 cm maximum dimension.
Fig.2: Backscattered electron image of an area of the specimen in Fig. 1.
Fig. 3: Energy dispersive spectrum of spot 1 in Fig. 2. (fluorite)
Fig. 4: Energy dispersive spectrum of spot 2 in Fig. 2. (fluorite)
Fig. 5: Energy dispersive spectrum of spot 3 in Fig. 2. (fluorite)
Summary of findings: A very interesting specimen! It is fluorite (Figs. 2-3). The geometric shapes visible are caused by a little higher yttrium content: 0.22 wt. % in the brighter areas (Fig. 5) versus 0.13 wt. % in the dimmer ones (Figs. 3 and 4). The heavy rare earth elements ytterbium, lutetium, thulium etc. are showing a similar correspondence in concentration as does yttrium.
Silver Aventurine Hearts · Soul Body Gems, October 2024.
A Tanzanian-sourced sphere sold as Silver Aventurine is chiefly quartz with muscovite inclusions and minor titanium-bearing magnetite. The report did not identify metallic silver; “silver” is a descriptive market label for its appearance. The locality is supplier information rather than an independent laboratory finding.
Report: Sample 10594, completed May 15, 2024. Findings apply to the specimen examined.
Use this guide alongside the written findings and the original report transcript. It explains the purpose of each analytical figure and preserves the laboratory’s own figure labels. The interpretations apply to the tested specimen; signals alone do not establish the identity of every similar-looking stone.
Electron microscope image: This view shows small-scale regions selected for analysis. Its brightness contrast helps distinguish regions with different compositions; it is not a photograph of their natural colors. Numbered spots connect this view to the analyses listed in the report.
Laboratory figure caption: Fig.2: Backscattered electron image of an area of the specimen.
Elemental spectrum: The peaks record characteristic X-ray signals from elements in the analyzed spot or area. This is an analysis of that location, not automatically of the entire specimen. Any mineral identification or uncertainty named in the laboratory caption is retained below.
Laboratory figure caption: Fig. 3: Energy dispersive spectrum of spot 1 in Fig. 2 (quartz)
Elemental spectrum: The peaks record characteristic X-ray signals from elements in the analyzed spot or area. This is an analysis of that location, not automatically of the entire specimen. Any mineral identification or uncertainty named in the laboratory caption is retained below.
Laboratory figure caption: Fig. 4: Energy dispersive spectrum of spot 2 in Fig. 2 (titanium-bearing magnetite)
Elemental spectrum: The peaks record characteristic X-ray signals from elements in the analyzed spot or area. This is an analysis of that location, not automatically of the entire specimen. Any mineral identification or uncertainty named in the laboratory caption is retained below.
Laboratory figure caption: Fig. 5: Energy dispersive spectrum of spot 3 in Fig. 2 (muscovite)
Element map: This map shows where the named elements occur within the analyzed area. Its colors represent the laboratory’s selected element channels, rather than the specimen’s visible colors. The caption below preserves any color key or distribution noted by the laboratory.
Laboratory figure caption: Fig. 6: X-ray maps of the area shown in Fig. 2. Silicon: yellow, potassium: red.
Read the original laboratory report as text
The following text and tables are transcribed from the original laboratory document. Figure captions identify the report images; the laboratory interpretations and limitations are preserved.
Laboratory report 1
Analytical Result Report
Sample id: 10594 (sphere)
Submitted by: Soul Body Gems
Date completed: 5-15-2024
Operating conditions: An AMRAY 1830 SEM operated at 25 kV acceleration potential, 24 mm working distance, 0 degrees sample tilt, coated with 250 Å carbon, and also using the attached XRF unit operated at 30 kV.
Fig. 1: Photograph of the specimen. Approximately 55 mm maximum dimension.
Fig.2: Backscattered electron image of an area of the specimen.
Fig. 3: Energy dispersive spectrum of spot 1 in Fig. 2 (quartz)
Fig. 4: Energy dispersive spectrum of spot 2 in Fig. 2 (titanium-bearing magnetite)
Fig. 5: Energy dispersive spectrum of spot 3 in Fig. 2 (muscovite)
Fig. 6: X-ray maps of the area shown in Fig. 2. Silicon: yellow, potassium: red.
Table 1: Minor and trace elements in the muscovite (in wt. %(.
Laboratory data as recorded in the report
Element
Reported value
Calcium
0.16
Iron
2.04
Magnesium
0.25
Manganese
0.03
Rubidium
0.24
Sodium
1.22
Titanium
0.11
Summary of findings: This specimen (Fig. 1) is essentially a quartz sphere (Figs. 2 and 3) with muscovite inclusions (Figs. 2, 5 and 6) and minor titanium-bearing magnetite. (Figs. 2 and 4). The minor and trace elements (Table 1) are typical for a moderately evolved muscovite, indicated by the rubidium content. The high quartz content of the sphere as seen in Fig. 6 makes it also relatively resistant to damage.
Silver Aventurine Spheres · Soul Body Gems, May 2024.
The tested green material is malachite overgrown by drusy, visibly crystalline quartz on a gossan base. The report found no chromium and no chalcedony. It was sourced as a small 2023 pocket from Congo, but that locality and find history were not established by the analytical test.
Report: Sample 1105, completed November 6, 2024. Findings apply to the specimen examined.
Use this guide alongside the written findings and the original report transcript. It explains the purpose of each analytical figure and preserves the laboratory’s own figure labels. The interpretations apply to the tested specimen; signals alone do not establish the identity of every similar-looking stone.
Electron microscope image: This view shows small-scale regions selected for analysis. Its brightness contrast helps distinguish regions with different compositions; it is not a photograph of their natural colors. Numbered spots connect this view to the analyses listed in the report.
Laboratory figure caption: Fig.2: Backscattered electron image of an area of the specimen.
Elemental spectrum: The peaks record characteristic X-ray signals from elements in the analyzed spot or area. This is an analysis of that location, not automatically of the entire specimen. Any mineral identification or uncertainty named in the laboratory caption is retained below.
Laboratory figure caption: Fig. 3: Energy dispersive spectrum of spot 1 in Fig. 2. (malachite)
Electron microscope image: This view shows small-scale regions selected for analysis. Its brightness contrast helps distinguish regions with different compositions; it is not a photograph of their natural colors. Numbered spots connect this view to the analyses listed in the report.
Laboratory figure caption: Fig.4: Backscattered electron image of another area of the specimen.
Elemental spectrum: The peaks record characteristic X-ray signals from elements in the analyzed spot or area. This is an analysis of that location, not automatically of the entire specimen. Any mineral identification or uncertainty named in the laboratory caption is retained below.
Laboratory figure caption: Fig. 5: Energy dispersive spectrum of spot 3 in Fig. 4. (quartz)
Read the original laboratory report as text
The following text and tables are transcribed from the original laboratory document. Figure captions identify the report images; the laboratory interpretations and limitations are preserved.
Laboratory report 1
Analytical Result Report
Sample id: 1105 (so-called chromian chalcedony)
Submitted by: Soul Body Gems
Date completed: 11-6-2024
Operating conditions: An AMRAY 1830 SEM operated at 25 kV acceleration potential, 24 mm working distance, 0 degrees sample tilt, coated with 250 Å carbon, and also using the attached XRF unit operated at 30 kV.
A Bruker D2 Phaser X-ray diffractometer was also used and operated under 30kV and 10 m
Fig. 1: Photograph of the specimen. Approximately 55 mm maximum dimension.
Fig.2: Backscattered electron image of an area of the specimen.
Fig. 3: Energy dispersive spectrum of spot 1 in Fig. 2. (malachite)
Fig.4: Backscattered electron image of another area of the specimen.
Fig. 5: Energy dispersive spectrum of spot 3 in Fig. 4. (quartz)
Summary of findings: These specimens (Fig. 1) are very pretty. The green material, where exposed, shows that it is the copper mineral malachite (Figs. 2 and 3). It is overgrown with drusy quartz crystals (Figs. 4 and 5). There is no chromium present, the specimens are quartz which grew over malachite which sits on a base of gossan (goethite/limonite, an iron oxy hydroxide which is typical for the oxidized portions of sulfide deposits. If copper is present in the primary ore, it will form malachite and other copper species near the surface.
There is also no chalcedony present, the quartz is present as macroscopically visible crystals.
Agni Magnitite Half Polished · Soul Body Gems, September 2024.
This tested specimen is a high-silica glass with heterogeneous streaks. The laboratory could not determine from this result whether the material formed in volcanic activity or through an impact-related process.
Report: Sample 1214, completed December 24, 2024. Findings apply to the specimen examined.
Use this guide alongside the written findings and the original report transcript. It explains the purpose of each analytical figure and preserves the laboratory’s own figure labels. The interpretations apply to the tested specimen; signals alone do not establish the identity of every similar-looking stone.
Electron microscope image: This view shows small-scale regions selected for analysis. Its brightness contrast helps distinguish regions with different compositions; it is not a photograph of their natural colors. Numbered spots connect this view to the analyses listed in the report.
Laboratory figure caption: Fig.2: Backscattered electron image of an area of the specimen.
Elemental spectrum: The peaks record characteristic X-ray signals from elements in the analyzed spot or area. This is an analysis of that location, not automatically of the entire specimen. Any mineral identification or uncertainty named in the laboratory caption is retained below.
Laboratory figure caption: Fig. 3: Energy dispersive spectrum of spot 1 in Fig. 2. (high silicon glass)
Elemental spectrum: The peaks record characteristic X-ray signals from elements in the analyzed spot or area. This is an analysis of that location, not automatically of the entire specimen. Any mineral identification or uncertainty named in the laboratory caption is retained below.
Laboratory figure caption: Fig. 4: Energy dispersive spectrum of spot 2 in Fig. 2. (higher iron/magnesium heterogeneity)
Read the original laboratory report as text
The following text and tables are transcribed from the original laboratory document. Figure captions identify the report images; the laboratory interpretations and limitations are preserved.
Laboratory report 1
Analytical Result Report
Sample id: 1214 (#12 agni monitite)
Submitted by: Soul Body Gems
Date completed: 12-24-2024
Operating conditions: An AMRAY 1830 SEM operated at 25 kV acceleration potential, 24 mm working distance, 0 degrees sample tilt, coated with 250 Å carbon, and also using the attached XRF unit operated at 30 kV.
Fig. 1: Photograph of the specimens. 3.5 cm maximum dimensions.
Fig.2: Backscattered electron image of an area of the specimen.
Fig. 3: Energy dispersive spectrum of spot 1 in Fig. 2. (high silicon glass)
Fig. 4: Energy dispersive spectrum of spot 2 in Fig. 2. (higher iron/magnesium heterogeneity)
Summary of findings: This specimen (Fig. 1) is very interesting! It is a glassy material with high silicon content (Figs. 2 and 3) with some heterogenous streaks (Figs. 2 and 4). This material is referred to as agni manitite/monitite. It is supposedly formed from volcanic activity and is not related to meteorite impacts, others to link it to tektites which are related to meteorite impact. Since tektites are formed from terrestrial material this is what we have here, it could be volcanic or impact related.
Agni Magnitite Half Polished · Soul Body Gems, September 2024.
A trade name for the tested Agni Manitite material. Analysis identified high-silica glass with heterogeneous streaks, but did not resolve a volcanic versus impact origin.
Report: Sample 1214, completed December 24, 2024. Findings apply to the specimen examined.
Use this guide alongside the written findings and the original report transcript. It explains the purpose of each analytical figure and preserves the laboratory’s own figure labels. The interpretations apply to the tested specimen; signals alone do not establish the identity of every similar-looking stone.
Electron microscope image: This view shows small-scale regions selected for analysis. Its brightness contrast helps distinguish regions with different compositions; it is not a photograph of their natural colors. Numbered spots connect this view to the analyses listed in the report.
Laboratory figure caption: Fig.2: Backscattered electron image of an area of the specimen.
Elemental spectrum: The peaks record characteristic X-ray signals from elements in the analyzed spot or area. This is an analysis of that location, not automatically of the entire specimen. Any mineral identification or uncertainty named in the laboratory caption is retained below.
Laboratory figure caption: Fig. 3: Energy dispersive spectrum of spot 1 in Fig. 2. (high silicon glass)
Elemental spectrum: The peaks record characteristic X-ray signals from elements in the analyzed spot or area. This is an analysis of that location, not automatically of the entire specimen. Any mineral identification or uncertainty named in the laboratory caption is retained below.
Laboratory figure caption: Fig. 4: Energy dispersive spectrum of spot 2 in Fig. 2. (higher iron/magnesium heterogeneity)
Read the original laboratory report as text
The following text and tables are transcribed from the original laboratory document. Figure captions identify the report images; the laboratory interpretations and limitations are preserved.
Laboratory report 1
Analytical Result Report
Sample id: 1214 (#12 agni monitite)
Submitted by: Soul Body Gems
Date completed: 12-24-2024
Operating conditions: An AMRAY 1830 SEM operated at 25 kV acceleration potential, 24 mm working distance, 0 degrees sample tilt, coated with 250 Å carbon, and also using the attached XRF unit operated at 30 kV.
Fig. 1: Photograph of the specimens. 3.5 cm maximum dimensions.
Fig.2: Backscattered electron image of an area of the specimen.
Fig. 3: Energy dispersive spectrum of spot 1 in Fig. 2. (high silicon glass)
Fig. 4: Energy dispersive spectrum of spot 2 in Fig. 2. (higher iron/magnesium heterogeneity)
Summary of findings: This specimen (Fig. 1) is very interesting! It is a glassy material with high silicon content (Figs. 2 and 3) with some heterogenous streaks (Figs. 2 and 4). This material is referred to as agni manitite/monitite. It is supposedly formed from volcanic activity and is not related to meteorite impacts, others to link it to tektites which are related to meteorite impact. Since tektites are formed from terrestrial material this is what we have here, it could be volcanic or impact related.
Two Swedish specimens contain quartz and a member of the gedrite–ferrogedrite amphibole series. The left resembles garbenschiefer with radiating amphibole sprays; the right has amphibole dispersed through quartz. X-ray diffraction supports gedrite.
Report: Sample 1219, completed March 1, 2025. Findings apply to the specimen examined.
Use this guide alongside the written findings and the original report transcript. It explains the purpose of each analytical figure and preserves the laboratory’s own figure labels. The interpretations apply to the tested specimen; signals alone do not establish the identity of every similar-looking stone.
Electron microscope image: This view shows small-scale regions selected for analysis. Its brightness contrast helps distinguish regions with different compositions; it is not a photograph of their natural colors. Numbered spots connect this view to the analyses listed in the report.
Laboratory figure caption: Fig.2: Backscattered electron image of an area of the left specimen in Fig. 1.
Elemental spectrum: The peaks record characteristic X-ray signals from elements in the analyzed spot or area. This is an analysis of that location, not automatically of the entire specimen. Any mineral identification or uncertainty named in the laboratory caption is retained below.
Laboratory figure caption: Fig. 3: Energy dispersive spectrum of spot 1 in Fig. 2. (quartz)
Elemental spectrum: The peaks record characteristic X-ray signals from elements in the analyzed spot or area. This is an analysis of that location, not automatically of the entire specimen. Any mineral identification or uncertainty named in the laboratory caption is retained below.
Laboratory figure caption: Fig. 4: Energy dispersive spectrum of spot 2 in Fig. 2 (gedrite/ferrogedrite).
Electron microscope image: This view shows small-scale regions selected for analysis. Its brightness contrast helps distinguish regions with different compositions; it is not a photograph of their natural colors. Numbered spots connect this view to the analyses listed in the report.
Laboratory figure caption: Fig.5: Backscattered electron image of an area of the right specimen in Fig. 1.
Elemental spectrum: The peaks record characteristic X-ray signals from elements in the analyzed spot or area. This is an analysis of that location, not automatically of the entire specimen. Any mineral identification or uncertainty named in the laboratory caption is retained below.
Laboratory figure caption: Fig. 6: Energy dispersive spectrum of spot 1 in Fig. 6 (gedrite/ferrogedrite).
Elemental spectrum: The peaks record characteristic X-ray signals from elements in the analyzed spot or area. This is an analysis of that location, not automatically of the entire specimen. Any mineral identification or uncertainty named in the laboratory caption is retained below.
Laboratory figure caption: Fig. 7: Energy dispersive spectrum of spot 2 in Fig. 6 (quartz).
Diffraction scan: This scan helps identify crystalline minerals by comparing the measured pattern with reference patterns. The laboratory interpretation explains which minerals the comparison supports.
Laboratory figure caption: Fig. 8: X-ray diffraction scan of the material, with matches for quartz and gedrite.
Read the original laboratory report as text
The following text and tables are transcribed from the original laboratory document. Figure captions identify the report images; the laboratory interpretations and limitations are preserved.
Laboratory report 1
Analytical Result Report
Sample id: 1219 (#1 gedrite from Sweden )
Submitted by: Soul Body Gems
Date completed: 3-1-2025
Operating conditions: An AMRAY 1830 SEM operated at 25 kV acceleration potential, 24 mm working distance, 0 degrees sample tilt, coated with 250 Å carbon, and also using the attached XRF unit operated at 30 kV.
A Bruker D2 Phase X-ray diffractometer was also used in the study and operated at 30 kV and 10 mA.
Fig. 1: Photograph of the specimens. 7 cm maximum dimension.
Fig.2: Backscattered electron image of an area of the left specimen in Fig. 1.
Fig. 3: Energy dispersive spectrum of spot 1 in Fig. 2. (quartz)
Fig. 4: Energy dispersive spectrum of spot 2 in Fig. 2 (gedrite/ferrogedrite).
Fig.5: Backscattered electron image of an area of the right specimen in Fig. 1.
.
Fig. 6: Energy dispersive spectrum of spot 1 in Fig. 6 (gedrite/ferrogedrite).
Fig. 7: Energy dispersive spectrum of spot 2 in Fig. 6 (quartz).
Fig. 8: X-ray diffraction scan of the material, with matches for quartz and gedrite.
Summary of findings: These specimens (Fig. 1) are very nice. The left one is a typical ‘garbenschiefer’, a schist with sprays oof diverging amphiboles, the right one looks more like the amphibole is dispersed through the quartz.
Both species contain quartz (Figs. 2, 4, 5 and 7) and an amphibole which is a member of the gedrite/ferrogedrite series (Figs. 2, 3,5 and 6). Gedrite is also confirmed by X-ray diffraction (Fig. 8).
Orange Dogtooth Calcite (China) · Soul Body Gems, February 2024.
Orange Dogtooth Calcite (China) from our collection, with scalenohedral crystals and visible internal growth phantoms. Soul Body Gems records the supplied locality as Li Gian Mine, Wenshan, Yunnan, China.
The collection locality is supplied provenance, rather than a locality established by the laboratory. Analysis identified calcite and low trace-element contents, with locally stronger iron-bearing surface staining. The dogtooth form describes crystal habit. The crystals’ translucency and growth zoning reveal aspects of their geology; condition and mine-production claims should be assessed piece by piece.
Report: Sample 10484, completed January 27, 2024. Findings apply to the specimen examined.
Use this guide alongside the written findings and the original report transcript. It explains the purpose of each analytical figure and preserves the laboratory’s own figure labels. The interpretations apply to the tested specimen; signals alone do not establish the identity of every similar-looking stone.
Electron microscope image: This view shows small-scale regions selected for analysis. Its brightness contrast helps distinguish regions with different compositions; it is not a photograph of their natural colors. Numbered spots connect this view to the analyses listed in the report.
Laboratory figure caption: Fig.2: Backscattered electron image of an area of the specimen.
Elemental spectrum: The peaks record characteristic X-ray signals from elements in the analyzed spot or area. This is an analysis of that location, not automatically of the entire specimen. Any mineral identification or uncertainty named in the laboratory caption is retained below.
Laboratory figure caption: Fig. 3: Energy dispersive spectrum of spot 1 in Fig. 2 (calcite)
Read the original laboratory report as text
The following text and tables are transcribed from the original laboratory document. Figure captions identify the report images; the laboratory interpretations and limitations are preserved.
Laboratory report 1
Analytical Result Report
Sample id: 10484 calcite crystals)
Submitted by: Soul Body Gems
Date completed: 1-27-2024
Operating conditions: An AMRAY 1830 SEM operated at 25 kV acceleration potential, 24 mm working distance, 0 degrees sample tilt, coated with 250 Å carbon, and also using the attached XRF unit operated at 30 kV.
A BRUKER Titan X-ray fluorescence spectrometer was also used and operated for 30 seconds at 50, 25, and 10 kV.
Fig. 1: Photograph of the specimen. Approximately 5 mm maximum dimension of the beads.
Fig.2: Backscattered electron image of an area of the specimen.
Fig. 3: Energy dispersive spectrum of spot 1 in Fig. 2 (calcite)
Table 1: minor and trace elements in the calcite. (in wt. %)
Laboratory data as recorded in the report
Element
Reported value
Iron
0.06
Magnesium
0.26
Manganese
0.02
Zinc
0.04
Summary of findings: This specimen (Fig. 1) is very interesting! It is calcite (Figs. 2 and 3). The tare element content is low (Table 1) but surface staining does bring up to iron content to 0.7 wt. %.
Date: January 27. 2024 Signature
A South African-sourced oval contains copper silicates with a reasonable X-ray diffraction match to both shattuckite and plancheite, plus quartz and minor barite. The report does not isolate shattuckite as the only blue mineral. South Africa is supplied locality information.
Report: Sample 1074, completed September 26, 2024. Findings apply to the specimen examined.
Use this guide alongside the written findings and the original report transcript. It explains the purpose of each analytical figure and preserves the laboratory’s own figure labels. The interpretations apply to the tested specimen; signals alone do not establish the identity of every similar-looking stone.
Electron microscope image: This view shows small-scale regions selected for analysis. Its brightness contrast helps distinguish regions with different compositions; it is not a photograph of their natural colors. Numbered spots connect this view to the analyses listed in the report.
Laboratory figure caption: Fig.2: Backscattered electron image of an area of the specimen.
Elemental spectrum: The peaks record characteristic X-ray signals from elements in the analyzed spot or area. This is an analysis of that location, not automatically of the entire specimen. Any mineral identification or uncertainty named in the laboratory caption is retained below.
Laboratory figure caption: Fig. 3: Energy dispersive spectrum of spot 1 in Fig. 2. (a copper silicate)
Elemental spectrum: The peaks record characteristic X-ray signals from elements in the analyzed spot or area. This is an analysis of that location, not automatically of the entire specimen. Any mineral identification or uncertainty named in the laboratory caption is retained below.
Laboratory figure caption: Fig. 4: Energy dispersive spectrum of spot 2 in Fig. 2 (barite)
Diffraction scan: This scan helps identify crystalline minerals by comparing the measured pattern with reference patterns. The laboratory interpretation explains which minerals the comparison supports.
Laboratory figure caption: Fig. 5: X-ray diffraction scan of the blue parts in the specimen. Note abundant quartz and weak lines for the copper silicates.
Diffraction scan: This scan helps identify crystalline minerals by comparing the measured pattern with reference patterns. The laboratory interpretation explains which minerals the comparison supports.
Laboratory figure caption: Fig. 6: X-ray diffraction scan of the blue parts in the specimen. Handpicked choosing softer particles preferentially.
Read the original laboratory report as text
The following text and tables are transcribed from the original laboratory document. Figure captions identify the report images; the laboratory interpretations and limitations are preserved.
Laboratory report 1
Analytical Result Report
Sample id: 1074 (#4, shattuckite oval)
Submitted by: Soul Body Gems
Date completed: 9-26-2024
Operating conditions: An AMRAY 1830 SEM operated at 25 kV acceleration potential, 24 mm working distance, 0 degrees sample tilt, coated with 250 Å carbon, and also using the attached XRF unit operated at 30 kV.
A Bruker D2 Phaser X-ray diffractometer was also used in the study and operated at 30 kV and 10 mA.
Fig. 1: Photograph of the specimen. Approximately 40 mm maximum dimension.
Fig.2: Backscattered electron image of an area of the specimen.
Fig. 3: Energy dispersive spectrum of spot 1 in Fig. 2. (a copper silicate)
Fig. 4: Energy dispersive spectrum of spot 2 in Fig. 2 (barite)
Fig. 5: X-ray diffraction scan of the blue parts in the specimen. Note abundant quartz and weak lines for the copper silicates.
Fig. 6: X-ray diffraction scan of the blue parts in the specimen. Handpicked choosing softer particles preferentially.
Summary of findings: This specimen (Fig. 1) is very pretty. It yields a spectrum of a copper silicate (Figs. 2 and 3) with minor barite (Figs. 2 and 4). The X-ray scan shows some low intensity peaks that could be interpreted as shattuckite or plancheite but some more work is needed. The quartz may not be all that abundant, but it is well crystallized and does interfere with the weaker copper silicate diffraction peaks. A second X-ray scan (Fig. 6) was performed on fragments that were hand-picked and preference was given to crumblier pieces. As is clearly seen, even in those pieces quartz was admixed but now a reasonable match for both shattuckite and plancheite could be made.
Shattuckite Stretch Bracelets · Soul Body Gems, April 2024.
Blue beads offered as smithsonite were submitted for analysis.
Finding: Sample 10470, completed January 16, 2024, is made predominantly of interlocking quartz grains. Carbon-rich areas are consistent with resin or epoxy, and the blue color appears to come from organic dye. No zinc was detected, so this tested material is not smithsonite.
Resin or epoxy may have filled voids and helped carry the color. The report applies to these submitted beads, not to every blue quartz or smithsonite offered elsewhere. See the Smithsonite (Fake) entry.
View the original report
Select a page to enlarge it. 3 pages; the findings are summarized in accessible text above.
Use this guide alongside the written findings and the original report transcript. It explains the purpose of each analytical figure and preserves the laboratory’s own figure labels. The interpretations apply to the tested specimen; signals alone do not establish the identity of every similar-looking stone.
Electron microscope image: This view shows small-scale regions selected for analysis. Its brightness contrast helps distinguish regions with different compositions; it is not a photograph of their natural colors. Numbered spots connect this view to the analyses listed in the report.
Laboratory figure caption: Fig.2: Backscattered electron image of an area of the specimen.
Elemental spectrum: The peaks record characteristic X-ray signals from elements in the analyzed spot or area. This is an analysis of that location, not automatically of the entire specimen. Any mineral identification or uncertainty named in the laboratory caption is retained below.
Laboratory figure caption: Fig. 3: Energy dispersive spectrum of spot 1 in Fig. 2 (quartz)
Elemental spectrum: The peaks record characteristic X-ray signals from elements in the analyzed spot or area. This is an analysis of that location, not automatically of the entire specimen. Any mineral identification or uncertainty named in the laboratory caption is retained below.
Laboratory figure caption: Fig. 4: Energy dispersive spectrum of spot 2 in Fig. 2 (carbon-rich materail, such as resin or epoxy, some beam penetration to the quartz)
Element map: This map shows where the named elements occur within the analyzed area. Its colors represent the laboratory’s selected element channels, rather than the specimen’s visible colors. The caption below preserves any color key or distribution noted by the laboratory.
Laboratory figure caption: Fig. 5: X-ray map of the area shown in Fig. 2. Carbon: red, silicon: blue.
Read the original laboratory report as text
The following text and tables are transcribed from the original laboratory document. Figure captions identify the report images; the laboratory interpretations and limitations are preserved.
Laboratory report 1
Analytical Result Report
Sample id: 10470 (#12)
Submitted by: Soul Body Gems
Date completed: 1-16-2024
Operating conditions: An AMRAY 1830 SEM operated at 25 kV acceleration potential, 24 mm working distance, 0 degrees sample tilt, coated with 250 Å carbon, and also using the attached XRF unit operated at 30 kV.
A BRUKER Titan X-ray fluorescence spectrometer was also used and operated for 30 seconds at 50, 25, and 10 kV.
Fig. 1: Photograph of the specimen. Approximately 7 mm across the beads.With one close-up photograph showing interlocking grains. Bright halo is a reflection form the light source
Fig.2: Backscattered electron image of an area of the specimen.
Fig. 3: Energy dispersive spectrum of spot 1 in Fig. 2 (quartz)
Fig. 4: Energy dispersive spectrum of spot 2 in Fig. 2 (carbon-rich materail, such as resin or epoxy, some beam penetration to the quartz)
Table 1: Trace and minor elements in the bulk material.
Laboratory data as recorded in the report
Element, in wt. %
Aluminum
1.2
Chlorine
0.3
Iron
0.2
Sodium
0.2
Sulfur
1.6
Fig. 5: X-ray map of the area shown in Fig. 2. Carbon: red, silicon: blue.
Summary of findings: This specimen (Fig. 1) is pretty. The beads are made up dominantly of interlocking quartz grains (Figs. 2 and 3). There are a lot of carbon-rich areas, resin or epoxy (Figs. 2, 5 and 5). Fig 4. Shows a strong carbon peak, some silicon is detected from beam scatter and penetration. There are no detectable amounts of zinc, thus the beads are NOT smithsonite. The blue color appears to be caused by organic compounds, not any copper compounds or other inorganic blue ions. The material is dyed. Resin or epoxy may also have been used to filled voids and then impart color.
Date: January 16. 2024 Signature
A blue bead material marketed as smithsonite was tested to check that identification.
Finding: The submitted sample 10470, completed January 16, 2024, contained interlocking quartz grains and carbon-rich areas consistent with resin or epoxy. Zinc was not detected. The laboratory concluded that these beads are not smithsonite and that their blue color appears to be an organic dye.
This is a finding about the tested beads. Genuine smithsonite exists; its name should not be applied to this sample. See Blue Quartz (Dyed) for the same report under its identified material.
View the original report
Select a page to enlarge it. 3 pages; the findings are summarized in accessible text above.
Use this guide alongside the written findings and the original report transcript. It explains the purpose of each analytical figure and preserves the laboratory’s own figure labels. The interpretations apply to the tested specimen; signals alone do not establish the identity of every similar-looking stone.
Electron microscope image: This view shows small-scale regions selected for analysis. Its brightness contrast helps distinguish regions with different compositions; it is not a photograph of their natural colors. Numbered spots connect this view to the analyses listed in the report.
Laboratory figure caption: Fig.2: Backscattered electron image of an area of the specimen.
Elemental spectrum: The peaks record characteristic X-ray signals from elements in the analyzed spot or area. This is an analysis of that location, not automatically of the entire specimen. Any mineral identification or uncertainty named in the laboratory caption is retained below.
Laboratory figure caption: Fig. 3: Energy dispersive spectrum of spot 1 in Fig. 2 (quartz)
Elemental spectrum: The peaks record characteristic X-ray signals from elements in the analyzed spot or area. This is an analysis of that location, not automatically of the entire specimen. Any mineral identification or uncertainty named in the laboratory caption is retained below.
Laboratory figure caption: Fig. 4: Energy dispersive spectrum of spot 2 in Fig. 2 (carbon-rich materail, such as resin or epoxy, some beam penetration to the quartz)
Element map: This map shows where the named elements occur within the analyzed area. Its colors represent the laboratory’s selected element channels, rather than the specimen’s visible colors. The caption below preserves any color key or distribution noted by the laboratory.
Laboratory figure caption: Fig. 5: X-ray map of the area shown in Fig. 2. Carbon: red, silicon: blue.
Read the original laboratory report as text
The following text and tables are transcribed from the original laboratory document. Figure captions identify the report images; the laboratory interpretations and limitations are preserved.
Laboratory report 1
Analytical Result Report
Sample id: 10470 (#12)
Submitted by: Soul Body Gems
Date completed: 1-16-2024
Operating conditions: An AMRAY 1830 SEM operated at 25 kV acceleration potential, 24 mm working distance, 0 degrees sample tilt, coated with 250 Å carbon, and also using the attached XRF unit operated at 30 kV.
A BRUKER Titan X-ray fluorescence spectrometer was also used and operated for 30 seconds at 50, 25, and 10 kV.
Fig. 1: Photograph of the specimen. Approximately 7 mm across the beads.With one close-up photograph showing interlocking grains. Bright halo is a reflection form the light source
Fig.2: Backscattered electron image of an area of the specimen.
Fig. 3: Energy dispersive spectrum of spot 1 in Fig. 2 (quartz)
Fig. 4: Energy dispersive spectrum of spot 2 in Fig. 2 (carbon-rich materail, such as resin or epoxy, some beam penetration to the quartz)
Table 1: Trace and minor elements in the bulk material.
Laboratory data as recorded in the report
Element, in wt. %
Aluminum
1.2
Chlorine
0.3
Iron
0.2
Sodium
0.2
Sulfur
1.6
Fig. 5: X-ray map of the area shown in Fig. 2. Carbon: red, silicon: blue.
Summary of findings: This specimen (Fig. 1) is pretty. The beads are made up dominantly of interlocking quartz grains (Figs. 2 and 3). There are a lot of carbon-rich areas, resin or epoxy (Figs. 2, 5 and 5). Fig 4. Shows a strong carbon peak, some silicon is detected from beam scatter and penetration. There are no detectable amounts of zinc, thus the beads are NOT smithsonite. The blue color appears to be caused by organic compounds, not any copper compounds or other inorganic blue ions. The material is dyed. Resin or epoxy may also have been used to filled voids and then impart color.
A polished specimen submitted as purpurite proved to be a complex phosphate assemblage.
Finding: Sample 1213, completed December 24, 2024, contains material in the heterosite–purpurite series. The laboratory also observed a lighter iron phosphate, possibly phosphosiderite or strengite; a calcium–manganese–iron phosphate for which fairfieldite is a candidate; and possible remaining triphylite–lithiophilite-series material. Corundum polishing material was found in a fracture.
The original “purpurite” label is reasonable for part of this specimen, but it does not describe every component. Candidate identifications in the report remain tentative.
View the original report
Select a page to enlarge it. 4 pages; the findings are summarized in accessible text above.
Use this guide alongside the written findings and the original report transcript. It explains the purpose of each analytical figure and preserves the laboratory’s own figure labels. The interpretations apply to the tested specimen; signals alone do not establish the identity of every similar-looking stone.
Electron microscope image: This view shows small-scale regions selected for analysis. Its brightness contrast helps distinguish regions with different compositions; it is not a photograph of their natural colors. Numbered spots connect this view to the analyses listed in the report.
Laboratory figure caption: Fig.2: Backscattered electron image of an area of the specimen.
Elemental spectrum: The peaks record characteristic X-ray signals from elements in the analyzed spot or area. This is an analysis of that location, not automatically of the entire specimen. Any mineral identification or uncertainty named in the laboratory caption is retained below.
Laboratory figure caption: Fig. 3: Energy dispersive spectrum of spot 1 in Fig. 2. (iron manganese phosphate)
Elemental spectrum: The peaks record characteristic X-ray signals from elements in the analyzed spot or area. This is an analysis of that location, not automatically of the entire specimen. Any mineral identification or uncertainty named in the laboratory caption is retained below.
Laboratory figure caption: Fig. 4: Energy dispersive spectrum of spot 2 in Fig. 2. (iron phosphate)
Elemental spectrum: The peaks record characteristic X-ray signals from elements in the analyzed spot or area. This is an analysis of that location, not automatically of the entire specimen. Any mineral identification or uncertainty named in the laboratory caption is retained below.
Laboratory figure caption: Fig. 5: Energy dispersive spectrum of spot 4 in Fig. 2. (aluminum oxide, likely polishing material)
Elemental spectrum: The peaks record characteristic X-ray signals from elements in the analyzed spot or area. This is an analysis of that location, not automatically of the entire specimen. Any mineral identification or uncertainty named in the laboratory caption is retained below.
Laboratory figure caption: Fig. 6: Energy dispersive spectrum of spot 7 in Fig. 2. (calcium manganese iron phosphate)
Elemental spectrum: The peaks record characteristic X-ray signals from elements in the analyzed spot or area. This is an analysis of that location, not automatically of the entire specimen. Any mineral identification or uncertainty named in the laboratory caption is retained below.
Laboratory figure caption: Fig. 7: Energy dispersive spectrum of spot 8 in Fig. 2. (iron manganese phosphate)
Read the original laboratory report as text
The following text and tables are transcribed from the original laboratory document. Figure captions identify the report images; the laboratory interpretations and limitations are preserved.
Laboratory report 1
Analytical Result Report
Sample id: 1213 (#11 purpurite)
Submitted by: Soul Body Gems
Date completed: 12-24-2024
Operating conditions: An AMRAY 1830 SEM operated at 25 kV acceleration potential, 24 mm working distance, 0 degrees sample tilt, coated with 250 Å carbon, and also using the attached XRF unit operated at 30 kV.
Fig. 1: Photograph of the specimens. 7 cm maximum dimensions.
Fig.2: Backscattered electron image of an area of the specimen.
Fig. 3: Energy dispersive spectrum of spot 1 in Fig. 2. (iron manganese phosphate)
Fig. 4: Energy dispersive spectrum of spot 2 in Fig. 2. (iron phosphate)
Fig. 5: Energy dispersive spectrum of spot 4 in Fig. 2. (aluminum oxide, likely polishing material)
Fig. 6: Energy dispersive spectrum of spot 7 in Fig. 2. (calcium manganese iron phosphate)
Fig. 7: Energy dispersive spectrum of spot 8 in Fig. 2. (iron manganese phosphate)
Summary of findings: This specimen (Fig. 1) is very interesting! It is indeed a phosphate, actually several phosphate species. Some of it in the series heterosite-purpurite (Figs. 2 and 3), then there is an oxidized species lighter color and essentially just an iron phosphate this is likely either phosphosiderite or strengite. (Figs. 2 and 4). Fracture fill is made by corundum polishing agent (Figs. 2 and 5). Another lighter colored material is a calcium manganese iron phosphate, fairfieldite is a good candidate for this (Figs. 2 and 6). It appears here is some unaltered material which appears yellowish-brown this could be the primary phosphate series triphylite-lithiophilite (Figs. 2 and 7). Considering the complexity of this material, the original call as purpurite is not a bad one, at least some of the mineral is present.
Chocolate Hematite Calcite · Soul Body Gems, December 2023.
A specimen from Tonglushan Mine, China, also sold as Sunset Calcite and Chocolate Hematite.
Finding: Sample 10472, completed January 17, 2024, is predominantly calcite. After the first calcite crystals formed, powdery hematite coated them; a later growth of calcite followed.
The dark coating explains the market name, but the bulk of this tested specimen is calcite. See Chocolate Hematite for the same report under its alternate name.
Locality: Tonglushan Mine, China, according to Soul Body Gems provenance. The analytical report identifies the minerals in the submitted specimen; it does not independently verify geographic origin.
See Sunset Calcite for this same tested specimen under its other market name.
View the original report
Select a page to enlarge it. 3 pages; the findings are summarized in accessible text above.
Use this guide alongside the written findings and the original report transcript. It explains the purpose of each analytical figure and preserves the laboratory’s own figure labels. The interpretations apply to the tested specimen; signals alone do not establish the identity of every similar-looking stone.
Electron microscope image: This view shows small-scale regions selected for analysis. Its brightness contrast helps distinguish regions with different compositions; it is not a photograph of their natural colors. Numbered spots connect this view to the analyses listed in the report.
Laboratory figure caption: Fig.2: Backscattered electron image of an area of the specimen.
Elemental spectrum: The peaks record characteristic X-ray signals from elements in the analyzed spot or area. This is an analysis of that location, not automatically of the entire specimen. Any mineral identification or uncertainty named in the laboratory caption is retained below.
Laboratory figure caption: Fig. 3: Energy dispersive spectrum of spot 1 in Fig. 2 (calcite)
Elemental spectrum: The peaks record characteristic X-ray signals from elements in the analyzed spot or area. This is an analysis of that location, not automatically of the entire specimen. Any mineral identification or uncertainty named in the laboratory caption is retained below.
Laboratory figure caption: Fig. 4: Energy dispersive spectrum of spot 1 in Fig. 4 (hematite coating on calcite)
Read the original laboratory report as text
The following text and tables are transcribed from the original laboratory document. Figure captions identify the report images; the laboratory interpretations and limitations are preserved.
Laboratory report 1
Analytical Result Report
Sample id: 10472 (#11)
Submitted by: Soul Body Gems
Date completed: 1-16-2024
Operating conditions: An AMRAY 1830 SEM operated at 25 kV acceleration potential, 24 mm working distance, 0 degrees sample tilt, coated with 250 Å carbon, and also using the attached XRF unit operated at 30 kV.
A BRUKER Titan X-ray fluorescence spectrometer was also used and operated for 30 seconds at 50, 25, and 10 kV.
Fig. 1: Photograph of the specimen. Approximately 6 cm maximum dimension.
Fig.2: Backscattered electron image of an area of the specimen.
Fig. 3: Energy dispersive spectrum of spot 1 in Fig. 2 (calcite)
Fig. 4: Energy dispersive spectrum of spot 1 in Fig. 4 (hematite coating on calcite)
Table 1: minor and trace elements in the calcite.
Laboratory data as recorded in the report
Element
Reported value
Iron
0.4
Magnesium
0.1
Manganese
0.02
Strontium
0.01
Summary of findings: This specimen (Fig. 1) shows a multi-step crystallization. The bulk of the specimen is calcite (Figs. 2 and 3). After the formation of calcite, a coating of powdery hematite was deposited (Figs. 2 and 4), this was followed by a second growth of calcite as seen in Figs 1 and 2. Table 1 shows that the calcite is low in trace and minor elements, some of the hematite may be due to hematite inclusions in the area analyzed.
Chocolate Hematite Calcite · Soul Body Gems, December 2023.
An alternate market name for the Tonglushan Mine calcite specimen with a hematite coating.
Finding: Sample 10472, completed January 17, 2024, consists mostly of calcite. Powdery hematite deposited on an earlier calcite growth, followed by a second growth of calcite.
“Chocolate Hematite” highlights the coating but can imply the entire specimen is hematite. See Chocolate Calcite for the same specimen under its primary mineral.
Locality: Tonglushan Mine, China, according to Soul Body Gems provenance. The analytical report identifies the minerals in the submitted specimen; it does not independently verify geographic origin.
See Sunset Calcite for this same tested specimen under another market name.
View the original report
Select a page to enlarge it. 3 pages; the findings are summarized in accessible text above.
Use this guide alongside the written findings and the original report transcript. It explains the purpose of each analytical figure and preserves the laboratory’s own figure labels. The interpretations apply to the tested specimen; signals alone do not establish the identity of every similar-looking stone.
Electron microscope image: This view shows small-scale regions selected for analysis. Its brightness contrast helps distinguish regions with different compositions; it is not a photograph of their natural colors. Numbered spots connect this view to the analyses listed in the report.
Laboratory figure caption: Fig.2: Backscattered electron image of an area of the specimen.
Elemental spectrum: The peaks record characteristic X-ray signals from elements in the analyzed spot or area. This is an analysis of that location, not automatically of the entire specimen. Any mineral identification or uncertainty named in the laboratory caption is retained below.
Laboratory figure caption: Fig. 3: Energy dispersive spectrum of spot 1 in Fig. 2 (calcite)
Elemental spectrum: The peaks record characteristic X-ray signals from elements in the analyzed spot or area. This is an analysis of that location, not automatically of the entire specimen. Any mineral identification or uncertainty named in the laboratory caption is retained below.
Laboratory figure caption: Fig. 4: Energy dispersive spectrum of spot 1 in Fig. 4 (hematite coating on calcite)
Read the original laboratory report as text
The following text and tables are transcribed from the original laboratory document. Figure captions identify the report images; the laboratory interpretations and limitations are preserved.
Laboratory report 1
Analytical Result Report
Sample id: 10472 (#11)
Submitted by: Soul Body Gems
Date completed: 1-16-2024
Operating conditions: An AMRAY 1830 SEM operated at 25 kV acceleration potential, 24 mm working distance, 0 degrees sample tilt, coated with 250 Å carbon, and also using the attached XRF unit operated at 30 kV.
A BRUKER Titan X-ray fluorescence spectrometer was also used and operated for 30 seconds at 50, 25, and 10 kV.
Fig. 1: Photograph of the specimen. Approximately 6 cm maximum dimension.
Fig.2: Backscattered electron image of an area of the specimen.
Fig. 3: Energy dispersive spectrum of spot 1 in Fig. 2 (calcite)
Fig. 4: Energy dispersive spectrum of spot 1 in Fig. 4 (hematite coating on calcite)
Table 1: minor and trace elements in the calcite.
Laboratory data as recorded in the report
Element
Reported value
Iron
0.4
Magnesium
0.1
Manganese
0.02
Strontium
0.01
Summary of findings: This specimen (Fig. 1) shows a multi-step crystallization. The bulk of the specimen is calcite (Figs. 2 and 3). After the formation of calcite, a coating of powdery hematite was deposited (Figs. 2 and 4), this was followed by a second growth of calcite as seen in Figs 1 and 2. Table 1 shows that the calcite is low in trace and minor elements, some of the hematite may be due to hematite inclusions in the area analyzed.
Date: January 17. 2024 Signature
Two Soul Body Gems specimens were tested: a raw specimen and a pendant cabochon. Both reports are collected here, with each specimen’s findings shown separately.
Raw specimen — sample 10471
Finding: Sample 10471, completed January 16, 2024, has blue crystals whose measured composition is consistent with afghanite. Pyrite and diopside were also identified in the examined specimen.
View the original report
Select a page to enlarge it. 4 pages; the findings are summarized in accessible text above.
What the report found: Sample 1122 contains both afghanite and lazurite, with associated diopside and phlogopite. X-ray diffraction confirmed afghanite. The mounting tested as sterling silver.
This identification applies to this cabochon; the two blue phases cannot reliably be distinguished by appearance alone.
View the original report
Select a page to enlarge it. 6 pages; findings are summarized in accessible text above.
Use this guide alongside the written findings and the original report transcript. It explains the purpose of each analytical figure and preserves the laboratory’s own figure labels. The interpretations apply to the tested specimen; signals alone do not establish the identity of every similar-looking stone.
Electron microscope image: This view shows small-scale regions selected for analysis. Its brightness contrast helps distinguish regions with different compositions; it is not a photograph of their natural colors. Numbered spots connect this view to the analyses listed in the report.
Laboratory figure caption: Fig.2: Backscattered electron image of an area of the specimen.
Elemental spectrum: The peaks record characteristic X-ray signals from elements in the analyzed spot or area. This is an analysis of that location, not automatically of the entire specimen. Any mineral identification or uncertainty named in the laboratory caption is retained below.
Laboratory figure caption: Fig. 3: Energy dispersive spectrum of spot 1 in Fig. 2. (likely lazurite)
Elemental spectrum: The peaks record characteristic X-ray signals from elements in the analyzed spot or area. This is an analysis of that location, not automatically of the entire specimen. Any mineral identification or uncertainty named in the laboratory caption is retained below.
Laboratory figure caption: Fig. 4: Energy dispersive spectrum of spot 2 in Fig. 2. (afghanite)
Elemental spectrum: The peaks record characteristic X-ray signals from elements in the analyzed spot or area. This is an analysis of that location, not automatically of the entire specimen. Any mineral identification or uncertainty named in the laboratory caption is retained below.
Laboratory figure caption: Fig. 5: Energy dispersive spectrum of spot 3 in Fig. 2. (diopside)
Elemental spectrum: The peaks record characteristic X-ray signals from elements in the analyzed spot or area. This is an analysis of that location, not automatically of the entire specimen. Any mineral identification or uncertainty named in the laboratory caption is retained below.
Laboratory figure caption: Fig. 6: Energy dispersive spectrum of spot 4 in Fig. 2. (phlogopite)
Electron microscope image: This view shows small-scale regions selected for analysis. Its brightness contrast helps distinguish regions with different compositions; it is not a photograph of their natural colors. Numbered spots connect this view to the analyses listed in the report.
Laboratory figure caption: Fig.7: Backscattered electron image of another area of the specimen.
Elemental spectrum: The peaks record characteristic X-ray signals from elements in the analyzed spot or area. This is an analysis of that location, not automatically of the entire specimen. Any mineral identification or uncertainty named in the laboratory caption is retained below.
Laboratory figure caption: Fig. 8: Energy dispersive spectrum of spot 1 in Fig. 7. (silver alloy)
Diffraction scan: This scan helps identify crystalline minerals by comparing the measured pattern with reference patterns. The laboratory interpretation explains which minerals the comparison supports.
Laboratory figure caption: Fig. 9: X-ray diffraction scan of the blue material with mmatch for afghanite.
Elemental spectrum: The peaks record characteristic X-ray signals from elements in the analyzed spot or area. This is an analysis of that location, not automatically of the entire specimen. Any mineral identification or uncertainty named in the laboratory caption is retained below.
Laboratory figure caption: Fig. 3: Energy dispersive spectrum of spot 1 in Fig. 2 (consistent with afghanite)
Electron microscope image: This view shows small-scale regions selected for analysis. Its brightness contrast helps distinguish regions with different compositions; it is not a photograph of their natural colors. Numbered spots connect this view to the analyses listed in the report.
Laboratory figure caption: Fig.4: Backscattered electron image of another area of the specimen.
Elemental spectrum: The peaks record characteristic X-ray signals from elements in the analyzed spot or area. This is an analysis of that location, not automatically of the entire specimen. Any mineral identification or uncertainty named in the laboratory caption is retained below.
Laboratory figure caption: Fig. 5: Energy dispersive spectrum of spot 1 in Fig. 4 (pyrite)
Elemental spectrum: The peaks record characteristic X-ray signals from elements in the analyzed spot or area. This is an analysis of that location, not automatically of the entire specimen. Any mineral identification or uncertainty named in the laboratory caption is retained below.
Laboratory figure caption: Fig. 6: Energy dispersive spectrum of spot 4 in Fig. 4 (pyribole, diopside has been reported with afghanite)
Read the laboratory document as text
Text and tables from the laboratory document are provided below. Consult the adjacent findings for the interpretation of each tested specimen.
Laboratory document 1
                                                Analytical Result Report

Sample id: 10471 (#9)
Submitted by: Soul Body Gems
Date completed: 1-16-2024
Operating conditions: An AMRAY 1830 SEM operated at 25 kV acceleration potential, 24 mm working distance, 0
degrees sample tilt, coated with 250 Å carbon, and also using the attached XRF unit operated at 30 kV.

A BRUKER Titan X-ray fluorescence spectrometer was also used and operated for 30 seconds at 50, 25, and 10 kV.


Fig. 1: Photograph of the specimen. Approximately 10 cm maximum dimension.


Fig.2: Backscattered electron image of an area of the specimen.
Fig. 3: Energy dispersive spectrum of spot 1 in Fig. 2 (consistent with afghanite)


Fig.4: Backscattered electron image of another area of the specimen.
Fig. 5: Energy dispersive spectrum of spot 1 in Fig. 4 (pyrite)


Fig. 6: Energy dispersive spectrum of spot 4 in Fig. 4 (pyribole, diopside has been reported with afghanite)


Summary of findings: This specimen (Fig. 1) is very interesting. The blue crystals are indeed consistent with afghanite’s
composition (Figs. 2 and 3). In addition, pyrite (Figs. 4 and 5) and diopside (Figs. 4 and 6) were identified. Afghanite is a
rare species and this is a rather nice specimen.
Date:  January 17. 2024            Signature
Laboratory document 2
Analytical Result Report
Sample id: 1122 (#7 afghanite)
Submitted by: Soul Body Gems
Date completed: 2-11-2025
Operating conditions: An AMRAY 1830 SEM operated at 25 kV acceleration potential, 24 mm working distance, 0 degrees sample tilt, coated with 250 Å carbon, and also using the attached XRF unit operated at 30 kV.
A Bruker P2 Phaser X-ray diffractometer was also used and operated at 30 kV and 10 mA.
Fig. 1: Photograph of the specimen. Approximately 3.5 cm across.
Fig.2: Backscattered electron image of an area of the specimen.
Fig. 3: Energy dispersive spectrum of spot 1 in Fig. 2. (likely lazurite)
Fig. 4: Energy dispersive spectrum of spot 2 in Fig. 2. (afghanite)
Fig. 5: Energy dispersive spectrum of spot 3 in Fig. 2. (diopside)
Fig. 6: Energy dispersive spectrum of spot 4 in Fig. 2. (phlogopite)
Fig.7: Backscattered electron image of another area of the specimen.
Fig. 8: Energy dispersive spectrum of spot 1 in Fig. 7. (silver alloy)
Fig. 9: X-ray diffraction scan of the blue material with mmatch for afghanite.
Summary of findings: This specimen (Fig. 1) is pretty. The cabochon is composed of two blue minerals: lazurite (Figs. 2 and 3) and afghanite (Figs. 2 and 4). Visually, they are not distinguishable. Chloride and sulfur are the distinguishing elements). Associated minerals found include diopside (Figs. 2 and 5) and phlogopite (Figs. 2 and 6). The metal mounting is sterling silver with about 96 % silver (Figs. 7 and 8). Afghanite was also confirmed by X-ray diffraction (Fig. 9).
Pink Muscovite Spheres · Soul Body Gems, February 2024.
A lilac-pink sphere was examined to identify their principal mica and associated minerals.
Finding: Sample 10483, completed January 27, 2024, is mainly lilac-pink muscovite, not lepidolite. Pale elbaite tourmaline and a small amount of pollucite were also found.
The low potassium-to-rubidium ratio reported for the muscovite is consistent with a highly evolved granitic pegmatite source. This finding belongs to the submitted sphere; pink appearance alone cannot identify every similar material.
Specimen correction: The tested piece was a sphere from this collection, visible in the original report photograph. The original figure caption contains a reference to beads; it is reproduced as written below and does not change the identity of the photographed specimen.
View the original report
Select a page to enlarge it. 3 pages; findings are summarized in accessible text above.
Use this guide alongside the written findings and the original report transcript. It explains the purpose of each analytical figure and preserves the laboratory’s own figure labels. The interpretations apply to the tested specimen; signals alone do not establish the identity of every similar-looking stone.
Electron microscope image: This view shows small-scale regions selected for analysis. Its brightness contrast helps distinguish regions with different compositions; it is not a photograph of their natural colors. Numbered spots connect this view to the analyses listed in the report.
Laboratory figure caption: Fig.2: Backscattered electron image of an area of the specimen.
Elemental spectrum: The peaks record characteristic X-ray signals from elements in the analyzed spot or area. This is an analysis of that location, not automatically of the entire specimen. Any mineral identification or uncertainty named in the laboratory caption is retained below.
Laboratory figure caption: Fig. 3: Energy dispersive spectrum of spot 1 in Fig. 2 (muscovite)
Elemental spectrum: The peaks record characteristic X-ray signals from elements in the analyzed spot or area. This is an analysis of that location, not automatically of the entire specimen. Any mineral identification or uncertainty named in the laboratory caption is retained below.
Laboratory figure caption: Fig. 4: Energy dispersive spectrum of spot 1 in Fig. 2 (elbaite)
Elemental spectrum: The peaks record characteristic X-ray signals from elements in the analyzed spot or area. This is an analysis of that location, not automatically of the entire specimen. Any mineral identification or uncertainty named in the laboratory caption is retained below.
Laboratory figure caption: Fig. 5: Energy dispersive spectrum of spot 1 in Fig. 2 (pollucite)
Element map: This map shows where the named elements occur within the analyzed area. Its colors represent the laboratory’s selected element channels, rather than the specimen’s visible colors. The caption below preserves any color key or distribution noted by the laboratory.
Laboratory figure caption: Fig. 6: X-ray map of part of the area shown in Fig. 2. Purple: potassium, yellow: cesium.
Read the original laboratory report as text
The following text and tables are transcribed from the original laboratory document. Figure captions identify the report images; the laboratory interpretations and limitations are preserved.
Laboratory report 1
Analytical Result Report
Sample id: 10483 (#8)
Submitted by: Soul Body Gems
Date completed: 1-26-2024
Operating conditions: An AMRAY 1830 SEM operated at 25 kV acceleration potential, 24 mm working distance, 0 degrees sample tilt, coated with 250 Å carbon, and also using the attached XRF unit operated at 30 kV.
A BRUKER Titan X-ray fluorescence spectrometer was also used and operated for 30 seconds at 50, 25, and 10 kV.
Fig. 1: Photograph of the specimen. Approximately 4.5 mm maximum dimension of the beads.
Fig.2: Backscattered electron image of an area of the specimen.
Fig. 3: Energy dispersive spectrum of spot 1 in Fig. 2 (muscovite)
Fig. 4: Energy dispersive spectrum of spot 1 in Fig. 2 (elbaite)
Fig. 5: Energy dispersive spectrum of spot 1 in Fig. 2 (pollucite)
Fig. 6: X-ray map of part of the area shown in Fig. 2. Purple: potassium, yellow: cesium.
Table 1: minor and trace elements in the muscovite.
Laboratory data as recorded in the report
Element
Reported value
Iron
0.02
Manganese
0.16
Potassium
8.3
Rubidium
0.7
Sodium
0.7
Summary of findings: This specimen (Fig. 1) is very interesting! The bulk is a lilac-pink muscovite (Figs.2 and 3) (Not lepidolite!). The K/Rb ration in this muscovite is very low, about 12, which indicates a highly evolved granitic pegmatite was the source. In some cases, muscovite instead can be present in these pegmatites, and sometimes, both lepidolite and muscovite. Pale colored tourmaline- elbaite (Figs. 2 and 4) are present as well. And very surprising, a little pollucite (Figs. 2, 5 and 6).
Date: January 27. 2024 Signature
Quartz cabochons with dark green inclusions were analyzed to identify the green material.
Finding: Sample 1508, completed July 1, 2025, is chiefly quartz. The dark green inclusions are a montmorillonite-group mineral, most likely saponite. Apatite was also identified.
The report distinguishes these inclusions from visually similar quartz material in which glauconite was present. “Saponite” here is a likely species assignment within the group, not a conclusive determination of every green inclusion in other specimens.
View the original report
Select a page to enlarge it. 3 pages; findings are summarized in accessible text above.
Use this guide alongside the written findings and the original report transcript. It explains the purpose of each analytical figure and preserves the laboratory’s own figure labels. The interpretations apply to the tested specimen; signals alone do not establish the identity of every similar-looking stone.
Electron microscope image: This view shows small-scale regions selected for analysis. Its brightness contrast helps distinguish regions with different compositions; it is not a photograph of their natural colors. Numbered spots connect this view to the analyses listed in the report.
Laboratory figure caption: Fig.2: Backscattered electron image of an area of the specimen in Fig. 1.
Elemental spectrum: The peaks record characteristic X-ray signals from elements in the analyzed spot or area. This is an analysis of that location, not automatically of the entire specimen. Any mineral identification or uncertainty named in the laboratory caption is retained below.
Laboratory figure caption: Fig. 3: Energy dispersive spectrum of spot 1 in Fig. 2. (quartz)
Elemental spectrum: The peaks record characteristic X-ray signals from elements in the analyzed spot or area. This is an analysis of that location, not automatically of the entire specimen. Any mineral identification or uncertainty named in the laboratory caption is retained below.
Laboratory figure caption: Fig. 4: Energy dispersive spectrum of spot 2 in Fig. 2. (montmorillonite group likely)
Elemental spectrum: The peaks record characteristic X-ray signals from elements in the analyzed spot or area. This is an analysis of that location, not automatically of the entire specimen. Any mineral identification or uncertainty named in the laboratory caption is retained below.
Laboratory figure caption: Fig. 5: Energy dispersive spectrum of spot 3 in Fig. 2. (apatite)
Read the original laboratory report as text
The following text and tables are transcribed from the original laboratory document. Figure captions identify the report images; the laboratory interpretations and limitations are preserved.
Laboratory report 1
Analytical Result Report
Sample id: 1508 (#7 quartz cabs w inclusions)
Submitted by: Soul Body Gems
Date completed: 7-1-2025
Operating conditions: An AMRAY 1830 SEM operated at 25 kV acceleration potential, 24 mm working distance, 0 degrees sample tilt, coated with 250 Å carbon, and also using the attached XRF unit operated at 30 kV.
Fig. 1: Photograph of the specimens. 1.7 cm maximum dimension. Close-ups on the right
Fig.2: Backscattered electron image of an area of the specimen in Fig. 1.
Fig. 3: Energy dispersive spectrum of spot 1 in Fig. 2. (quartz)
Fig. 4: Energy dispersive spectrum of spot 2 in Fig. 2. (montmorillonite group likely)
Fig. 5: Energy dispersive spectrum of spot 3 in Fig. 2. (apatite)
Summary of findings: These are interesting specimens (Fig. 1). The main component is of course quartz (Figs. 2 and 3). The dark green inclusions (Figs. 2 and 4) are a member of the montmorillonite group, most likely saponite). These inclusions are indeed different from some similar material where glauconite was present instead. There is also some apatite present (Figs. 2 and 5).
Neelite Polished Shapes · Soul Body Gems, January 2024.
A specimen sold under the name Neelite was examined for its mineral identity and texture.
Finding: Sample 9252, completed May 10, 2021, is dominantly quartz. The lab observed goethite streaks and textures suggestive of heavily replaced riebeckite or related amphiboles, with measurable iron and magnesium. The researcher leans toward very recrystallized tiger-eye material, while also allowing the possibility of vein quartz with iron- and magnesium-rich streaks.
Neither original amphibole identification nor the tiger-eye interpretation is conclusive from this report. “Neelite” is the market name used for the submitted specimen, not a mineral species confirmed by the analysis.
View the original report
Select a page to enlarge it. 3 pages; findings are summarized in accessible text above.
Use this guide alongside the written findings and the original report transcript. It explains the purpose of each analytical figure and preserves the laboratory’s own figure labels. The interpretations apply to the tested specimen; signals alone do not establish the identity of every similar-looking stone.
Electron microscope image: This view shows small-scale regions selected for analysis. Its brightness contrast helps distinguish regions with different compositions; it is not a photograph of their natural colors. Numbered spots connect this view to the analyses listed in the report.
Laboratory figure caption: Fig. 2: Backscattered electron image of sample 21.
Elemental spectrum: The peaks record characteristic X-ray signals from elements in the analyzed spot or area. This is an analysis of that location, not automatically of the entire specimen. Any mineral identification or uncertainty named in the laboratory caption is retained below.
Laboratory figure caption: Fig. 3: Energy dispersive spectral analysis of spot 1 in Fig. 2. (quartz)
Read the laboratory document as text
Text and tables from the laboratory document are provided below. Consult the adjacent findings for the interpretation of each tested specimen.
Laboratory document 1
                                                Analytical Result Report

Sample id: 9252 (sample 21)
Submitted by: K. Bitner
Date submitted: March 27, 2021.
Date completed: May 10, 2021.
Operating conditions: An AMRAY 1830 SEM operated at 25 kV acceleration potential, 26 mm working distance, 15
degrees sample tilt, coated with 250 Å carbon. Using the X-ray fluorescence attachment with 35kVpotental in
conjunction with the EDS system.


Fig. 1: Photograph of the specimens #21, 5 cm maximum dimension,, with a close-up on the right.


Fig. 2: Backscattered electron image of sample 21.
Fig. 3: Energy dispersive spectral analysis of spot 1 in Fig. 2. (quartz)


Fig. 4: Photomicrograph of specimen 21 showing streaks of goethite.


Table 1: Trace and minor element composition of sample 21. (in wt. %)

 Iron                                 0.81
 Magnesium                          1.21
 Manganese                          0.01
Summary of findings: This specimen (Fig. 1) is dominantly quartz (Figs. 2 and 3) but it does contain some iron and
notably magnesium and a small amount of manganese (Table 1). The clos-up in Fig. 1 does reveal textures suggestive of
heavily replaced riebeckite or related amphiboles. However, it is heavily recrystallized, and it is only a possible choice
that this represents a very recrystallized tiger eye material. The other option is some vein quartz with steaks rich in iron
and magnesium, but the magnesium is the unusual part.  I would lean more toward a very recrystallized tiger eye.


Date: May 10, 2021                    Signature
An Oregon opal submitted under the market name Caramel Opal; this is distinct from the Mexican Caramel Opal entry.
Finding: Sample 1511, completed July 5, 2025, has a silicon dioxide composition and is optically isotropic, supporting identification as opal. The report notes faint yellow-orange ultraviolet fluorescence.
The report suggests the amorphous silica may be geologically relatively young, but does not date the material. Compare Caramel Opal (Mexico) for a separate specimen and locality.
View the original report
Select a page to enlarge it. 3 pages; findings are summarized in accessible text above.
Use this guide alongside the written findings and the original report transcript. It explains the purpose of each analytical figure and preserves the laboratory’s own figure labels. The interpretations apply to the tested specimen; signals alone do not establish the identity of every similar-looking stone.
Electron microscope image: This view shows small-scale regions selected for analysis. Its brightness contrast helps distinguish regions with different compositions; it is not a photograph of their natural colors. Numbered spots connect this view to the analyses listed in the report.
Laboratory figure caption: Fig.2: Backscattered electron image of an area of the specimen in Fig. 1.
Elemental spectrum: The peaks record characteristic X-ray signals from elements in the analyzed spot or area. This is an analysis of that location, not automatically of the entire specimen. Any mineral identification or uncertainty named in the laboratory caption is retained below.
Laboratory figure caption: Fig. 3: Energy dispersive spectrum of spot 1 in Fig. 2. (silicon dioxide)
Elemental spectrum: The peaks record characteristic X-ray signals from elements in the analyzed spot or area. This is an analysis of that location, not automatically of the entire specimen. Any mineral identification or uncertainty named in the laboratory caption is retained below.
Laboratory figure caption: Fig. 4: Energy dispersive spectrum of spot 2 in Fig. 2. (silicon dioxide)
Read the original laboratory report as text
The following text and tables are transcribed from the original laboratory document. Figure captions identify the report images; the laboratory interpretations and limitations are preserved.
Laboratory report 1
Analytical Result Report
Sample id: 1511 (#7 Oregon opal)
Submitted by: Soul Body Gems
Date completed: 7-5-2025
Operating conditions: An AMRAY 1830 SEM operated at 25 kV acceleration potential, 24 mm working distance, 0 degrees sample tilt, coated with 250 Å carbon, and also using the attached XRF unit operated at 30 kV.
Fig. 1: Photograph of the specimens. 3.5 cm maximum dimension. Right image shows small fragments under crossed Nichol polarized light. The pieces are all isotropic
Fig.2: Backscattered electron image of an area of the specimen in Fig. 1.
Fig. 3: Energy dispersive spectrum of spot 1 in Fig. 2. (silicon dioxide)
Fig. 4: Energy dispersive spectrum of spot 2 in Fig. 2. (silicon dioxide)
Summary of findings: These are interesting specimens (Fig. 1). The composition is silicon dioxide (Figs. 2-4). Optically, the material is completely isotropic (Fig. 1), thus they are opal. It is likely that they are geologically speaking relatively young since amorphous silica does crystallized in time. UV fluorescence is a faint yello-orange.
Date: 7-5-2025 Signature
A confirmed serpentine-rich specimen, presented separately from the previously tested Indian serpentine.
Finding: Sample 10619, completed July 16, 2024, is a serpentine-rich slab. Chromite and chromium-bearing magnetite are abundant; magnesite masses and very faint calcite-filled fractures also occur. The laboratory interprets it as the product of hydrous metamorphism of pre-existing ultramafic rock.
The report does not specify a geographic locality for this specimen. See the separate Serpentine (India) test for another confirmed material. Findings from one specimen should not be assigned to the other.
View the original report
Select a page to enlarge it. 4 pages; findings are summarized in accessible text above.
Use this guide alongside the written findings and the original report transcript. It explains the purpose of each analytical figure and preserves the laboratory’s own figure labels. The interpretations apply to the tested specimen; signals alone do not establish the identity of every similar-looking stone.
Electron microscope image: This view shows small-scale regions selected for analysis. Its brightness contrast helps distinguish regions with different compositions; it is not a photograph of their natural colors. Numbered spots connect this view to the analyses listed in the report.
Laboratory figure caption: Fig.2: Backscattered electron image of an area of one of the broken beads.
Elemental spectrum: The peaks record characteristic X-ray signals from elements in the analyzed spot or area. This is an analysis of that location, not automatically of the entire specimen. Any mineral identification or uncertainty named in the laboratory caption is retained below.
Laboratory figure caption: Fig. 3: Energy dispersive spectrum of spot 1 in Fig. 2 (Chromium-bearing magnetite)
Elemental spectrum: The peaks record characteristic X-ray signals from elements in the analyzed spot or area. This is an analysis of that location, not automatically of the entire specimen. Any mineral identification or uncertainty named in the laboratory caption is retained below.
Laboratory figure caption: Fig. 4: Energy dispersive spectrum of spot 2 in Fig. 2 (chromite)
Elemental spectrum: The peaks record characteristic X-ray signals from elements in the analyzed spot or area. This is an analysis of that location, not automatically of the entire specimen. Any mineral identification or uncertainty named in the laboratory caption is retained below.
Laboratory figure caption: Fig. 5: Energy dispersive spectrum of spot 4 in Fig. 2 (serpentine group)
Elemental spectrum: The peaks record characteristic X-ray signals from elements in the analyzed spot or area. This is an analysis of that location, not automatically of the entire specimen. Any mineral identification or uncertainty named in the laboratory caption is retained below.
Laboratory figure caption: Fig. 6: Energy dispersive spectrum of spot 2 in Fig. 2 (magnesite)
Element map: This map shows where the named elements occur within the analyzed area. Its colors represent the laboratory’s selected element channels, rather than the specimen’s visible colors. The caption below preserves any color key or distribution noted by the laboratory.
Laboratory figure caption: Fig. 7: X-ray maps of the area shown in Fig. 2. magnesium: calciuum: blue, , iron: green..
Read the original laboratory report as text
The following text and tables are transcribed from the original laboratory document. Figure captions identify the report images; the laboratory interpretations and limitations are preserved.
Laboratory report 1
Analytical Result Report
Sample id: 10619 (number 7)
Submitted by: Soul Body Gems
Date completed: 7-16-2024
Operating conditions: An AMRAY 1830 SEM operated at 25 kV acceleration potential, 24 mm working distance, 0 degrees sample tilt, coated with 250 Å carbon, and also using the attached XRF unit operated at 30 kV.
Fig. 1: Photograph of the specimen. 75 mm diameter.
Fig.2: Backscattered electron image of an area of one of the broken beads.
Fig. 3: Energy dispersive spectrum of spot 1 in Fig. 2 (Chromium-bearing magnetite)
Fig. 4: Energy dispersive spectrum of spot 2 in Fig. 2 (chromite)
Fig. 5: Energy dispersive spectrum of spot 4 in Fig. 2 (serpentine group)
Fig. 6: Energy dispersive spectrum of spot 2 in Fig. 2 (magnesite)
Fig. 7: X-ray maps of the area shown in Fig. 2. magnesium: calciuum: blue, , iron: green..
Summary of findings: This specimen (Fig. 1) is a Pretty slab of serpentine (Figs. 2 and 5). Abundant chromium-bearing magnetite and chromite (Figs. 2-4) are scattered throughout the specimen and magnesite masses (Figs. 2 and 6) are seen; this is typical for serpentine. Very faint fractures fills with calcite are seen in Fig. 7. The material is the result of hydrous metamorphism of pre-existing ultramafic rocks.
Date: July 16, 2024 Signature
Pakistani quartz with gray included material examined for the identity of the inclusions.
Finding: Sample 1507, completed June 30, 2025, contains quartz with gray clay-mineral inclusions. The researcher describes the included material as most likely an interlayered combination of montmorillonite- and chlorite-group species.
“Clay Quartz” is a descriptive market name for this tested piece. The report does not provide a definitive mineral species identification for every gray inclusion.
View the original report
Select a page to enlarge it. 3 pages; findings are summarized in accessible text above.
Use this guide alongside the written findings and the original report transcript. It explains the purpose of each analytical figure and preserves the laboratory’s own figure labels. The interpretations apply to the tested specimen; signals alone do not establish the identity of every similar-looking stone.
Electron microscope image: This view shows small-scale regions selected for analysis. Its brightness contrast helps distinguish regions with different compositions; it is not a photograph of their natural colors. Numbered spots connect this view to the analyses listed in the report.
Laboratory figure caption: Fig.2: Backscattered electron image of an area of the specimen in Fig. 1. (top)
Elemental spectrum: The peaks record characteristic X-ray signals from elements in the analyzed spot or area. This is an analysis of that location, not automatically of the entire specimen. Any mineral identification or uncertainty named in the laboratory caption is retained below.
Laboratory figure caption: Fig. 3: Energy dispersive spectrum of spot 1 in Fig. 2. (quartz with included clay species)
Elemental spectrum: The peaks record characteristic X-ray signals from elements in the analyzed spot or area. This is an analysis of that location, not automatically of the entire specimen. Any mineral identification or uncertainty named in the laboratory caption is retained below.
Laboratory figure caption: Fig. 4: Energy dispersive spectrum of spot 2 in Fig. 2. (quartz)
Read the original laboratory report as text
The following text and tables are transcribed from the original laboratory document. Figure captions identify the report images; the laboratory interpretations and limitations are preserved.
Laboratory report 1
Analytical Result Report
Sample id: 1507 (#6 quartz from Pakistan with gray material included)
Submitted by: Soul Body Gems
Date completed: 6-30-2025
Operating conditions: An AMRAY 1830 SEM operated at 25 kV acceleration potential, 24 mm working distance, 0 degrees sample tilt, coated with 250 Å carbon, and also using the attached XRF unit operated at 30 kV.
Fig. 1: Photograph of the specimens. 6 cm maximum dimension.
Fig.2: Backscattered electron image of an area of the specimen in Fig. 1. (top)
Fig. 3: Energy dispersive spectrum of spot 1 in Fig. 2. (quartz with included clay species)
Fig. 4: Energy dispersive spectrum of spot 2 in Fig. 2. (quartz)
Summary of findings: This is an interesting specimen (Fig. 1). The gray inclusions are clay species, most likely an interlayered combination of montmorillonite and chlorite group species. I have seen similar material from an Alpine cleft at Piiz Beverin, Graubuenden, Switzerland.
Chocolate Hematite Calcite · Soul Body Gems, December 2023.
Sunset Calcite is another name used for the tested Chocolate Calcite specimen from Tonglushan Mine, China.
Finding: Sample 10472, completed January 17, 2024, consists mainly of calcite. Powdery hematite coated an earlier calcite growth, and a second growth of calcite followed. The report supports this layered calcite and hematite identification for the submitted specimen.
Locality: Tonglushan Mine, China, according to Soul Body Gems provenance. The analytical report identifies the minerals in the submitted specimen; it does not independently verify geographic origin.
Use this guide alongside the written findings and the original report transcript. It explains the purpose of each analytical figure and preserves the laboratory’s own figure labels. The interpretations apply to the tested specimen; signals alone do not establish the identity of every similar-looking stone.
Electron microscope image: This view shows small-scale regions selected for analysis. Its brightness contrast helps distinguish regions with different compositions; it is not a photograph of their natural colors. Numbered spots connect this view to the analyses listed in the report.
Laboratory figure caption: Fig.2: Backscattered electron image of an area of the specimen.
Elemental spectrum: The peaks record characteristic X-ray signals from elements in the analyzed spot or area. This is an analysis of that location, not automatically of the entire specimen. Any mineral identification or uncertainty named in the laboratory caption is retained below.
Laboratory figure caption: Fig. 3: Energy dispersive spectrum of spot 1 in Fig. 2 (calcite)
Elemental spectrum: The peaks record characteristic X-ray signals from elements in the analyzed spot or area. This is an analysis of that location, not automatically of the entire specimen. Any mineral identification or uncertainty named in the laboratory caption is retained below.
Laboratory figure caption: Fig. 4: Energy dispersive spectrum of spot 1 in Fig. 4 (hematite coating on calcite)
Read the original laboratory report as text
The following text and tables are transcribed from the original laboratory document. Figure captions identify the report images; the laboratory interpretations and limitations are preserved.
Laboratory report 1
Analytical Result Report
Sample id: 10472 (#11)
Submitted by: Soul Body Gems
Date completed: 1-16-2024
Operating conditions: An AMRAY 1830 SEM operated at 25 kV acceleration potential, 24 mm working distance, 0 degrees sample tilt, coated with 250 Å carbon, and also using the attached XRF unit operated at 30 kV.
A BRUKER Titan X-ray fluorescence spectrometer was also used and operated for 30 seconds at 50, 25, and 10 kV.
Fig. 1: Photograph of the specimen. Approximately 6 cm maximum dimension.
Fig.2: Backscattered electron image of an area of the specimen.
Fig. 3: Energy dispersive spectrum of spot 1 in Fig. 2 (calcite)
Fig. 4: Energy dispersive spectrum of spot 1 in Fig. 4 (hematite coating on calcite)
Table 1: minor and trace elements in the calcite.
Laboratory data as recorded in the report
Element
Reported value
Iron
0.4
Magnesium
0.1
Manganese
0.02
Strontium
0.01
Summary of findings: This specimen (Fig. 1) shows a multi-step crystallization. The bulk of the specimen is calcite (Figs. 2 and 3). After the formation of calcite, a coating of powdery hematite was deposited (Figs. 2 and 4), this was followed by a second growth of calcite as seen in Figs 1 and 2. Table 1 shows that the calcite is low in trace and minor elements, some of the hematite may be due to hematite inclusions in the area analyzed.
Barite Chrysocolla Azurite from Kazakhstan · August 2025. Collection photograph; sample 1207 was separately submitted.
This Kazakhstan-sourced specimen is a polished section of a hydrothermal vein.
What the report found: Sample 1207 consists mainly of quartz and barite. The laboratory also found minor galena and malachite/azurite, with signs of oxidation affecting some phases.
The Kazakhstan locality is Soul Body Gems sourcing information; the analysis identifies minerals in the submitted specimen, not geographic origin.
View the original report
Select a page to enlarge it. 4 pages; findings are summarized in accessible text above.
Use this guide alongside the written findings and the original report transcript. It explains the purpose of each analytical figure and preserves the laboratory’s own figure labels. The interpretations apply to the tested specimen; signals alone do not establish the identity of every similar-looking stone.
Electron microscope image: This view shows small-scale regions selected for analysis. Its brightness contrast helps distinguish regions with different compositions; it is not a photograph of their natural colors. Numbered spots connect this view to the analyses listed in the report.
Laboratory figure caption: Fig.2: Backscattered electron image of an area of the specimen.
Elemental spectrum: The peaks record characteristic X-ray signals from elements in the analyzed spot or area. This is an analysis of that location, not automatically of the entire specimen. Any mineral identification or uncertainty named in the laboratory caption is retained below.
Laboratory figure caption: Fig. 3: Energy dispersive spectrum of spot 1 in Fig. 2. (quartz)
Elemental spectrum: The peaks record characteristic X-ray signals from elements in the analyzed spot or area. This is an analysis of that location, not automatically of the entire specimen. Any mineral identification or uncertainty named in the laboratory caption is retained below.
Laboratory figure caption: Fig. 4: Energy dispersive spectrum of spot 2 in Fig. 2. (barite)
Elemental spectrum: The peaks record characteristic X-ray signals from elements in the analyzed spot or area. This is an analysis of that location, not automatically of the entire specimen. Any mineral identification or uncertainty named in the laboratory caption is retained below.
Laboratory figure caption: Fig. 5: Energy dispersive spectrum of spot 2 in Fig. 2. (galena, possibly beginning oxidation to anglesite)
Electron microscope image: This view shows small-scale regions selected for analysis. Its brightness contrast helps distinguish regions with different compositions; it is not a photograph of their natural colors. Numbered spots connect this view to the analyses listed in the report.
Laboratory figure caption: Fig.6: Backscattered electron image of another area of the specimen.
Elemental spectrum: The peaks record characteristic X-ray signals from elements in the analyzed spot or area. This is an analysis of that location, not automatically of the entire specimen. Any mineral identification or uncertainty named in the laboratory caption is retained below.
Laboratory figure caption: Fig. 7: Energy dispersive spectrum of spot 4 in Fig. 5. (malachite/azurite)
Read the laboratory document as text
Text and tables from the laboratory document are provided below. Consult the adjacent findings for the interpretation of each tested specimen.
Laboratory document 1
                                                Analytical Result Report

Sample id: 1207 (#6 Kazakhstan sample)
Submitted by: Soul Body Gems
Date completed: 12-22-2024
Operating conditions: An AMRAY 1830 SEM operated at 25 kV acceleration potential, 24 mm working distance, 0
degrees sample tilt, coated with 250 Å carbon, and also using the attached XRF unit operated at 30 kV.


                                                        ig. 1: Photograph of the specimens. 6 cm maximum dimensions.


Fig.2: Backscattered electron image of an area of the specimen.
Fig. 3: Energy dispersive spectrum of spot 1 in Fig. 2. (quartz)


Fig. 4: Energy dispersive spectrum of spot 2 in Fig. 2. (barite)
Fig. 5: Energy dispersive spectrum of spot 2 in Fig. 2. (galena, possibly beginning oxidation to anglesite)


Fig.6: Backscattered electron image of another area of the specimen.
Fig. 7: Energy dispersive spectrum of spot 4 in Fig. 5. (malachite/azurite)


Summary of findings: This specimen (Fig. 1) is a piece of a hydrothermal vein consisting mainly of quartz (Figs. 2 and 3 )
and barite (Figs. 2 and 4).  It also contains a small amount of galena (Figs. 2 and 5) and some malachite/azurite (Figs. 6
and 7. The malachite likely stems from oxidation of originally associated copper sulfides in the hydrothermal vein which
subsequently have altered to green and blue malachite and azurite. There is evidence of at least some oxidation of the
galena as well, it is likely partially oxidized to anglesite, see the small oxygen peak in Fig. 5.


Date:  12-22-2024            Signature
A separately tested lepidolite specimen from an evolved granitic pegmatite.
What the report found: Sample 9249 confirmed lepidolite with near-endmember spessartine, beryl, quartz, a little albite, and later calcite fracture filling. Direct-current plasma analysis measured approximately 3 wt. % lithium in the submitted material.
This report applies to this specimen and is separate from the other lepidolite reports in the library.
View the original report
Select a page to enlarge it. 4 pages; findings are summarized in accessible text above.
Use this guide alongside the written findings and the original report transcript. It explains the purpose of each analytical figure and preserves the laboratory’s own figure labels. The interpretations apply to the tested specimen; signals alone do not establish the identity of every similar-looking stone.
Electron microscope image: This view shows small-scale regions selected for analysis. Its brightness contrast helps distinguish regions with different compositions; it is not a photograph of their natural colors. Numbered spots connect this view to the analyses listed in the report.
Laboratory figure caption: Fig. 2: Backscattered electron image of sample 18.
Elemental spectrum: The peaks record characteristic X-ray signals from elements in the analyzed spot or area. This is an analysis of that location, not automatically of the entire specimen. Any mineral identification or uncertainty named in the laboratory caption is retained below.
Laboratory figure caption: Fig. 3: Energy dispersive spectral analysis of spot 1 in Fig. 2. (spessartine)
Elemental spectrum: The peaks record characteristic X-ray signals from elements in the analyzed spot or area. This is an analysis of that location, not automatically of the entire specimen. Any mineral identification or uncertainty named in the laboratory caption is retained below.
Laboratory figure caption: Fig. 4: Energy dispersive spectral analysis of spot 2 in Fig. 2. (lepidolite)
Elemental spectrum: The peaks record characteristic X-ray signals from elements in the analyzed spot or area. This is an analysis of that location, not automatically of the entire specimen. Any mineral identification or uncertainty named in the laboratory caption is retained below.
Laboratory figure caption: Fig. 5: Energy dispersive spectral analysis of spot 5 in Fig. 2. (beryl)
Elemental spectrum: The peaks record characteristic X-ray signals from elements in the analyzed spot or area. This is an analysis of that location, not automatically of the entire specimen. Any mineral identification or uncertainty named in the laboratory caption is retained below.
Laboratory figure caption: Fig. 6: Energy dispersive spectral analysis of spot 6 in Fig. 2. (quartz)
Element map: This map shows where the named elements occur within the analyzed area. Its colors represent the laboratory’s selected element channels, rather than the specimen’s visible colors. The caption below preserves any color key or distribution noted by the laboratory.
Text and tables from the laboratory document are provided below. Consult the adjacent findings for the interpretation of each tested specimen.
Laboratory document 1
                                                Analytical Result Report

Sample id: 9249 (sample 18, lepidolite)
Submitted by: K. Bitner
Date submitted: March 27, 2021.
Date completed: May 3, 2021.
Operating conditions: An AMRAY 1830 SEM operated at 25 kV acceleration potential, 26 mm working distance, 15
degrees sample tilt, coated with 250 Å carbon. Using the X-ray fluorescence attachment with 35kVpotental in
conjunction with the EDS system. A Beckman Spectrospan V direct current plasma spectrometer was used to determine
the lithium content.


Fig. 1: Photograph of the specimens #18, 2 cm on edge.


Fig. 2: Backscattered electron image of sample 18.
Fig. 3: Energy dispersive spectral analysis of spot 1 in Fig. 2. (spessartine)


Fig. 4: Energy dispersive spectral analysis of spot 2 in Fig. 2. (lepidolite)
Fig. 5: Energy dispersive spectral analysis of spot 5 in Fig. 2. (beryl)


Fig. 6: Energy dispersive spectral analysis of spot 6 in Fig. 2. (quartz)
Fig. 7: X-ray maps. Left: Silicon-orange, potassium-blue. Middle: Aluminum-blue, Silicon-orange. Right: Manganese-
yellow, calcium-blue.


Table 1: Trace and minor elements in wt. % in sample 18.


 Calcium                              0.19
 Iron                                   0.0
 Manganese                          1.00
 Titanium                            0.010


Summary of findings: This specimen (Fig. 1) is indeed lepidolite Figs. 2,4,.and 7). There is also near endmember
spessartine (Figs. 2 and 3), beryl (Figs. 2 and 5) and quartz (Figs. 2 and 6). From the X-ray maps, a little albite was noted
as well. Table 1 shows pertinent trace elements, note the much higher concentration of manganese over iron! This
material that came from a very evolved granitic pegmatite. Some late-stage fracture filing of calcite is evident from Fig.
8 where a thin line of calcium outlines the calcite filling of a fracture, this likely developed much later than the origin of
the pegmatite. Lithium was determined by DCP and revealed around 3 wt. % lithium. This amount may actually be lower
than it actually as some inclusions of non-lepidolite material likely ended up in the material analyzed.


Date: May 3, 2021                    Signature
Sodalite “Moonstone” Sterling Silver Rings · Soul Body Gems, December 2023.
A Brazilian-sourced sodalite material marketed as “Sodalite with Moonstone.”
What the report found: Sample 9024 examined the shimmering layer. The schiller-bearing and ordinary areas were chemically similar sodalite; the researcher attributed the shimmer to a physical layer containing tiny feldspar, mica, and oxide inclusions during secondary sodalite growth. The examined layer was not identified as moonstone.
Brazil is Soul Body Gems provenance. The report does not establish that every inclusion in the whole specimen is absent; it describes the areas examined.
View the original report
Select a page to enlarge it. 3 pages; findings are summarized in accessible text above.
Use this guide alongside the written findings and the original report transcript. It explains the purpose of each analytical figure and preserves the laboratory’s own figure labels. The interpretations apply to the tested specimen; signals alone do not establish the identity of every similar-looking stone.
Electron microscope image: This view shows small-scale regions selected for analysis. Its brightness contrast helps distinguish regions with different compositions; it is not a photograph of their natural colors. Numbered spots connect this view to the analyses listed in the report.
Laboratory figure caption: Fig. 2: Backscattered electron image of the surface showing chiller. The image was chosen where it appeared that the schiller layer was intercepting the surface.
Elemental spectrum: The peaks record characteristic X-ray signals from elements in the analyzed spot or area. This is an analysis of that location, not automatically of the entire specimen. Any mineral identification or uncertainty named in the laboratory caption is retained below.
Laboratory figure caption: Fig. 3: Energy dispersive spectrum of area 1 in Fig. 2. A typical spectrum of sodalite.
Electron microscope image: This view shows small-scale regions selected for analysis. Its brightness contrast helps distinguish regions with different compositions; it is not a photograph of their natural colors. Numbered spots connect this view to the analyses listed in the report.
Laboratory figure caption: Fig. 4: Backscattered electron image of the surface not showing schiller effect.
Elemental spectrum: The peaks record characteristic X-ray signals from elements in the analyzed spot or area. This is an analysis of that location, not automatically of the entire specimen. Any mineral identification or uncertainty named in the laboratory caption is retained below.
Laboratory figure caption: Fig. 5: Energy dispersive spectrum of area 1 in Fig. 4. A typical spectrum of sodalite, essentially identical to the one shown in Fig. 3.
Read the laboratory document as text
Text and tables from the laboratory document are provided below. Consult the adjacent findings for the interpretation of each tested specimen.
Laboratory document 1
Analytical Result Report
Sample id: 9024 schiller effect sodalite
Submitted by: Kathreen Bitner
Date submitted: May 19, 2020
Date completed: May 21, 2020
Operating conditions: JEOL JSM-6400 operated at 25 kV acceleration potential, 15 mm working distance, 15 degrees sample tilt, coated with 250 Å carbon. Using the X-ray fluorescence attacement with 35kv potental in conjunction with the EDS system
Fig. 1: Photomicrograph of the schiller effect of a sodalite area. 0.7 mm across. Note small sparkling particles.
Fig. 2: Backscattered electron image of the surface showing chiller. The image was chosen where it appeared that the schiller layer was intercepting the surface.
Fig. 3: Energy dispersive spectrum of area 1 in Fig. 2. A typical spectrum of sodalite.
Fig. 4: Backscattered electron image of the surface not showing schiller effect.
Fig. 5: Energy dispersive spectrum of area 1 in Fig. 4. A typical spectrum of sodalite, essentially identical to the one shown in Fig. 3.
Fig. 6: Petrographic images of the schiller layer (plane polarized light left, crossed Nichols, right. 0.750 mm across each image.
Summary of findings:
Beautiful specimen! It is interesting to note that the chemical composition of areas showing versus those not showing the schiller effect is essentially the same (Figs. 3 and 5). No chemical zoning was evident in the sodalite (Figs. 2 and 4). The cause of the schiller is not chemical but related to physical effects. The schiller is following in a planar fashion and it has some thickness to it (Fig. 1). There are tiny bright grains visible, some are oxides, and some appear to be tiny flakes of a mica species. The boundary appears to follow along the cleavage direction {110} and may represent a later healing with secondary sodalite.
An investigation of the schillering layer showed to be continuous with the non-schillering part. However, many inclusions od feldspars, micas and dark oxides can be discerned. Thus, the effect of schiller is caused by these inclusions which formed when thee secondary sodalite crystallized
An aquamarine disk with a visible schiller effect, sourced as Brazilian material.
What the report found: Sample 9212 is iron-rich beryl. Fluid inclusions follow healed fractures, and the researcher found no signs of decrepitation in these inclusions, indicating the material was not heated to produce the observed schiller.
The report header mistakenly reads “rhodochrosite sphere”; its photograph, figure captions, trace-element table, and findings describe this aquamarine disk. Brazil is supplied provenance. The additional December 2024 report below examines a separate aquamarine specimen.
The following text and tables are transcribed from the original laboratory document. Figure captions identify the report images; the laboratory interpretations and limitations are preserved.
Laboratory report 1
Analytical Result Report
Sample id: 9212 (rhodochrosite sphere)
Submitted by: K. Bitner
Date submitted: Oct. 16, 2020
Date completed: Oct. 26, 2020
Operating conditions: JEOL JSM-6400 operated at 25 kV acceleration potential, 15 mm working distance, 15 degrees sample tilt, coated with 250 Å carbon. Using the X-ray fluorescence attachment with 35kv potental in conjunction with the EDS system.
Fig. 1: Photograph of the aquamarine disk showing schiller. Approximately 46 mm wide.
Fig. 2: Photomicrograph of the shciller region showing it rich in fluid inclusions 380 microns field of view. Image stacked from 10 images.
Fig. 3: A healed fracture with opaque inclusions and fluid inclusions nearby. 380 microns field of view. Image stacke d from 10 images.
Table 1: Trace element compositions of the aquamarine disk
Laboratory data as recorded in the report
element
Iron
8260 ppm
Manganese
113 ppm
Zinc
191 ppm
Summary of findings: This is a very interesting specimen! Chemically, it is iron-rich beryl (Table 1) which typical for aquamarine, the blue color is caused by divalent iron. The schiller regions are rich in fluid inclusions. They are aligned along a plane, indicating that they represent small fractures that have then rehealed w more beryl but lots of fluids from which the beryl grew from have become entrapped (Fig. 2). Some larger fractures have also been rehealed (Fig. 3). What is important is the fact that the n fluid inclusions do NOT show any signs of decrepitation which indicates that the material was not heated to produce the schiller effect. The event that caused these fractures to occur is likely a result of pocket rupture followed by resealing of the pocket that did not loose all fluids and resumed crystal growth. A great example of preserving details of this beryl’s formation history!
Date: October 26 ,2020 Signature
Additional aquamarine report · Sample 1215
Completed December 24, 2024. This is a separate specimen from the aquamarine disk discussed above.
What this report found: The tested material is crystalline beryl, with minor and trace elements typical of aquamarine. Abundant tiny inclusions appear to be mica flakes. The researcher could not detect evidence of heat treatment and noted no ruptured fluid inclusions. This observation applies to the examined specimen and does not establish the treatment history of every aquamarine in the collection.
Brazil is Soul Body Gems sourcing information; this report identifies the submitted material rather than independently determining its geographic origin.
View the original December 2024 report
Select a page to enlarge it. Both pages and all analytical figures are preserved.
Figure 1 shows the specimens, measuring approximately 2–2.5 cm, and a close-up of their turbidity. Figure 2 is a backscattered electron image of the examined area; its contrast is analytical rather than the stone’s natural color. Figure 3 records the energy-dispersive spectrum from spot 1 in Figure 2, identified as beryl by the laboratory. Table 1 reports minor and trace elements in weight percent.
Read the December 2024 laboratory report as text
The original wording and table values are reproduced below.
Analytical Result Report
Sample id: 1215 (#13 beryl)
Submitted by: Soul Body Gems
Date completed: 12-24-2024
Operating conditions: An AMRAY 1830 SEM operated at 25 kV acceleration potential, 24 mm working distance, 0 degrees sample tilt, coated with 250 Å carbon, and also using the attached XRF unit operated at 30 kV.
Fig. 1: Photograph of the specimens. 2-2.5 cm maximum dimensions. Close-up on the riight showing turbidity.
Fig.2: Backscattered electron image of an area of the specimen.
Fig. 3: Energy dispersive spectrum of spot 1 in Fig. 2. (beryl)
Table 1: Minor and trace elements in the specimen, in wt. %.
Minor and trace elements in wt. %
Element
wt. %
Caesium
0.05
Iron
0.35
Manganese
0.03
Sodium
0.84
Summary of findings: This specimen (Fig. 1) is beryl (Figs. 2 and 3). The minor and trace elements indicate typical iron, sodium and caesium content for aquamarine. There are abundant tiny inclusions present, they appear to be mica flakes. I could not detect evidence of heat treating, no ruptured fluid inclusions were noted. The specimens are interesting, my first impression was something like man-made glass but they are indeed crystalline.
A dendritic stone set in a ring, recorded as Mystery Stone 9 until its trade name is confirmed.
What the report found: The bulk of sample 1527 is granular quartz with hematite/goethite veining and dendrites, a thicker barite-bearing vein, minor titanium-bearing chlorite-group material, and kaolinite. The mounting tested as sterling silver.
The laboratory also used sample number 1527 on a different green teardrop report. These are distinct specimens and reports despite that duplicate number.
View the original report
Select a page to enlarge it. 5 pages; findings are summarized in accessible text above.
Use this guide alongside the written findings and the original report transcript. It explains the purpose of each analytical figure and preserves the laboratory’s own figure labels. The interpretations apply to the tested specimen; signals alone do not establish the identity of every similar-looking stone.
Electron microscope image: This view shows small-scale regions selected for analysis. Its brightness contrast helps distinguish regions with different compositions; it is not a photograph of their natural colors. Numbered spots connect this view to the analyses listed in the report.
Laboratory figure caption: Fig.2: Backscattered electron images of an area of the specimen in Fig. 1.
Elemental spectrum: The peaks record characteristic X-ray signals from elements in the analyzed spot or area. This is an analysis of that location, not automatically of the entire specimen. Any mineral identification or uncertainty named in the laboratory caption is retained below.
Laboratory figure caption: Fig. 3: Energy dispersive spectrum of spot 1 in Fig. 2. (hematite/goethite)
Elemental spectrum: The peaks record characteristic X-ray signals from elements in the analyzed spot or area. This is an analysis of that location, not automatically of the entire specimen. Any mineral identification or uncertainty named in the laboratory caption is retained below.
Laboratory figure caption: Fig. 4: Energy dispersive spectrum of spot 2 in Fig. 2. (barite)
Electron microscope image: This view shows small-scale regions selected for analysis. Its brightness contrast helps distinguish regions with different compositions; it is not a photograph of their natural colors. Numbered spots connect this view to the analyses listed in the report.
Laboratory figure caption: Fig. 5: Backscattered electron image of another area on the specimen shown in Fig. 1.
Elemental spectrum: The peaks record characteristic X-ray signals from elements in the analyzed spot or area. This is an analysis of that location, not automatically of the entire specimen. Any mineral identification or uncertainty named in the laboratory caption is retained below.
Laboratory figure caption: Fig. 6: Energy dispersive spectrum of spot 2 in Fig. 5. (quartz)
Elemental spectrum: The peaks record characteristic X-ray signals from elements in the analyzed spot or area. This is an analysis of that location, not automatically of the entire specimen. Any mineral identification or uncertainty named in the laboratory caption is retained below.
Laboratory figure caption: Fig. 7: Energy dispersive spectrum of spot 3 in Fig. 5. (titanium-rich chlorite group species)
Elemental spectrum: The peaks record characteristic X-ray signals from elements in the analyzed spot or area. This is an analysis of that location, not automatically of the entire specimen. Any mineral identification or uncertainty named in the laboratory caption is retained below.
Laboratory figure caption: Fig. 8: Energy dispersive spectrum of spot 4 in Fig. 5. (kaolinite)
Elemental spectrum: The peaks record characteristic X-ray signals from elements in the analyzed spot or area. This is an analysis of that location, not automatically of the entire specimen. Any mineral identification or uncertainty named in the laboratory caption is retained below.
Laboratory figure caption: Fig. 9: Energy dispersive spectrum of the mounting. (sterling silver)
Read the original laboratory report as text
The following text and tables are transcribed from the original laboratory document. Figure captions identify the report images; the laboratory interpretations and limitations are preserved.
Laboratory report 1
Analytical Result Report
Sample id: 1527 (#1 ring)
Submitted by: Soul Body Gems
Date completed: 10-14-2025
Operating conditions: An AMRAY 1830 SEM operated at 25 kV acceleration potential, 24 mm working distance, 0 degrees sample tilt, coated with 250 Å carbon, and also using the attached XRF unit operated at 30 kV.
Fig. 1: Photograph of the specimens. 3 cm maximum dimension.
Fig.2: Backscattered electron images of an area of the specimen in Fig. 1.
Fig. 3: Energy dispersive spectrum of spot 1 in Fig. 2. (hematite/goethite)
Fig. 4: Energy dispersive spectrum of spot 2 in Fig. 2. (barite)
Fig. 5: Backscattered electron image of another area on the specimen shown in Fig. 1.
Fig. 6: Energy dispersive spectrum of spot 2 in Fig. 5. (quartz)
Fig. 7: Energy dispersive spectrum of spot 3 in Fig. 5. (titanium-rich chlorite group species)
Fig. 8: Energy dispersive spectrum of spot 4 in Fig. 5. (kaolinite)
Fig. 9: Energy dispersive spectrum of the mounting. (sterling silver)
Summary of findings: This is an interesting stone (Fig.1). The veining and dendritic parts are largely iron-rich, mainly hematite/goethite (Figs. 2 and 3). In a thicker vein barite has been noted (Figs. 2 and 4). The bulk is granular quartz (Figs. 5 and 6), something like a well-cemented siltstone. Minor amounts of a titanium-bearing chlorite group species (Figs. 5 and 7) and kaolinite (Figs. 5 and 8) were also found. The mounting is sterling silver with 3.5 wt. % copper (Fig. ).
Green Golden Healer · August 2025 · main collection photograph. The report concerns a separately submitted green teardrop.
A Brazil-sourced green teardrop material sold as Green Golden Healer.
What the report found: The clear host in the separately submitted teardrop was confirmed as quartz by X-ray diffraction. Green areas contain iron and chlorine together. The researcher could not assign a definite mineral species to that green phase; it is not a green mica species because aluminum was lacking.
This lab document also prints sample 1527, the same number as a separate dendritic ring report. Specimen descriptions and findings distinguish the two. Brazil is Soul Body Gems sourcing information.
Use this guide alongside the written findings and the original report transcript. It explains the purpose of each analytical figure and preserves the laboratory’s own figure labels. The interpretations apply to the tested specimen; signals alone do not establish the identity of every similar-looking stone.
Electron microscope image: This view shows small-scale regions selected for analysis. Its brightness contrast helps distinguish regions with different compositions; it is not a photograph of their natural colors. Numbered spots connect this view to the analyses listed in the report.
Laboratory figure caption: Fig.2: Backscattered electron image of an area of the specimen shown in Fig. 1.
Elemental spectrum: The peaks record characteristic X-ray signals from elements in the analyzed spot or area. This is an analysis of that location, not automatically of the entire specimen. Any mineral identification or uncertainty named in the laboratory caption is retained below.
Laboratory figure caption: Fig. 3: Energy dispersive spectrum of spot 1 in Fig. 2. (some green iron compound, note chlorine is also present)
Elemental spectrum: The peaks record characteristic X-ray signals from elements in the analyzed spot or area. This is an analysis of that location, not automatically of the entire specimen. Any mineral identification or uncertainty named in the laboratory caption is retained below.
Laboratory figure caption: Fig. 4: Energy dispersive spectrum of spot 3 in Fig. 2. (quartz)
Element map: This map shows where the named elements occur within the analyzed area. Its colors represent the laboratory’s selected element channels, rather than the specimen’s visible colors. The caption below preserves any color key or distribution noted by the laboratory.
Laboratory figure caption: Fig. 5: X-ray map of the area shown in Fig. 2 (slightly higher magnification) for iron (green and chlorine yellow).
Diffraction scan: This scan helps identify crystalline minerals by comparing the measured pattern with reference patterns. The laboratory interpretation explains which minerals the comparison supports.
Laboratory figure caption: Fig. 6: X-ray diffraction scan of the clear material (quartz).
Read the original laboratory report as text
The following text and tables are transcribed from the original laboratory document. Figure captions identify the report images; the laboratory interpretations and limitations are preserved.
Laboratory report 1
Analytical Result Report
Sample id: 1527 (Golden Healer Green)
Submitted by: Soul Body Gems
Date completed: 10-14-2025
Operating conditions: An AMRAY 1830 SEM operated at 25 kV acceleration potential, 24 mm working distance, 0 degrees sample tilt, coated with 250 Å carbon, and also using the attached XRF unit operated at 30 kV.
A Bruker D2 Phaser was also used in the study and opperated under 35 kV and 10 mA.
Fig. 1: Photograph of the specimens. 1.3 cm maximum dimension.
Fig.2: Backscattered electron image of an area of the specimen shown in Fig. 1.
Fig. 3: Energy dispersive spectrum of spot 1 in Fig. 2. (some green iron compound, note chlorine is also present)
Fig. 4: Energy dispersive spectrum of spot 3 in Fig. 2. (quartz)
Fig. 5: X-ray map of the area shown in Fig. 2 (slightly higher magnification) for iron (green and chlorine yellow).
Fig. 6: X-ray diffraction scan of the clear material (quartz).
Summary of findings: This is an interesting stone (Fig.1). The green material is either an iron chloride compound (Figs. 2 and 3) but it may also have silicon part of the composition, I can’t tell as the beam is penetrating past the green portion. The colorless material is quartz (Figs. 2 and 4). It is not a green mica species as aluminum is lacking. An -ray map shows that iron and chlorine occur together (Fig. 5). An X-ray diffraction scan confirmed quartz (Fig. 6)
Green Golden Healer · August 2025 · main collection photograph. The report concerns a separately submitted green teardrop.
A Brazil-sourced green teardrop material sold as Green Golden Healer.
What the report found: The clear host in the separately submitted teardrop was confirmed as quartz by X-ray diffraction. Green areas contain iron and chlorine together. The researcher could not assign a definite mineral species to that green phase; it is not a green mica species because aluminum was lacking.
This lab document also prints sample 1527, the same number as a separate dendritic ring report. Specimen descriptions and findings distinguish the two. Brazil is Soul Body Gems sourcing information.
Use this guide alongside the written findings and the original report transcript. It explains the purpose of each analytical figure and preserves the laboratory’s own figure labels. The interpretations apply to the tested specimen; signals alone do not establish the identity of every similar-looking stone.
Electron microscope image: This view shows small-scale regions selected for analysis. Its brightness contrast helps distinguish regions with different compositions; it is not a photograph of their natural colors. Numbered spots connect this view to the analyses listed in the report.
Laboratory figure caption: Fig.2: Backscattered electron image of an area of the specimen shown in Fig. 1.
Elemental spectrum: The peaks record characteristic X-ray signals from elements in the analyzed spot or area. This is an analysis of that location, not automatically of the entire specimen. Any mineral identification or uncertainty named in the laboratory caption is retained below.
Laboratory figure caption: Fig. 3: Energy dispersive spectrum of spot 1 in Fig. 2. (some green iron compound, note chlorine is also present)
Elemental spectrum: The peaks record characteristic X-ray signals from elements in the analyzed spot or area. This is an analysis of that location, not automatically of the entire specimen. Any mineral identification or uncertainty named in the laboratory caption is retained below.
Laboratory figure caption: Fig. 4: Energy dispersive spectrum of spot 3 in Fig. 2. (quartz)
Element map: This map shows where the named elements occur within the analyzed area. Its colors represent the laboratory’s selected element channels, rather than the specimen’s visible colors. The caption below preserves any color key or distribution noted by the laboratory.
Laboratory figure caption: Fig. 5: X-ray map of the area shown in Fig. 2 (slightly higher magnification) for iron (green and chlorine yellow).
Diffraction scan: This scan helps identify crystalline minerals by comparing the measured pattern with reference patterns. The laboratory interpretation explains which minerals the comparison supports.
Laboratory figure caption: Fig. 6: X-ray diffraction scan of the clear material (quartz).
Read the original laboratory report as text
The following text and tables are transcribed from the original laboratory document. Figure captions identify the report images; the laboratory interpretations and limitations are preserved.
Laboratory report 1
Analytical Result Report
Sample id: 1527 (Golden Healer Green)
Submitted by: Soul Body Gems
Date completed: 10-14-2025
Operating conditions: An AMRAY 1830 SEM operated at 25 kV acceleration potential, 24 mm working distance, 0 degrees sample tilt, coated with 250 Å carbon, and also using the attached XRF unit operated at 30 kV.
A Bruker D2 Phaser was also used in the study and opperated under 35 kV and 10 mA.
Fig. 1: Photograph of the specimens. 1.3 cm maximum dimension.
Fig.2: Backscattered electron image of an area of the specimen shown in Fig. 1.
Fig. 3: Energy dispersive spectrum of spot 1 in Fig. 2. (some green iron compound, note chlorine is also present)
Fig. 4: Energy dispersive spectrum of spot 3 in Fig. 2. (quartz)
Fig. 5: X-ray map of the area shown in Fig. 2 (slightly higher magnification) for iron (green and chlorine yellow).
Fig. 6: X-ray diffraction scan of the clear material (quartz).
Summary of findings: This is an interesting stone (Fig.1). The green material is either an iron chloride compound (Figs. 2 and 3) but it may also have silicon part of the composition, I can’t tell as the beam is penetrating past the green portion. The colorless material is quartz (Figs. 2 and 4). It is not a green mica species as aluminum is lacking. An -ray map shows that iron and chlorine occur together (Fig. 5). An X-ray diffraction scan confirmed quartz (Fig. 6)
Additional Green Golden Healer collection photograph · August 2025. No test of this pictured piece is asserted.
A Chinese-sourced color-change fluorite set in a ring.
What the report found: Sample 1204 confirmed natural fluorite with trace rare-earth elements and a sterling-silver mounting. The reported color-change appearance is an observation of this piece; the analytical report does not separately measure that optical behavior.
China is Soul Body Gems provenance. Both directory names refer to this one tested ring.
Use this guide alongside the written findings and the original report transcript. It explains the purpose of each analytical figure and preserves the laboratory’s own figure labels. The interpretations apply to the tested specimen; signals alone do not establish the identity of every similar-looking stone.
Electron microscope image: This view shows small-scale regions selected for analysis. Its brightness contrast helps distinguish regions with different compositions; it is not a photograph of their natural colors. Numbered spots connect this view to the analyses listed in the report.
Laboratory figure caption: Fig.2: Backscattered electron image of an area of the specimen.
Elemental spectrum: The peaks record characteristic X-ray signals from elements in the analyzed spot or area. This is an analysis of that location, not automatically of the entire specimen. Any mineral identification or uncertainty named in the laboratory caption is retained below.
Laboratory figure caption: Fig. 3: Energy dispersive spectrum of spot 1 in Fig. 2. (fluorite)
Elemental spectrum: The peaks record characteristic X-ray signals from elements in the analyzed spot or area. This is an analysis of that location, not automatically of the entire specimen. Any mineral identification or uncertainty named in the laboratory caption is retained below.
Laboratory figure caption: Fig. 4: Energy dispersive spectrum of spot 2 in Fig. 2 (silver alloy).
Read the laboratory document as text
Text and tables from the laboratory document are provided below. Consult the adjacent findings for the interpretation of each tested specimen.
Laboratory document 1
Analytical Result Report
Sample id: 1204 (#3 ring with fluorite stone)
Submitted by: Soul Body Gems
Date completed: 1-10-2025
Operating conditions: An AMRAY 1830 SEM operated at 25 kV acceleration potential, 24 mm working distance, 0 degrees sample tilt, coated with 250 Å carbon, and also using the attached XRF unit operated at 30 kV.
Fig. 1: Photograph of the specimens. 3.3 cm maximum dimensions
Fig.2: Backscattered electron image of an area of the specimen.
Fig. 3: Energy dispersive spectrum of spot 1 in Fig. 2. (fluorite)
Fig. 4: Energy dispersive spectrum of spot 2 in Fig. 2 (silver alloy).
Summary of findings: This specimen (Fig. 1) is a pretty ring with a cut fluorite (Figs. 2 and 3. The fluorite contains some rare earth elements, in particular the heavy ones such as ytterbium, erbium as well as yttrium. These occur in the 0.2-0.4 wt. % range. Light rare earth elements such as cerium occur are slightly lower amounts, usually below 0.2 wt. %. This is typical for natural fluorite. The metal is sterling silver with about 95 % silver, the rest is copper and zinc.
Date: 1-10-2025 Signature
A Chinese-sourced color-change fluorite set in a ring.
What the report found: Sample 1204 confirmed natural fluorite with trace rare-earth elements and a sterling-silver mounting. The reported color-change appearance is an observation of this piece; the analytical report does not separately measure that optical behavior.
China is Soul Body Gems provenance. Both directory names refer to this one tested ring.
Use this guide alongside the written findings and the original report transcript. It explains the purpose of each analytical figure and preserves the laboratory’s own figure labels. The interpretations apply to the tested specimen; signals alone do not establish the identity of every similar-looking stone.
Electron microscope image: This view shows small-scale regions selected for analysis. Its brightness contrast helps distinguish regions with different compositions; it is not a photograph of their natural colors. Numbered spots connect this view to the analyses listed in the report.
Laboratory figure caption: Fig.2: Backscattered electron image of an area of the specimen.
Elemental spectrum: The peaks record characteristic X-ray signals from elements in the analyzed spot or area. This is an analysis of that location, not automatically of the entire specimen. Any mineral identification or uncertainty named in the laboratory caption is retained below.
Laboratory figure caption: Fig. 3: Energy dispersive spectrum of spot 1 in Fig. 2. (fluorite)
Elemental spectrum: The peaks record characteristic X-ray signals from elements in the analyzed spot or area. This is an analysis of that location, not automatically of the entire specimen. Any mineral identification or uncertainty named in the laboratory caption is retained below.
Laboratory figure caption: Fig. 4: Energy dispersive spectrum of spot 2 in Fig. 2 (silver alloy).
Read the laboratory document as text
Text and tables from the laboratory document are provided below. Consult the adjacent findings for the interpretation of each tested specimen.
Laboratory document 1
Analytical Result Report
Sample id: 1204 (#3 ring with fluorite stone)
Submitted by: Soul Body Gems
Date completed: 1-10-2025
Operating conditions: An AMRAY 1830 SEM operated at 25 kV acceleration potential, 24 mm working distance, 0 degrees sample tilt, coated with 250 Å carbon, and also using the attached XRF unit operated at 30 kV.
Fig. 1: Photograph of the specimens. 3.3 cm maximum dimensions
Fig.2: Backscattered electron image of an area of the specimen.
Fig. 3: Energy dispersive spectrum of spot 1 in Fig. 2. (fluorite)
Fig. 4: Energy dispersive spectrum of spot 2 in Fig. 2 (silver alloy).
Summary of findings: This specimen (Fig. 1) is a pretty ring with a cut fluorite (Figs. 2 and 3. The fluorite contains some rare earth elements, in particular the heavy ones such as ytterbium, erbium as well as yttrium. These occur in the 0.2-0.4 wt. % range. Light rare earth elements such as cerium occur are slightly lower amounts, usually below 0.2 wt. %. This is typical for natural fluorite. The metal is sterling silver with about 95 % silver, the rest is copper and zinc.
A pendant made with a material supplied to Soul Body Gems as a newer Neon Azurite find.
What the report found: Sample 1187 contains blue azurite and green malachite patches on a largely plagioclase matrix. The mounting is a high-silver sterling alloy.
The test identifies the submitted pendant's minerals; the find history is supplied sourcing information.
View the original report
Select a page to enlarge it. 4 pages; findings are summarized in accessible text above.
Use this guide alongside the written findings and the original report transcript. It explains the purpose of each analytical figure and preserves the laboratory’s own figure labels. The interpretations apply to the tested specimen; signals alone do not establish the identity of every similar-looking stone.
Electron microscope image: This view shows small-scale regions selected for analysis. Its brightness contrast helps distinguish regions with different compositions; it is not a photograph of their natural colors. Numbered spots connect this view to the analyses listed in the report.
Laboratory figure caption: Fig.2: Backscattered electron image of an area of the specimen.
Elemental spectrum: The peaks record characteristic X-ray signals from elements in the analyzed spot or area. This is an analysis of that location, not automatically of the entire specimen. Any mineral identification or uncertainty named in the laboratory caption is retained below.
Laboratory figure caption: Fig. 3: Energy dispersive spectrum of spot 1 in Fig. 2. (copper hydroxide carbonate)
Elemental spectrum: The peaks record characteristic X-ray signals from elements in the analyzed spot or area. This is an analysis of that location, not automatically of the entire specimen. Any mineral identification or uncertainty named in the laboratory caption is retained below.
Laboratory figure caption: Fig. 4: Energy dispersive spectrum of spot 2 in Fig. 2. (copper hydroxide carbonate).
Elemental spectrum: The peaks record characteristic X-ray signals from elements in the analyzed spot or area. This is an analysis of that location, not automatically of the entire specimen. Any mineral identification or uncertainty named in the laboratory caption is retained below.
Laboratory figure caption: Fig. 5: Energy dispersive spectrum of spot 4 in Fig. 2 right. (plagioclase).
Electron microscope image: This view shows small-scale regions selected for analysis. Its brightness contrast helps distinguish regions with different compositions; it is not a photograph of their natural colors. Numbered spots connect this view to the analyses listed in the report.
Laboratory figure caption: Fig.6: Backscattered electron image of another area of the specimen.
Elemental spectrum: The peaks record characteristic X-ray signals from elements in the analyzed spot or area. This is an analysis of that location, not automatically of the entire specimen. Any mineral identification or uncertainty named in the laboratory caption is retained below.
Laboratory figure caption: Fig. 7: Energy dispersive spectrum of spot 1 in Fig. 6 right. (silver copper alloy).
Element map: This map shows where the named elements occur within the analyzed area. Its colors represent the laboratory’s selected element channels, rather than the specimen’s visible colors. The caption below preserves any color key or distribution noted by the laboratory.
Laboratory figure caption: Fig. 8: X-ray map of the area shown in Fig. 2. Red: silicon, blue: copper, green: iron.
Read the laboratory document as text
Text and tables from the laboratory document are provided below. Consult the adjacent findings for the interpretation of each tested specimen.
Laboratory document 1
                                                Analytical Result Report

Sample id: 1187 (2 neon azurite #5)
Submitted by: Soul Body Gems
Date completed: 12-6-2024
Operating conditions: An AMRAY 1830 SEM operated at 25 kV acceleration potential, 24 mm working distance, 0
degrees sample tilt, coated with 250 Å carbon, and also using the attached XRF unit operated at 30 kV.


Fig. 1: Photograph of the specimen. 4 cm maximum dimensions


Fig.2: Backscattered electron image of an area of the specimen.
Fig. 3: Energy dispersive spectrum of spot 1 in Fig. 2. (copper hydroxide carbonate)


Fig. 4: Energy dispersive spectrum of spot 2 in Fig. 2. (copper hydroxide carbonate).
Fig. 5: Energy dispersive spectrum of spot 4 in Fig. 2 right. (plagioclase).


Fig.6: Backscattered electron image of another area of the specimen.
Fig. 7: Energy dispersive spectrum of spot 1 in Fig. 6 right. (silver copper alloy).


Fig. 8: X-ray map of the area shown in Fig. 2. Red: silicon, blue: copper, green: iron.


Summary of findings: This specimens (Fig. 1) is pretty. The green patches (Fig. 1) are malachite (Figs. 2, 3 and 8). The
blue patches (Fig. 1) are azurite (Figs. 2, 4 and 8). Both are copper hydroxide (hydroxyl) carbonates. The brownish
matrix is mainly plagioclase (Figs. 2 and 5). The X-ray map shows the elemental distribution well (Fig. 8). The mounting is
a high silver sterling silver (97 % silver, 3 % copper).


Date:  12-6-2024            Signature
An India-sourced jaspilite material set in a pendant.
What the report found: Sample 1144 is fine-grained quartz rich in iron oxide, mainly hematite. Later quartz veins contain less iron. The mounting tested as sterling silver.
India and the newer-find history are Soul Body Gems sourcing details rather than a laboratory determination of origin.
View the original report
Select a page to enlarge it. 3 pages; findings are summarized in accessible text above.
Use this guide alongside the written findings and the original report transcript. It explains the purpose of each analytical figure and preserves the laboratory’s own figure labels. The interpretations apply to the tested specimen; signals alone do not establish the identity of every similar-looking stone.
Electron microscope image: This view shows small-scale regions selected for analysis. Its brightness contrast helps distinguish regions with different compositions; it is not a photograph of their natural colors. Numbered spots connect this view to the analyses listed in the report.
Laboratory figure caption: Fig.2: Backscattered electron image of an area of the specimen.
Elemental spectrum: The peaks record characteristic X-ray signals from elements in the analyzed spot or area. This is an analysis of that location, not automatically of the entire specimen. Any mineral identification or uncertainty named in the laboratory caption is retained below.
Laboratory figure caption: Fig. 3: Energy dispersive spectrum of spot 1 in Fig. 2. (mainly iron oxide in quartz matrix)
Elemental spectrum: The peaks record characteristic X-ray signals from elements in the analyzed spot or area. This is an analysis of that location, not automatically of the entire specimen. Any mineral identification or uncertainty named in the laboratory caption is retained below.
Laboratory figure caption: Fig. 4: Energy dispersive spectrum of spot 2 in Fig. 2. (quartz with some iron oxides)
Elemental spectrum: The peaks record characteristic X-ray signals from elements in the analyzed spot or area. This is an analysis of that location, not automatically of the entire specimen. Any mineral identification or uncertainty named in the laboratory caption is retained below.
Laboratory figure caption: Fig. 5: Energy dispersive spectrum of spot 3 in Fig. 2. (quartz veining, essentially iron-free)
Elemental spectrum: The peaks record characteristic X-ray signals from elements in the analyzed spot or area. This is an analysis of that location, not automatically of the entire specimen. Any mineral identification or uncertainty named in the laboratory caption is retained below.
Laboratory figure caption: Fig. 6: Energy dispersive spectrum of the mounting in Fig. 2. (high-silver sterling silver alloy)
Read the laboratory document as text
Text and tables from the laboratory document are provided below. Consult the adjacent findings for the interpretation of each tested specimen.
Laboratory document 1
Analytical Result Report
Sample id: 1144 (#2 pendant, jaspilite)
Submitted by: Soul Body Gems
Date completed: 3-24-2025
Operating conditions: An AMRAY 1830 SEM operated at 25 kV acceleration potential, 24 mm working distance, 0 degrees sample tilt, coated with 250 Å carbon, and also using the attached XRF unit operated at 30 kV.
Photograph of the specimen. Approximately 4.5 cm maximum dimension,
Fig.2: Backscattered electron image of an area of the specimen.
Fig. 3: Energy dispersive spectrum of spot 1 in Fig. 2. (mainly iron oxide in quartz matrix)
Fig. 4: Energy dispersive spectrum of spot 2 in Fig. 2. (quartz with some iron oxides)
Fig. 5: Energy dispersive spectrum of spot 3 in Fig. 2. (quartz veining, essentially iron-free)
Fig. 6: Energy dispersive spectrum of the mounting in Fig. 2. (high-silver sterling silver alloy)
Summary of findings: This specimen (Fig. 1) is a pretty pendant. The sone is jasper/jaspilite which is an iron-oxide-rich fine-grained quartz. The iron oxide (hematite mainly) varies across the stone (Figs. 2-5) with the lowest content in the late quartz veins which are essentially just quartz. The mounting is sterling silver with 97% silver and the rest copper and zinc (Figs. 2 and 6).
Date: 3-24-2025 Signature
A pendant previously described as kämmererite, retained here as Mystery Stone 10.
What the report found: Sample 1146 is not kämmererite. The laboratory found a high-aluminum silicate it could not assign to a matching mineral species, plus some titanium-oxide grains, probably rutile. The mounting is sterling silver.
No definite species name is claimed for the stone. This is distinct from Mystery Stone 9 and from genuine kämmererite material.
View the original report
Select a page to enlarge it. 3 pages; findings are summarized in accessible text above.
Use this guide alongside the written findings and the original report transcript. It explains the purpose of each analytical figure and preserves the laboratory’s own figure labels. The interpretations apply to the tested specimen; signals alone do not establish the identity of every similar-looking stone.
Electron microscope image: This view shows small-scale regions selected for analysis. Its brightness contrast helps distinguish regions with different compositions; it is not a photograph of their natural colors. Numbered spots connect this view to the analyses listed in the report.
Laboratory figure caption: Fig.2: Backscattered electron image of an area of the specimen.
Elemental spectrum: The peaks record characteristic X-ray signals from elements in the analyzed spot or area. This is an analysis of that location, not automatically of the entire specimen. Any mineral identification or uncertainty named in the laboratory caption is retained below.
Laboratory figure caption: Fig. 3: Energy dispersive spectrum of spot 1 in Fig. 2. (aluminum silicate)
Elemental spectrum: The peaks record characteristic X-ray signals from elements in the analyzed spot or area. This is an analysis of that location, not automatically of the entire specimen. Any mineral identification or uncertainty named in the laboratory caption is retained below.
Laboratory figure caption: Fig. 4: Energy dispersive spectrum of spot 3 in Fig. 2. (titanium oxide species)
Elemental spectrum: The peaks record characteristic X-ray signals from elements in the analyzed spot or area. This is an analysis of that location, not automatically of the entire specimen. Any mineral identification or uncertainty named in the laboratory caption is retained below.
Laboratory figure caption: Fig. 5: Energy dispersive spectrum of the mounting in Fig. 2. (high-silver sterling silver alloy)
Read the original laboratory report as text
The following text and tables are transcribed from the original laboratory document. Figure captions identify the report images; the laboratory interpretations and limitations are preserved.
Laboratory report 1
Analytical Result Report
Sample id: 1146 (#1 pendant, kaemmererite)
Submitted by: Soul Body Gems
Date completed: 3-24-2025
Operating conditions: An AMRAY 1830 SEM operated at 25 kV acceleration potential, 24 mm working distance, 0 degrees sample tilt, coated with 250 Å carbon, and also using the attached XRF unit operated at 30 kV.
Photograph of the specimen. Approximately 4.5 cm maximum dimension,
Fig.2: Backscattered electron image of an area of the specimen.
Fig. 3: Energy dispersive spectrum of spot 1 in Fig. 2. (aluminum silicate)
Fig. 4: Energy dispersive spectrum of spot 3 in Fig. 2. (titanium oxide species)
Fig. 5: Energy dispersive spectrum of the mounting in Fig. 2. (high-silver sterling silver alloy)
Summary of findings: This specimen (Fig. 1) is not kaemmererite nor is there any kaemmererite present in it. The stone is essentially a high-aluminum silicate but so far, I have not been able to find a species that is matching. Some grains of a titanium oxide, probably rutile have been identified (Figs. 2 and 4). The mounting is sterling silver with 97% silver and the rest copper and zinc (Figs. 2 and 6).
Date: 3-24-2025 Signature
Two Soul Body Gems specimens were tested: a raw specimen and a pendant cabochon. Both reports are collected here, with each specimen’s findings shown separately.
Raw specimen — sample 10471
Finding: Sample 10471, completed January 16, 2024, has blue crystals whose measured composition is consistent with afghanite. Pyrite and diopside were also identified in the examined specimen.
View the original report
Select a page to enlarge it. 4 pages; the findings are summarized in accessible text above.
What the report found: Sample 1122 contains both afghanite and lazurite, with associated diopside and phlogopite. X-ray diffraction confirmed afghanite. The mounting tested as sterling silver.
This identification applies to this cabochon; the two blue phases cannot reliably be distinguished by appearance alone.
View the original report
Select a page to enlarge it. 6 pages; findings are summarized in accessible text above.
Use this guide alongside the written findings and the original report transcript. It explains the purpose of each analytical figure and preserves the laboratory’s own figure labels. The interpretations apply to the tested specimen; signals alone do not establish the identity of every similar-looking stone.
Electron microscope image: This view shows small-scale regions selected for analysis. Its brightness contrast helps distinguish regions with different compositions; it is not a photograph of their natural colors. Numbered spots connect this view to the analyses listed in the report.
Laboratory figure caption: Fig.2: Backscattered electron image of an area of the specimen.
Elemental spectrum: The peaks record characteristic X-ray signals from elements in the analyzed spot or area. This is an analysis of that location, not automatically of the entire specimen. Any mineral identification or uncertainty named in the laboratory caption is retained below.
Laboratory figure caption: Fig. 3: Energy dispersive spectrum of spot 1 in Fig. 2. (likely lazurite)
Elemental spectrum: The peaks record characteristic X-ray signals from elements in the analyzed spot or area. This is an analysis of that location, not automatically of the entire specimen. Any mineral identification or uncertainty named in the laboratory caption is retained below.
Laboratory figure caption: Fig. 4: Energy dispersive spectrum of spot 2 in Fig. 2. (afghanite)
Elemental spectrum: The peaks record characteristic X-ray signals from elements in the analyzed spot or area. This is an analysis of that location, not automatically of the entire specimen. Any mineral identification or uncertainty named in the laboratory caption is retained below.
Laboratory figure caption: Fig. 5: Energy dispersive spectrum of spot 3 in Fig. 2. (diopside)
Elemental spectrum: The peaks record characteristic X-ray signals from elements in the analyzed spot or area. This is an analysis of that location, not automatically of the entire specimen. Any mineral identification or uncertainty named in the laboratory caption is retained below.
Laboratory figure caption: Fig. 6: Energy dispersive spectrum of spot 4 in Fig. 2. (phlogopite)
Electron microscope image: This view shows small-scale regions selected for analysis. Its brightness contrast helps distinguish regions with different compositions; it is not a photograph of their natural colors. Numbered spots connect this view to the analyses listed in the report.
Laboratory figure caption: Fig.7: Backscattered electron image of another area of the specimen.
Elemental spectrum: The peaks record characteristic X-ray signals from elements in the analyzed spot or area. This is an analysis of that location, not automatically of the entire specimen. Any mineral identification or uncertainty named in the laboratory caption is retained below.
Laboratory figure caption: Fig. 8: Energy dispersive spectrum of spot 1 in Fig. 7. (silver alloy)
Diffraction scan: This scan helps identify crystalline minerals by comparing the measured pattern with reference patterns. The laboratory interpretation explains which minerals the comparison supports.
Laboratory figure caption: Fig. 9: X-ray diffraction scan of the blue material with mmatch for afghanite.
Elemental spectrum: The peaks record characteristic X-ray signals from elements in the analyzed spot or area. This is an analysis of that location, not automatically of the entire specimen. Any mineral identification or uncertainty named in the laboratory caption is retained below.
Laboratory figure caption: Fig. 3: Energy dispersive spectrum of spot 1 in Fig. 2 (consistent with afghanite)
Electron microscope image: This view shows small-scale regions selected for analysis. Its brightness contrast helps distinguish regions with different compositions; it is not a photograph of their natural colors. Numbered spots connect this view to the analyses listed in the report.
Laboratory figure caption: Fig.4: Backscattered electron image of another area of the specimen.
Elemental spectrum: The peaks record characteristic X-ray signals from elements in the analyzed spot or area. This is an analysis of that location, not automatically of the entire specimen. Any mineral identification or uncertainty named in the laboratory caption is retained below.
Laboratory figure caption: Fig. 5: Energy dispersive spectrum of spot 1 in Fig. 4 (pyrite)
Elemental spectrum: The peaks record characteristic X-ray signals from elements in the analyzed spot or area. This is an analysis of that location, not automatically of the entire specimen. Any mineral identification or uncertainty named in the laboratory caption is retained below.
Laboratory figure caption: Fig. 6: Energy dispersive spectrum of spot 4 in Fig. 4 (pyribole, diopside has been reported with afghanite)
Read the laboratory document as text
Text and tables from the laboratory document are provided below. Consult the adjacent findings for the interpretation of each tested specimen.
Laboratory document 1
                                                Analytical Result Report

Sample id: 10471 (#9)
Submitted by: Soul Body Gems
Date completed: 1-16-2024
Operating conditions: An AMRAY 1830 SEM operated at 25 kV acceleration potential, 24 mm working distance, 0
degrees sample tilt, coated with 250 Å carbon, and also using the attached XRF unit operated at 30 kV.

A BRUKER Titan X-ray fluorescence spectrometer was also used and operated for 30 seconds at 50, 25, and 10 kV.


Fig. 1: Photograph of the specimen. Approximately 10 cm maximum dimension.


Fig.2: Backscattered electron image of an area of the specimen.
Fig. 3: Energy dispersive spectrum of spot 1 in Fig. 2 (consistent with afghanite)


Fig.4: Backscattered electron image of another area of the specimen.
Fig. 5: Energy dispersive spectrum of spot 1 in Fig. 4 (pyrite)


Fig. 6: Energy dispersive spectrum of spot 4 in Fig. 4 (pyribole, diopside has been reported with afghanite)


Summary of findings: This specimen (Fig. 1) is very interesting. The blue crystals are indeed consistent with afghanite’s
composition (Figs. 2 and 3). In addition, pyrite (Figs. 4 and 5) and diopside (Figs. 4 and 6) were identified. Afghanite is a
rare species and this is a rather nice specimen.
Date:  January 17. 2024            Signature
Laboratory document 2
Analytical Result Report
Sample id: 1122 (#7 afghanite)
Submitted by: Soul Body Gems
Date completed: 2-11-2025
Operating conditions: An AMRAY 1830 SEM operated at 25 kV acceleration potential, 24 mm working distance, 0 degrees sample tilt, coated with 250 Å carbon, and also using the attached XRF unit operated at 30 kV.
A Bruker P2 Phaser X-ray diffractometer was also used and operated at 30 kV and 10 mA.
Fig. 1: Photograph of the specimen. Approximately 3.5 cm across.
Fig.2: Backscattered electron image of an area of the specimen.
Fig. 3: Energy dispersive spectrum of spot 1 in Fig. 2. (likely lazurite)
Fig. 4: Energy dispersive spectrum of spot 2 in Fig. 2. (afghanite)
Fig. 5: Energy dispersive spectrum of spot 3 in Fig. 2. (diopside)
Fig. 6: Energy dispersive spectrum of spot 4 in Fig. 2. (phlogopite)
Fig.7: Backscattered electron image of another area of the specimen.
Fig. 8: Energy dispersive spectrum of spot 1 in Fig. 7. (silver alloy)
Fig. 9: X-ray diffraction scan of the blue material with mmatch for afghanite.
Summary of findings: This specimen (Fig. 1) is pretty. The cabochon is composed of two blue minerals: lazurite (Figs. 2 and 3) and afghanite (Figs. 2 and 4). Visually, they are not distinguishable. Chloride and sulfur are the distinguishing elements). Associated minerals found include diopside (Figs. 2 and 5) and phlogopite (Figs. 2 and 6). The metal mounting is sterling silver with about 96 % silver (Figs. 7 and 8). Afghanite was also confirmed by X-ray diffraction (Fig. 9).
Date: 2-11-2025 Signature
An Africa-sourced smoky-colored quartz set in a pendant and sold as Whisky Quartz.
What the report found: Sample 10475 tested as quartz; the mounting is a sterling-silver alloy of approximately 95% silver and 5% copper.
“Whisky Quartz” is a trade name describing this material. Africa is Soul Body Gems sourcing information, not a geographic conclusion of the report.
View the original report
Select a page to enlarge it. 3 pages; findings are summarized in accessible text above.
Use this guide alongside the written findings and the original report transcript. It explains the purpose of each analytical figure and preserves the laboratory’s own figure labels. The interpretations apply to the tested specimen; signals alone do not establish the identity of every similar-looking stone.
Electron microscope image: This view shows small-scale regions selected for analysis. Its brightness contrast helps distinguish regions with different compositions; it is not a photograph of their natural colors. Numbered spots connect this view to the analyses listed in the report.
Laboratory figure caption: Fig.2: Backscattered electron image of an area of the specimen.
Elemental spectrum: The peaks record characteristic X-ray signals from elements in the analyzed spot or area. This is an analysis of that location, not automatically of the entire specimen. Any mineral identification or uncertainty named in the laboratory caption is retained below.
Laboratory figure caption: Fig. 3: Energy dispersive spectrum of spot 1 in Fig. 2 (quartz)
Elemental spectrum: The peaks record characteristic X-ray signals from elements in the analyzed spot or area. This is an analysis of that location, not automatically of the entire specimen. Any mineral identification or uncertainty named in the laboratory caption is retained below.
Laboratory figure caption: Fig. 4: Energy dispersive spectrum of spot 2 in Fig. 2 (silver copper alloy such as Sterlling silver.)
Read the original laboratory report as text
The following text and tables are transcribed from the original laboratory document. Figure captions identify the report images; the laboratory interpretations and limitations are preserved.
Laboratory report 1
Analytical Result Report
Sample id: 10475 (#2)
Submitted by: Soul Body Gems
Date completed: 1-18-2024
Operating conditions: An AMRAY 1830 SEM operated at 25 kV acceleration potential, 24 mm working distance, 0 degrees sample tilt, coated with 250 Å carbon, and also using the attached XRF unit operated at 30 kV.
A BRUKER Titan X-ray fluorescence spectrometer was also used and operated for 30 seconds at 50, 25, and 10 kV.
Fig. 1: Photograph of the specimen.
Fig.2: Backscattered electron image of an area of the specimen.
Fig. 3: Energy dispersive spectrum of spot 1 in Fig. 2 (quartz)
Fig. 4: Energy dispersive spectrum of spot 2 in Fig. 2 (silver copper alloy such as Sterlling silver.)
Summary of findings: This specimen (Fig. 1) is a nice pendant with a smoky colored quartz stone (Figs. 2 and 3) and the metal is what would fall into the type referred to as Sterling silver, this specimen consists to about 95% of silver and 5% copper.
Santa Maria Aquamarine · Soul Body Gems, December 2024.
A Brazil-sourced Santa Maria Aquamarine cut stone set in jewelry.
What the report found: Sample 1119 tested as beryl. The lab observed sodium enrichment and detectable cesium in the tested material; the mounting is sterling silver.
Santa Maria is the supplied trade description, and Brazil is Soul Body Gems provenance. The laboratory report identifies the submitted stone but does not independently certify a geographic source or a formal color grade.
View the original report
Select a page to enlarge it. 2 pages; findings are summarized in accessible text above.
Use this guide alongside the written findings and the original report transcript. It explains the purpose of each analytical figure and preserves the laboratory’s own figure labels. The interpretations apply to the tested specimen; signals alone do not establish the identity of every similar-looking stone.
Electron microscope image: This view shows small-scale regions selected for analysis. Its brightness contrast helps distinguish regions with different compositions; it is not a photograph of their natural colors. Numbered spots connect this view to the analyses listed in the report.
Laboratory figure caption: Fig.2: Backscattered electron image of an area of the specimen.
Elemental spectrum: The peaks record characteristic X-ray signals from elements in the analyzed spot or area. This is an analysis of that location, not automatically of the entire specimen. Any mineral identification or uncertainty named in the laboratory caption is retained below.
Laboratory figure caption: Fig. 3: Energy dispersive spectrum of spot 1 in Fig. 2. (beryl)
Read the laboratory document as text
Text and tables from the laboratory document are provided below. Consult the adjacent findings for the interpretation of each tested specimen.
Laboratory document 1
Analytical Result Report
Sample id: 1119 (#2, santa maria aquamarine)
Submitted by: Soul Body Gems
Date completed: 1-29-2025
Operating conditions: An AMRAY 1830 SEM operated at 25 kV acceleration potential, 24 mm working distance, 0 degrees sample tilt, coated with 250 Å carbon, and also using the attached XRF unit operated at 30 kV.
A Bruker D2 Phaser X-ray diffractometer was also used in the study and operated at 30 kV and 10 mA.
Photograph of the specimen. Approximately 1.6 cm across.
Fig.2: Backscattered electron image of an area of the specimen.
Fig. 3: Energy dispersive spectrum of spot 1 in Fig. 2. (beryl)
Summary of findings: This specimen (Fig. 1) is nice. The cut stone is a beryl (Figs. 2 and 3), it is from a moderately evolved pegmatite, sodium is noticeably enriched, and cesium is detectable. Some magnesium is also present which is more typical for lesser evolved pegmatites, it appears to be right in the middle of more evolved and less evolved, this is common fo4r many aquamarine sources. The mounting is sterling silver with 95 % silver, the rest copper and zinc.
A quartz specimen sold as “Lithium Quartz” was examined to see what its red bands and associated material contain.
Tested specimen: 1500 (#6) · Report completed: June 10, 2025
Key finding: The report identifies quartz, reddish iron-oxide or iron-hydroxide deposits typical of hematite or goethite, albite or altered albite, and a likely kaolinite area. Its conclusion: “No lithium mineralization was noted.”
What the name does—and does not—show
“Lithium Quartz” is the name under which this material was sold. In this tested specimen, the red color was attributed to iron-bearing deposits just below the surface, and no lithium-bearing mineral was identified. This is a finding about this specimen, rather than every quartz sold under that name.
The analytical methods described in the report do not quantify trace elemental lithium in the quartz. The report therefore does not support a claim that the specimen contains zero lithium; it says no lithium mineralization was noted.
View the original test results
Select any report page to enlarge it. The images preserve the laboratory’s figures and wording.
Analytical report for Soul Body Gems specimen 1500. Identification applies to the specimen tested. Report images are property of Soul Body Gems, Alexander Falster, and the Maine Mineral & Gem Museum; please acknowledge all three when referring to these results.
Understanding the report figures
Use this guide alongside the written findings and the original report transcript. It explains the purpose of each analytical figure and preserves the laboratory’s own figure labels. The interpretations apply to the tested specimen; signals alone do not establish the identity of every similar-looking stone.
Electron microscope image: This view shows small-scale regions selected for analysis. Its brightness contrast helps distinguish regions with different compositions; it is not a photograph of their natural colors. Numbered spots connect this view to the analyses listed in the report.
Laboratory figure caption: Fig.2: Backscattered electron image of an area of the specimen in Fig. 1.
Elemental spectrum: The peaks record characteristic X-ray signals from elements in the analyzed spot or area. This is an analysis of that location, not automatically of the entire specimen. Any mineral identification or uncertainty named in the laboratory caption is retained below.
Laboratory figure caption: Fig. 3: Energy dispersive spectrum of spot 1 in Fig. 2. (hematite/goethite)
Electron microscope image: This view shows small-scale regions selected for analysis. Its brightness contrast helps distinguish regions with different compositions; it is not a photograph of their natural colors. Numbered spots connect this view to the analyses listed in the report.
Laboratory figure caption: Fig. 4: Backscattered electron image of another area of the specimen in Fig. 1.
Elemental spectrum: The peaks record characteristic X-ray signals from elements in the analyzed spot or area. This is an analysis of that location, not automatically of the entire specimen. Any mineral identification or uncertainty named in the laboratory caption is retained below.
Laboratory figure caption: Fig. 5: Energy dispersive spectrum of spot 1 in Fig. 4 (albite, potassium-rich, likely altered and chloride ions probably absorbed onto it).
Elemental spectrum: The peaks record characteristic X-ray signals from elements in the analyzed spot or area. This is an analysis of that location, not automatically of the entire specimen. Any mineral identification or uncertainty named in the laboratory caption is retained below.
Laboratory figure caption: Fig. 6: Energy dispersive spectrum of the main area in Fig. 4 (quartz).
Electron microscope image: This view shows small-scale regions selected for analysis. Its brightness contrast helps distinguish regions with different compositions; it is not a photograph of their natural colors. Numbered spots connect this view to the analyses listed in the report.
Laboratory figure caption: Fig. 7: Backscattered electron image of another area of the specimen in Fig. 1.
Elemental spectrum: The peaks record characteristic X-ray signals from elements in the analyzed spot or area. This is an analysis of that location, not automatically of the entire specimen. Any mineral identification or uncertainty named in the laboratory caption is retained below.
Laboratory figure caption: Fig. 8: Energy dispersive spectrum of spot 1 in Fig. 7 (kaolinite likely).
Read the report findings as text
Sample 1500 (#6), submitted by Soul Body Gems, completed June 10, 2025. Figure 1 photographs the specimen, approximately 5.5 cm at its maximum dimension, and two close-ups. Figures 2 and 4 show backscattered electron images. Figure 3 shows analysis of a hematite or goethite area. Figure 5 shows potassium-rich albite or altered albite, with chloride likely absorbed on an altered surface. Figure 6 identifies quartz. Figures 7 and 8 show a further area with likely kaolinite.
The summary describes a reddish band deposited late in crystallization, beneath the surface of most specimens. The red color is typical of trivalent iron, such as hematite, with goethite possible in ochre areas. Albite or altered albite was found. Surface alteration may explain the chloride, and kaolinite appears likely in one area. No lithium mineralization was noted.
Read the original laboratory report as text
The following text and tables are transcribed from the original laboratory document. Figure captions identify the report images; the laboratory interpretations and limitations are preserved.
Laboratory report 1
Analytical Result Report
Sample id: 1500 (#6)
Submitted by: Soul Body Gems
Date completed: 6-10-2025
Operating conditions: An AMRAY 1830 SEM operated at 25 kV acceleration potential, 24 mm working distance, 0 degrees sample tilt, coated with 250 Å carbon, and also using the attached XRF unit operated at 30 kV.
Fig. 1: Photograph of the specimens. 5.5 cm maximum dimension. On the right, 2 close-ups.
Fig.2: Backscattered electron image of an area of the specimen in Fig. 1.
Fig. 3: Energy dispersive spectrum of spot 1 in Fig. 2. (hematite/goethite)
Fig. 4: Backscattered electron image of another area of the specimen in Fig. 1.
Fig. 5: Energy dispersive spectrum of spot 1 in Fig. 4 (albite, potassium-rich, likely altered and chloride ions probably absorbed onto it).
Fig. 6: Energy dispersive spectrum of the main area in Fig. 4 (quartz).
Fig. 7: Backscattered electron image of another area of the specimen in Fig. 1.
Fig. 8: Energy dispersive spectrum of spot 1 in Fig. 7 (kaolinite likely).
Summary of findings: These are interesting specimens (Fig. 1). Most show late in the crystallization history a band of reddish deposits just below the surface. The color is typical for trivalent iron such as hematite or goethite in more ochre-colored spots (Figs. 2 and 3). Albite or altered albite was also found (Figs. 5 and 6), the presence of chloride is likely due to absorption on surfaces that have undergone some alteration. In one case, kaolinite appears to e present (Figs. 7 and 8). No lithium mineralization was noted.
Date: 6-10-2025 Signature
The tested Gobi Agate specimen is chalcedony, with visible layering and pink color attributed mainly to a little trivalent iron, likely tiny hematite inclusions.
Key finding: The report identifies quartz in the analyzed spots and concludes that this specimen is chalcedony. Its layered texture is visible in the sample and electron images.
What the report means
The researcher discusses several possible origins for the tubular or branch-like form, including replacement of plant material, filling of burrows, or filling of tubes in volcanic rock. The report does not establish which occurred. “Gobi Agate” is the market name; the tested material is chalcedony.
View the original test results
Select any page to enlarge the full laboratory report.
These results apply to the specimen tested. Report images are property of Soul Body Gems, Alexander Falster, and the Maine Mineral & Gem Museum; please acknowledge all three when referring to these results.
Understanding the report figures
Use this guide alongside the written findings and the original report transcript. It explains the purpose of each analytical figure and preserves the laboratory’s own figure labels. The interpretations apply to the tested specimen; signals alone do not establish the identity of every similar-looking stone.
Electron microscope image: This view shows small-scale regions selected for analysis. Its brightness contrast helps distinguish regions with different compositions; it is not a photograph of their natural colors. Numbered spots connect this view to the analyses listed in the report.
Laboratory figure caption: Fig.2: Backscattered electron image of an area of the specimen.
Elemental spectrum: The peaks record characteristic X-ray signals from elements in the analyzed spot or area. This is an analysis of that location, not automatically of the entire specimen. Any mineral identification or uncertainty named in the laboratory caption is retained below.
Laboratory figure caption: Fig. 3: Energy dispersive spectrum of spot 1 in Fig. 2. (quartz)
Elemental spectrum: The peaks record characteristic X-ray signals from elements in the analyzed spot or area. This is an analysis of that location, not automatically of the entire specimen. Any mineral identification or uncertainty named in the laboratory caption is retained below.
Laboratory figure caption: Fig. 4: Energy dispersive spectrum of spot 2 in Fig. 2. (quartz)
Read the report findings as text
Sample 1206 (#5 Gobi stone), completed December 22, 2024. Figure 1 photographs a specimen with maximum dimension 6 cm. Figure 2 is a backscattered electron image; Figures 3 and 4 are energy-dispersive spectra of quartz. The summary identifies chalcedony, notes its layering, and attributes the pink color mainly to minor trivalent iron, likely tiny hematite inclusions. Several origins for its shape are presented as possibilities.
Read the original laboratory report as text
The following text and tables are transcribed from the original laboratory document. Figure captions identify the report images; the laboratory interpretations and limitations are preserved.
Laboratory report 1
Analytical Result Report
Sample id: 1206 (#5 Gobi stone)
Submitted by: Soul Body Gems
Date completed: 12-22-2024
Operating conditions: An AMRAY 1830 SEM operated at 25 kV acceleration potential, 24 mm working distance, 0 degrees sample tilt, coated with 250 Å carbon, and also using the attached XRF unit operated at 30 kV.
Fig. 1: Photograph of the specimens. 6cm maximum dimensions.
Fig.2: Backscattered electron image of an area of the specimen.
Fig. 3: Energy dispersive spectrum of spot 1 in Fig. 2. (quartz)
Fig. 4: Energy dispersive spectrum of spot 2 in Fig. 2. (quartz)
Summary of findings: This specimen (Fig. 1) is chalcedony (Figs. 2-4). The pink color is mainly caused by a small amount of iron, in the trivalent state, likely as hematite in form of tiny inclusions. The material clearly shows some layering (Figs. 1 and 2). It is possible that this is a replacement of plant matter, twigs or branches but it could also have formed as a filling material of burrows or fill of tubes in volcanic rock.
Date: 12-22-2024 Signature
The bulk of this sphere is natural sodalite and cancrinite: deep blue and yellow-orange minerals identified in the tested body of the material.
Key finding: The laboratory identified sodalite and cancrinite as the principal minerals. They can occur in rare silica-undersaturated alkaline rocks such as nepheline syenite. The report explicitly calls the bulk material natural.
What the report means
Some holes were filled with resin and crushed material. The fill includes minerals that can occur with sodalite and cancrinite, but it also contains quartz, which the researcher found troubling in that association. That observation concerns the later infilling; it does not overturn the natural bulk identification.
View the original test results
Select any page to enlarge the full laboratory report.
These results apply to the specimen tested. Report images are property of Soul Body Gems, Alexander Falster, and the Maine Mineral & Gem Museum; please acknowledge all three when referring to these results.
Understanding the report figures
Use this guide alongside the written findings and the original report transcript. It explains the purpose of each analytical figure and preserves the laboratory’s own figure labels. The interpretations apply to the tested specimen; signals alone do not establish the identity of every similar-looking stone.
Electron microscope image: This view shows small-scale regions selected for analysis. Its brightness contrast helps distinguish regions with different compositions; it is not a photograph of their natural colors. Numbered spots connect this view to the analyses listed in the report.
Laboratory figure caption: Fig.2: Backscattered electron image of an area of the specimen in Fig. 1.
Elemental spectrum: The peaks record characteristic X-ray signals from elements in the analyzed spot or area. This is an analysis of that location, not automatically of the entire specimen. Any mineral identification or uncertainty named in the laboratory caption is retained below.
Laboratory figure caption: Fig. 3: Energy dispersive spectrum of spot 1 in Fig. 2. (sodalite)
Elemental spectrum: The peaks record characteristic X-ray signals from elements in the analyzed spot or area. This is an analysis of that location, not automatically of the entire specimen. Any mineral identification or uncertainty named in the laboratory caption is retained below.
Laboratory figure caption: Fig. 4: Energy dispersive spectrum of area 2 in Fig. 2. (cancrinite)
Electron microscope image: This view shows small-scale regions selected for analysis. Its brightness contrast helps distinguish regions with different compositions; it is not a photograph of their natural colors. Numbered spots connect this view to the analyses listed in the report.
Laboratory figure caption: Fig.5: Backscattered electron image of another area of the specimen in Fig. 1.
Elemental spectrum: The peaks record characteristic X-ray signals from elements in the analyzed spot or area. This is an analysis of that location, not automatically of the entire specimen. Any mineral identification or uncertainty named in the laboratory caption is retained below.
Laboratory figure caption: Fig. 6: Energy dispersive spectrum of area 4 in Fig. 5. (resin fill)
Elemental spectrum: The peaks record characteristic X-ray signals from elements in the analyzed spot or area. This is an analysis of that location, not automatically of the entire specimen. Any mineral identification or uncertainty named in the laboratory caption is retained below.
Laboratory figure caption: Fig. 7: Energy dispersive spectrum of area 6 in Fig. 5. (hematite/magnetite)
Elemental spectrum: The peaks record characteristic X-ray signals from elements in the analyzed spot or area. This is an analysis of that location, not automatically of the entire specimen. Any mineral identification or uncertainty named in the laboratory caption is retained below.
Laboratory figure caption: Fig. 8: Energy dispersive spectrum of area 8 in Fig. 5. (diopside)
Elemental spectrum: The peaks record characteristic X-ray signals from elements in the analyzed spot or area. This is an analysis of that location, not automatically of the entire specimen. Any mineral identification or uncertainty named in the laboratory caption is retained below.
Laboratory figure caption: Fig. 9: Energy dispersive spectrum of area 1 in Fig. 5. (quartz)
Read the report findings as text
Sample 1519 (#5 sphere), completed September 14, 2025. Figure 1 photographs a sphere approximately 5 cm across. Figures 2–4 document sodalite and cancrinite in the main body. Figures 5–9 examine filled-in holes containing resin, hematite or magnetite, diopside, and quartz. The summary states that the bulk material is natural sodalite and cancrinite, while questioning the infilling.
Read the original laboratory report as text
The following text and tables are transcribed from the original laboratory document. Figure captions identify the report images; the laboratory interpretations and limitations are preserved.
Laboratory report 1
Analytical Result Report
Sample id: 1519 (#5 sphere)
Submitted by: Soul Body Gems
Date completed: 9-14-2025
Operating conditions: An AMRAY 1830 SEM operated at 25 kV acceleration potential, 24 mm working distance, 0 degrees sample tilt, coated with 250 Å carbon, and also using the attached XRF unit operated at 30 kV.
Fig. 1: Photograph of the specimens. 5 cm maximum dimension.
Fig.2: Backscattered electron image of an area of the specimen in Fig. 1.
Fig. 3: Energy dispersive spectrum of spot 1 in Fig. 2. (sodalite)
Fig. 4: Energy dispersive spectrum of area 2 in Fig. 2. (cancrinite)
Fig.5: Backscattered electron image of another area of the specimen in Fig. 1.
Fig. 6: Energy dispersive spectrum of area 4 in Fig. 5. (resin fill)
Fig. 7: Energy dispersive spectrum of area 6 in Fig. 5. (hematite/magnetite)
Fig. 8: Energy dispersive spectrum of area 8 in Fig. 5. (diopside)
Fig. 9: Energy dispersive spectrum of area 1 in Fig. 5. (quartz)
Summary of findings: A very interesting specimen! The bulk is composed of sodalite and cancrinite-deep blue and yellow-orange (Figs. 2-4). This is material found in some nepheline syenites, silica-undersaturated alkalic rocks which are rare. Surprising finds are filled-in holes (Fig. 5). There is some resin material (Figs. 5 and 6), hematite or magnetite (Figs. 5 and 7), diopside (Figs. 5 and 8), and quartz (Figs. 5 and 9). In the crushed material used for filling is some material that can and does occur with the sodalite/cancrinite, the diopside, the hematite/magnetite and similar ones but one mineral cannot occur there and that is quartz! Maybe some left-over material was used for infilling the voids? The bulk material is natural, it is the infilling that is troubling.
Date: 9-14-2025 Signature
The bulk of this green specimen from Turkey was identified as tremolite–actinolite, an amphibole-series material, with a serpentine-group mineral also present.
Tested specimen: 1509 (#5 green material) · Report completed: July 1, 2025
Key finding: Electron analysis and X-ray diffraction support tremolite–actinolite as the bulk. The additional serpentine-group species was identified as antigorite.
What the report means
The diffraction comparison also considered clinochlore. One of its main expected peaks was absent, so the report ruled clinochlore out for this tested specimen. Turkey is the supplied locality.
View the original test results
Select any page to enlarge the full laboratory report.
These results apply to the specimen tested. Report images are property of Soul Body Gems, Alexander Falster, and the Maine Mineral & Gem Museum; please acknowledge all three when referring to these results.
Understanding the report figures
Use this guide alongside the written findings and the original report transcript. It explains the purpose of each analytical figure and preserves the laboratory’s own figure labels. The interpretations apply to the tested specimen; signals alone do not establish the identity of every similar-looking stone.
Electron microscope image: This view shows small-scale regions selected for analysis. Its brightness contrast helps distinguish regions with different compositions; it is not a photograph of their natural colors. Numbered spots connect this view to the analyses listed in the report.
Laboratory figure caption: Fig.2: Backscattered electron image of an area of the specimen in Fig. 1.
Elemental spectrum: The peaks record characteristic X-ray signals from elements in the analyzed spot or area. This is an analysis of that location, not automatically of the entire specimen. Any mineral identification or uncertainty named in the laboratory caption is retained below.
Laboratory figure caption: Fig. 3: Energy dispersive spectrum of spot 1 in Fig. 2. (tremolite-actinolite)
Elemental spectrum: The peaks record characteristic X-ray signals from elements in the analyzed spot or area. This is an analysis of that location, not automatically of the entire specimen. Any mineral identification or uncertainty named in the laboratory caption is retained below.
Laboratory figure caption: Fig. 4: Energy dispersive spectrum of spot 2 in Fig. 2. (serpentine group likely)
Diffraction scan: This scan helps identify crystalline minerals by comparing the measured pattern with reference patterns. The laboratory interpretation explains which minerals the comparison supports.
Laboratory figure caption: Fig. 5: X-ray diffraction scan of the material with matching stick patterns
Read the report findings as text
Sample 1509 (#5 green material from Turkey), completed July 1, 2025. Figure 1 photographs a specimen approximately 12 cm at maximum dimension. Figure 2 shows a backscattered electron image; Figures 3 and 4 show analyses of tremolite–actinolite and a likely serpentine-group area. Figure 5 is the X-ray diffraction scan. The summary identifies the bulk as tremolite–actinolite and the additional phase as antigorite; clinochlore was ruled out because a main expected peak was missing.
Read the original laboratory report as text
The following text and tables are transcribed from the original laboratory document. Figure captions identify the report images; the laboratory interpretations and limitations are preserved.
Laboratory report 1
Analytical Result Report
Sample id: 1509 (#5 green material from Turkey)
Submitted by: Soul Body Gems
Date completed: 7-1-2025
Operating conditions: An AMRAY 1830 SEM operated at 25 kV acceleration potential, 24 mm working distance, 0 degrees sample tilt, coated with 250 Å carbon, and also using the attached XRF unit operated at 30 kV.
A Bruker D-2 Phaser X-ray diffractometer was also used and operated at 30 kV and 10 mA.
Fig. 1: Photograph of the specimens. 12 cm maximum dimension.
Fig.2: Backscattered electron image of an area of the specimen in Fig. 1.
Fig. 3: Energy dispersive spectrum of spot 1 in Fig. 2. (tremolite-actinolite)
Fig. 4: Energy dispersive spectrum of spot 2 in Fig. 2. (serpentine group likely)
Fig. 5: X-ray diffraction scan of the material with matching stick patterns
Summary of findings: Interesting specimen (Fig. 1). The bulk is tremolite-actinolite (Figs. 2,3 and 5), an amphibole series and there is also a serpentine group species present, antigorite (Figs. 2,4 and 5), Interestingly, in blue are the peaks for clinochlore overlain as well and it s a very good fit except for one of the main peaks is missing, way at the left so that is thus ruled out.
Date: 7-1-2025 Signature
Sapphire is a gem variety of corundum. Our Gem Knowledge archive will grow with distinct specimens, localities, and treatment documentation.
Tested variation: Two sapphires supplied from Madagascar, specimen 1513 (#5), report completed July 9, 2025.
Key finding: Both a pear-shaped stone and a navette tested compositionally as corundum/sapphire. Their minor and trace elements included chromium and vanadium; vanadium can contribute to color change behavior.
One variation in our sapphire archive
These are the first Madagascar color change specimens added to this overview. The report did not identify obvious modifications, but that observation is not proof that the stones are unheated. Treatment documentation for any individual gem offered for sale should be read on its own terms.
This report applies to the tested specimens. Report images are property of Soul Body Gems, Alexander Falster, and the Maine Mineral & Gem Museum; please acknowledge all three when referring to these results.
Understanding the report figures
Use this guide alongside the written findings and the original report transcript. It explains the purpose of each analytical figure and preserves the laboratory’s own figure labels. The interpretations apply to the tested specimen; signals alone do not establish the identity of every similar-looking stone.
Electron microscope image: This view shows small-scale regions selected for analysis. Its brightness contrast helps distinguish regions with different compositions; it is not a photograph of their natural colors. Numbered spots connect this view to the analyses listed in the report.
Laboratory figure caption: Fig.2: Backscattered electron image of an area of the specimen in Fig. 1.
Elemental spectrum: The peaks record characteristic X-ray signals from elements in the analyzed spot or area. This is an analysis of that location, not automatically of the entire specimen. Any mineral identification or uncertainty named in the laboratory caption is retained below.
Laboratory figure caption: Fig. 3: Energy dispersive spectrum of spot 1 in Fig. 2. (corundum)
Elemental spectrum: The peaks record characteristic X-ray signals from elements in the analyzed spot or area. This is an analysis of that location, not automatically of the entire specimen. Any mineral identification or uncertainty named in the laboratory caption is retained below.
Laboratory figure caption: Fig. 4: Energy dispersive spectrum of area 2 in Fig. 2. (corundum)
Read the report findings as text
Sample 1513 (#5 color change sapphire), completed July 9, 2025. The pear-shaped and navette stones were both identified as corundum/sapphire. The report lists chromium at 0.02 and 0.05 wt.% respectively, vanadium at 0.16 and 0.07 wt.%, and differing minor amounts of iron and other elements. The author noted no obvious modifications, but did not certify an unheated state.
Read the original laboratory report as text
The following text and tables are transcribed from the original laboratory document. Figure captions identify the report images; the laboratory interpretations and limitations are preserved.
Laboratory report 1
Analytical Result Report
Sample id: 1513 (#5 color change sapphire
Submitted by: Soul Body Gems
Date completed: 7-9-2025
Operating conditions: An AMRAY 1830 SEM operated at 25 kV acceleration potential, 24 mm working distance, 0 degrees sample tilt, coated with 250 Å carbon, and also using the attached XRF unit operated at 30 kV.
Fig. 1: Photograph of the specimens. 0.6 cm maximum dimension.
Fig.2: Backscattered electron image of an area of the specimen in Fig. 1.
Fig. 3: Energy dispersive spectrum of spot 1 in Fig. 2. (corundum)
Fig. 4: Energy dispersive spectrum of area 2 in Fig. 2. (corundum)
Table 1: minor and trace eleemnts in the specimens, in wt. %
Laboratory data as recorded in the report
element
Pear-shaped
navette
Chromium
0.02
0.05
Copper
0.01
0.01
Iron
0.07
0.18
Manganese
0.16
0.13
Titanium
0.04
0.03
Vanadium
0.16
0.07
Summary of findings: These specimens (Fig. 1) are pretty. Compositionally, they are both corundum/sapphire (Figs. 2-4). The trace and minor element contents (Table 1) are similar though not identical; this is to be expected. Chromium and vanadium are present and especially vanadium is well-known to cause color change effects. I did not notice any obvious modifications done to the stones. Heat treatment is almost always performed.
Date: 7-9-2025 Signature
Two sapphires supplied from Madagascar were tested to confirm their mineral identity and document elements relevant to their color change appearance.
Tested specimens: 1513 (#5), a pear-shaped and a navette stone · Report completed: July 9, 2025.
Key finding: Both are corundum/sapphire. Chromium and vanadium were found in each; the report notes that vanadium is associated with color change effects.
Color and treatment
The report compares minor and trace elements in the two stones. Vanadium measured 0.16 wt.% in the pear and 0.07 wt.% in the navette; chromium measured 0.02 and 0.05 wt.% respectively. The report discusses color change but does not include a separate standardized optical color-change measurement.
The researcher did not notice obvious modifications. That statement does not establish that either stone is unheated. Madagascar is the supplied source; the chemical analysis alone does not determine geographic origin.
This report applies to the tested specimens. Report images are property of Soul Body Gems, Alexander Falster, and the Maine Mineral & Gem Museum; please acknowledge all three when referring to these results.
Understanding the report figures
Use this guide alongside the written findings and the original report transcript. It explains the purpose of each analytical figure and preserves the laboratory’s own figure labels. The interpretations apply to the tested specimen; signals alone do not establish the identity of every similar-looking stone.
Electron microscope image: This view shows small-scale regions selected for analysis. Its brightness contrast helps distinguish regions with different compositions; it is not a photograph of their natural colors. Numbered spots connect this view to the analyses listed in the report.
Laboratory figure caption: Fig.2: Backscattered electron image of an area of the specimen in Fig. 1.
Elemental spectrum: The peaks record characteristic X-ray signals from elements in the analyzed spot or area. This is an analysis of that location, not automatically of the entire specimen. Any mineral identification or uncertainty named in the laboratory caption is retained below.
Laboratory figure caption: Fig. 3: Energy dispersive spectrum of spot 1 in Fig. 2. (corundum)
Elemental spectrum: The peaks record characteristic X-ray signals from elements in the analyzed spot or area. This is an analysis of that location, not automatically of the entire specimen. Any mineral identification or uncertainty named in the laboratory caption is retained below.
Laboratory figure caption: Fig. 4: Energy dispersive spectrum of area 2 in Fig. 2. (corundum)
Read the report findings as text
Sample 1513 (#5 color change sapphire), completed July 9, 2025. Figures 1–4 photograph and analyze the two specimens as corundum. The trace-element table reports, pear-shaped versus navette: chromium 0.02/0.05, copper 0.01/0.01, iron 0.07/0.18, manganese 0.16/0.13, titanium 0.04/0.03, and vanadium 0.16/0.07 wt.%. The researcher noted no obvious modifications but did not issue a definitive heating assessment.
Read the original laboratory report as text
The following text and tables are transcribed from the original laboratory document. Figure captions identify the report images; the laboratory interpretations and limitations are preserved.
Laboratory report 1
Analytical Result Report
Sample id: 1513 (#5 color change sapphire
Submitted by: Soul Body Gems
Date completed: 7-9-2025
Operating conditions: An AMRAY 1830 SEM operated at 25 kV acceleration potential, 24 mm working distance, 0 degrees sample tilt, coated with 250 Å carbon, and also using the attached XRF unit operated at 30 kV.
Fig. 1: Photograph of the specimens. 0.6 cm maximum dimension.
Fig.2: Backscattered electron image of an area of the specimen in Fig. 1.
Fig. 3: Energy dispersive spectrum of spot 1 in Fig. 2. (corundum)
Fig. 4: Energy dispersive spectrum of area 2 in Fig. 2. (corundum)
Table 1: minor and trace eleemnts in the specimens, in wt. %
Laboratory data as recorded in the report
element
Pear-shaped
navette
Chromium
0.02
0.05
Copper
0.01
0.01
Iron
0.07
0.18
Manganese
0.16
0.13
Titanium
0.04
0.03
Vanadium
0.16
0.07
Summary of findings: These specimens (Fig. 1) are pretty. Compositionally, they are both corundum/sapphire (Figs. 2-4). The trace and minor element contents (Table 1) are similar though not identical; this is to be expected. Chromium and vanadium are present and especially vanadium is well-known to cause color change effects. I did not notice any obvious modifications done to the stones. Heat treatment is almost always performed.
Rhodonite in Quartz Stretch Bracelets · Soul Body Gems, September 2024.
A bracelet of clear quartz beads with pink manganese-silicate inclusions was examined to identify the material behind the color.
Tested specimen: 10473 (#5) · Report completed: January 18, 2024.
Key finding: The beads are quartz. The pink inclusions are a manganese silicate; rhodonite is the researcher’s most likely identification, though pyroxferroite was also considered.
Reading the result
The analysis supports the name “Rhodonite in Quartz” as the most likely interpretation, with a stated limit: the laboratory considered rhodonite, pyroxferroite, and tephroite, and favored rhodonite on the silicon-to-manganese relationship and its greater occurrence. The report did not conclusively distinguish rhodonite from pyroxferroite in the tested inclusions.
Paler, smaller grains in the quartz showed the same manganese and silicon composition in additional spots and may be a paler expression of the inclusions.
This report applies to the tested specimens. Report images are property of Soul Body Gems, Alexander Falster, and the Maine Mineral & Gem Museum; please acknowledge all three when referring to these results.
Understanding the report figures
Use this guide alongside the written findings and the original report transcript. It explains the purpose of each analytical figure and preserves the laboratory’s own figure labels. The interpretations apply to the tested specimen; signals alone do not establish the identity of every similar-looking stone.
Electron microscope image: This view shows small-scale regions selected for analysis. Its brightness contrast helps distinguish regions with different compositions; it is not a photograph of their natural colors. Numbered spots connect this view to the analyses listed in the report.
Laboratory figure caption: Fig.2: Backscattered electron image of an area of the specimen.
Elemental spectrum: The peaks record characteristic X-ray signals from elements in the analyzed spot or area. This is an analysis of that location, not automatically of the entire specimen. Any mineral identification or uncertainty named in the laboratory caption is retained below.
Laboratory figure caption: Fig. 3: Energy dispersive spectrum of spot 1 in Fig. 2 (quartz)
Elemental spectrum: The peaks record characteristic X-ray signals from elements in the analyzed spot or area. This is an analysis of that location, not automatically of the entire specimen. Any mineral identification or uncertainty named in the laboratory caption is retained below.
Laboratory figure caption: Fig. 4: Energy dispersive spectrum of spot 2 in Fig. 2 (manganese silicate)
Read the report findings as text
Sample 10473 (#5), completed January 18, 2024. Figure 1 shows a bracelet with quartz beads around 7.5 mm maximum dimension. Figures 2–4 document quartz and pink manganese-silicate inclusions. The report considers rhodonite, pyroxferroite, or tephroite and says rhodonite is most likely, while retaining uncertainty. The manganese-silicate trace elements include calcium 0.6, iron 0.02, and magnesium 0.7 wt.%.
Read the original laboratory report as text
The following text and tables are transcribed from the original laboratory document. Figure captions identify the report images; the laboratory interpretations and limitations are preserved.
Laboratory report 1
Analytical Result Report
Sample id: 10473 (#5)
Submitted by: Soul Body Gems
Date completed: 1-18-2024
Operating conditions: An AMRAY 1830 SEM operated at 25 kV acceleration potential, 24 mm working distance, 0 degrees sample tilt, coated with 250 Å carbon, and also using the attached XRF unit operated at 30 kV.
A BRUKER Titan X-ray fluorescence spectrometer was also used and operated for 30 seconds at 50, 25, and 10 kV.
Fig. 1: Photograph of the specimen. Approximately 7.5 mm maximum dimension of the beads.
Fig.2: Backscattered electron image of an area of the specimen.
Fig. 3: Energy dispersive spectrum of spot 1 in Fig. 2 (quartz)
Fig. 4: Energy dispersive spectrum of spot 2 in Fig. 2 (manganese silicate)
Table 1: minor and trace elements in the manganese silicate.
Laboratory data as recorded in the report
Element
Reported value
Calcium
0.6
Iron
0.02
Magnesium
0.7
Summary of findings: This specimen (Fig. 1) is a pretty wristlet of colorless beads of quartz (Figs. 2 and 3) with pink inclusions of a manganese silicate (Figs. 2 and 4). The trace elements are mainly magnesium and calcium with very little iron. The pink inclusions are either rhodonite, pyroxferroite or tephroite. It is more likely to be rhodonite or pyroxferroite since the Si-Mn ratio shows a higher Si peak than would be typical for tephroite but rhodonite out of the two choice is most likely since it is much more common. I noticed some very pale grains in the quartz and checked a dozen more spots, but each sowed the same composition with manganese and silicon. Possibly, they are a paler colored rhodonite and they tended to be smaller than the pink inclusions.
Key finding: Red bands contained 0.2–0.8 wt.% iron, while the white-gray bands had no quantifiable iron in the tested areas. Black bands contained up to 0.3 wt.% manganese.
What the bands reveal
The report confirms the quartz/chalcedony identity of both specimens and documents chemical differences between their colored bands. These measurements describe the tested spots; they do not by themselves identify a precise pigment mineral or independently verify geographic origin.
View the original test results
Select any page to enlarge the full laboratory report.
The report applies to these specimens. Please credit Soul Body Gems, Alexander Falster, and the Maine Mineral & Gem Museum when referring to the results.
Understanding the report figures
Use this guide alongside the written findings and the original report transcript. It explains the purpose of each analytical figure and preserves the laboratory’s own figure labels. The interpretations apply to the tested specimen; signals alone do not establish the identity of every similar-looking stone.
Electron microscope image: This view shows small-scale regions selected for analysis. Its brightness contrast helps distinguish regions with different compositions; it is not a photograph of their natural colors. Numbered spots connect this view to the analyses listed in the report.
Laboratory figure caption: Fig.2: Backscattered electron image of an area of the specimen in Fig. 1. (top)
Elemental spectrum: The peaks record characteristic X-ray signals from elements in the analyzed spot or area. This is an analysis of that location, not automatically of the entire specimen. Any mineral identification or uncertainty named in the laboratory caption is retained below.
Laboratory figure caption: Fig. 3: Energy dispersive spectrum of spot 1 in Fig. 2. (quartz)
Elemental spectrum: The peaks record characteristic X-ray signals from elements in the analyzed spot or area. This is an analysis of that location, not automatically of the entire specimen. Any mineral identification or uncertainty named in the laboratory caption is retained below.
Laboratory figure caption: Fig. 4: Energy dispersive spectrum of spot 2 in Fig. 2. (quartz)
Electron microscope image: This view shows small-scale regions selected for analysis. Its brightness contrast helps distinguish regions with different compositions; it is not a photograph of their natural colors. Numbered spots connect this view to the analyses listed in the report.
Laboratory figure caption: Fig.5: Backscattered electron image of an area of the specimen in Fig. 1. (bottom)
Elemental spectrum: The peaks record characteristic X-ray signals from elements in the analyzed spot or area. This is an analysis of that location, not automatically of the entire specimen. Any mineral identification or uncertainty named in the laboratory caption is retained below.
Laboratory figure caption: Fig. 6: Energy dispersive spectrum of spot 1 in Fig. 5. (quartz)
Elemental spectrum: The peaks record characteristic X-ray signals from elements in the analyzed spot or area. This is an analysis of that location, not automatically of the entire specimen. Any mineral identification or uncertainty named in the laboratory caption is retained below.
Laboratory figure caption: Fig. 7: Energy dispersive spectrum of spot 2 in Fig. 5. (quartz)
Read the report findings as text
Sample 1506 (#4 Sumatran agate), completed June 23, 2025. SEM and XRF examination found both specimens to be quartz (chalcedony/agate). The red bands contained 0.2–0.8 weight percent iron; white-gray bands contained no quantifiable iron. Black bands contained up to 0.3 weight percent manganese. Figures 1–7 show specimen photographs, backscattered electron images, and energy-dispersive spectra of quartz spots.
Read the original laboratory report as text
The following text and tables are transcribed from the original laboratory document. Figure captions identify the report images; the laboratory interpretations and limitations are preserved.
Laboratory report 1
Analytical Result Report
Sample id: 1506 (#4 Sumatran agate)
Submitted by: Soul Body Gems
Date completed: 6-23-2025
Operating conditions: An AMRAY 1830 SEM operated at 25 kV acceleration potential, 24 mm working distance, 0 degrees sample tilt, coated with 250 Å carbon, and also using the attached XRF unit operated at 30 kV.
Fig. 1: Photograph of the specimens. 6.5 cm maximum dimension.
Fig.2: Backscattered electron image of an area of the specimen in Fig. 1. (top)
Fig. 3: Energy dispersive spectrum of spot 1 in Fig. 2. (quartz)
Fig. 4: Energy dispersive spectrum of spot 2 in Fig. 2. (quartz)
Fig.5: Backscattered electron image of an area of the specimen in Fig. 1. (bottom)
Fig. 6: Energy dispersive spectrum of spot 1 in Fig. 5. (quartz)
Fig. 7: Energy dispersive spectrum of spot 2 in Fig. 5. (quartz)
Summary of findings: These are interesting specimens (Fig. 1). Both are quartz (chalcedony/agate (Figs. 2-7).
The red bands contain 0.2-0.8 wt. % iron, the white gray ones do not contain quantifiable amounts of iron. The black bands contain up to 0.3 wt. % of manganese.
Date: 6-23-2025 Signature
This sphere from a Tanzania-sourced find was analyzed for its distinctive mica-rich mineral assemblage.
Key finding: Muscovite, a likely phengite replacement of an earlier aluminum-rich mineral, and quartz; accessory ferrocolumbite and xenotime-(Y) were also found.
A pegmatite story
The researcher interpreted the sphere as a geochemically evolved, anorogenic granitic pegmatite. The mineral replaced by phengite may once have been topaz or another aluminum-rich phase; its identity was not confirmed. Plagioclase was not observed in the examined surface, though the report notes it could be present elsewhere in the specimen.
The material was supplied as a newer 2025 find from Tanzania. The laboratory report characterizes the specimen but does not independently establish the mining location or discovery date.
Findings apply to the examined sphere. Please credit Soul Body Gems, Alexander Falster, and the Maine Mineral & Gem Museum when referring to these results.
Understanding the report figures
Use this guide alongside the written findings and the original report transcript. It explains the purpose of each analytical figure and preserves the laboratory’s own figure labels. The interpretations apply to the tested specimen; signals alone do not establish the identity of every similar-looking stone.
Electron microscope image: This view shows small-scale regions selected for analysis. Its brightness contrast helps distinguish regions with different compositions; it is not a photograph of their natural colors. Numbered spots connect this view to the analyses listed in the report.
Laboratory figure caption: Fig.2: Backscattered electron image of an area of the specimen in Fig. 1.
Elemental spectrum: The peaks record characteristic X-ray signals from elements in the analyzed spot or area. This is an analysis of that location, not automatically of the entire specimen. Any mineral identification or uncertainty named in the laboratory caption is retained below.
Laboratory figure caption: Fig. 3: Energy dispersive spectrum of spot 1 in Fig. 2. (muscovite)
Elemental spectrum: The peaks record characteristic X-ray signals from elements in the analyzed spot or area. This is an analysis of that location, not automatically of the entire specimen. Any mineral identification or uncertainty named in the laboratory caption is retained below.
Laboratory figure caption: Fig. 4: Energy dispersive spectrum of spot 2 in Fig. 2 (likely phengite).
Elemental spectrum: The peaks record characteristic X-ray signals from elements in the analyzed spot or area. This is an analysis of that location, not automatically of the entire specimen. Any mineral identification or uncertainty named in the laboratory caption is retained below.
Laboratory figure caption: Fig. 5: Energy dispersive spectrum of spot 4 in Fig. 2 (quartz).
Electron microscope image: This view shows small-scale regions selected for analysis. Its brightness contrast helps distinguish regions with different compositions; it is not a photograph of their natural colors. Numbered spots connect this view to the analyses listed in the report.
Laboratory figure caption: Fig.6: Backscattered electron image of another area of the specimen in Fig. 1.
Elemental spectrum: The peaks record characteristic X-ray signals from elements in the analyzed spot or area. This is an analysis of that location, not automatically of the entire specimen. Any mineral identification or uncertainty named in the laboratory caption is retained below.
Laboratory figure caption: Fig. 7: Energy dispersive spectrum of spot 1 in Fig. 6 (ferrocolumbite).
Electron microscope image: This view shows small-scale regions selected for analysis. Its brightness contrast helps distinguish regions with different compositions; it is not a photograph of their natural colors. Numbered spots connect this view to the analyses listed in the report.
Laboratory figure caption: Fig.8: Backscattered electron image of another area of the specimen in Fig. 1.
Elemental spectrum: The peaks record characteristic X-ray signals from elements in the analyzed spot or area. This is an analysis of that location, not automatically of the entire specimen. Any mineral identification or uncertainty named in the laboratory caption is retained below.
Laboratory figure caption: Fig. 9: Energy dispersive spectrum of spot 1 in Fig. 8 (xenotime-(Y).
Read the report findings as text
Sample 1221 (#4 sphere), completed March 7, 2025. Identified phases include muscovite, likely phengite replacing an earlier mineral, quartz, accessory ferrocolumbite, and xenotime-(Y). The replaced mineral may have been topaz or another aluminum-rich mineral. Plagioclase was not found in the examined surface. The researcher interpreted the specimen as a geochemically evolved anorogenic granitic pegmatite and reported a potassium-to-rubidium ratio of 15 in the muscovite.
Read the original laboratory report as text
The following text and tables are transcribed from the original laboratory document. Figure captions identify the report images; the laboratory interpretations and limitations are preserved.
Laboratory report 1
Analytical Result Report
Sample id: 1221 (#4 sphere
Submitted by: Soul Body Gems
Date completed: 3-7-2025
Operating conditions: An AMRAY 1830 SEM operated at 25 kV acceleration potential, 24 mm working distance, 0 degrees sample tilt, coated with 250 Å carbon, and also using the attached XRF unit operated at 30 kV.
Fig. 1: Photograph of the specimens. 6 cm maximum dimension.
Fig.2: Backscattered electron image of an area of the specimen in Fig. 1.
Fig. 3: Energy dispersive spectrum of spot 1 in Fig. 2. (muscovite)
Fig. 4: Energy dispersive spectrum of spot 2 in Fig. 2 (likely phengite).
Fig. 5: Energy dispersive spectrum of spot 4 in Fig. 2 (quartz).
Fig.6: Backscattered electron image of another area of the specimen in Fig. 1.
Fig. 7: Energy dispersive spectrum of spot 1 in Fig. 6 (ferrocolumbite).
Fig.8: Backscattered electron image of another area of the specimen in Fig. 1.
Fig. 9: Energy dispersive spectrum of spot 1 in Fig. 8 (xenotime-(Y).
Summary of findings: This is a beautiful sphere! (Fig. 1). Mineralogically, it is composed of muscovite (Figs. 2 and 3), a phengite replacement of a mineral that is now gone (Figs. 2 and 4) and quartz (Figs. 2 and 5). The mineral replaced by phengite could have been topaz, or another aluminum-rich mineral. Accessory ferrocolumbite (Figs. 6 and 7) and xenotime-(Y) (Figs. 8 and 9) have also been found. Plagioclase was not found in this specimen but may just not have been exposed, it is likely to be present. Essentially, this is a granitic pegmatite and specifically of the anorogenic type, the kind that does not form during mountain building but forms when crustal thinning occurs and deeper-seater melts come up. These melts are typically niobium- and rare earth element rich (ferrocolumbite, xenotime!). The melts are also more iron rich and the reddish areas in the specimen and the iron content of the muscovite attest to that. The K/Rb ratio of the muscovite is 15 which is geochemically evolved.
Yellow Labradorite Gem Facet · Soul Body Gems, December 2024.
Two faceted yellow stones were examined. Both are plagioclase with a composition in the labradorite range.
Tested specimens: Sample 1205 (#4 yellow labradorite), 5.23 ct and 3.89 ct · Report completed: January 12, 2025.
Key finding: Both tested as labradorite, not glass. Their crystalline, monocrystalline appearance was considered consistent with natural stones. Iron at approximately 0.4–0.6% is likely responsible for the yellow hue.
What was established
The report examined both cut stones by electron microscopy and XRF, with polarized-light examination of the smaller stone. It describes them as appearing natural; that phrasing is an observation, not a comprehensive origin or treatment certificate. The analysis applies to these two stones.
The two directory names share this report. Please credit Soul Body Gems, Alexander Falster, and the Maine Mineral & Gem Museum when referring to these results.
Understanding the report figures
Use this guide alongside the written findings and the original report transcript. It explains the purpose of each analytical figure and preserves the laboratory’s own figure labels. The interpretations apply to the tested specimen; signals alone do not establish the identity of every similar-looking stone.
Electron microscope image: This view shows small-scale regions selected for analysis. Its brightness contrast helps distinguish regions with different compositions; it is not a photograph of their natural colors. Numbered spots connect this view to the analyses listed in the report.
Laboratory figure caption: Fig.2: Backscattered electron image of an area of the smaller specimen.
Elemental spectrum: The peaks record characteristic X-ray signals from elements in the analyzed spot or area. This is an analysis of that location, not automatically of the entire specimen. Any mineral identification or uncertainty named in the laboratory caption is retained below.
Laboratory figure caption: Fig. 3: Energy dispersive spectrum of spot 1 in Fig. 2. (labradorite)
Elemental spectrum: The peaks record characteristic X-ray signals from elements in the analyzed spot or area. This is an analysis of that location, not automatically of the entire specimen. Any mineral identification or uncertainty named in the laboratory caption is retained below.
Laboratory figure caption: Fig. 4: Energy dispersive spectrum from the larger stone in Fig. 1. (labradorite).
Read the report findings as text
Sample 1205 (#4 yellow labradorite), completed January 12, 2025. The 5.23 ct and 3.89 ct faceted stones are plagioclase, compositionally labradorite. Both are crystalline and monocrystalline, rather than glass, and appear natural. The researcher suggests iron at 0.4–0.6% likely causes the yellow color.
Read the original laboratory report as text
The following text and tables are transcribed from the original laboratory document. Figure captions identify the report images; the laboratory interpretations and limitations are preserved.
Laboratory report 1
Analytical Result Report
Sample id: 1205 (#4 yellow labradorite)
Submitted by: Soul Body Gems
Date completed: 1-12-2025
Operating conditions: An AMRAY 1830 SEM operated at 25 kV acceleration potential, 24 mm working distance, 0 degrees sample tilt, coated with 250 Å carbon, and also using the attached XRF unit operated at 30 kV.
Fig. 1: Photograph of the specimens. 5.23 and 3.89 cts.
Fig.2: Backscattered electron image of an area of the smaller specimen.
Fig. 3: Energy dispersive spectrum of spot 1 in Fig. 2. (labradorite)
Fig. 4: Energy dispersive spectrum from the larger stone in Fig. 1. (labradorite).
Fig. 5: The smaller specimen in polarized light.
Summary of findings: These specimens (Fig. 1) are beautiful cut stones. Both are plagioclases, compositionally labradorite 9Figs. 2-4). The are crystalline and thus are not glass, monocrystalline and appear natural (Fig. 5). A small iron content of 0.4-0.6 % is likely responsible for the yellow hue.
Yellow Labradorite Gem Facet · Soul Body Gems, December 2024.
Two faceted yellow stones were examined. Both are plagioclase with a composition in the labradorite range.
Tested specimens: Sample 1205 (#4 yellow labradorite), 5.23 ct and 3.89 ct · Report completed: January 12, 2025.
Key finding: Both tested as labradorite, not glass. Their crystalline, monocrystalline appearance was considered consistent with natural stones. Iron at approximately 0.4–0.6% is likely responsible for the yellow hue.
What was established
The report examined both cut stones by electron microscopy and XRF, with polarized-light examination of the smaller stone. It describes them as appearing natural; that phrasing is an observation, not a comprehensive origin or treatment certificate. The analysis applies to these two stones.
The two directory names share this report. Please credit Soul Body Gems, Alexander Falster, and the Maine Mineral & Gem Museum when referring to these results.
Understanding the report figures
Use this guide alongside the written findings and the original report transcript. It explains the purpose of each analytical figure and preserves the laboratory’s own figure labels. The interpretations apply to the tested specimen; signals alone do not establish the identity of every similar-looking stone.
Electron microscope image: This view shows small-scale regions selected for analysis. Its brightness contrast helps distinguish regions with different compositions; it is not a photograph of their natural colors. Numbered spots connect this view to the analyses listed in the report.
Laboratory figure caption: Fig.2: Backscattered electron image of an area of the smaller specimen.
Elemental spectrum: The peaks record characteristic X-ray signals from elements in the analyzed spot or area. This is an analysis of that location, not automatically of the entire specimen. Any mineral identification or uncertainty named in the laboratory caption is retained below.
Laboratory figure caption: Fig. 3: Energy dispersive spectrum of spot 1 in Fig. 2. (labradorite)
Elemental spectrum: The peaks record characteristic X-ray signals from elements in the analyzed spot or area. This is an analysis of that location, not automatically of the entire specimen. Any mineral identification or uncertainty named in the laboratory caption is retained below.
Laboratory figure caption: Fig. 4: Energy dispersive spectrum from the larger stone in Fig. 1. (labradorite).
Read the report findings as text
Sample 1205 (#4 yellow labradorite), completed January 12, 2025. The 5.23 ct and 3.89 ct faceted stones are plagioclase, compositionally labradorite. Both are crystalline and monocrystalline, rather than glass, and appear natural. The researcher suggests iron at 0.4–0.6% likely causes the yellow color.
Read the original laboratory report as text
The following text and tables are transcribed from the original laboratory document. Figure captions identify the report images; the laboratory interpretations and limitations are preserved.
Laboratory report 1
Analytical Result Report
Sample id: 1205 (#4 yellow labradorite)
Submitted by: Soul Body Gems
Date completed: 1-12-2025
Operating conditions: An AMRAY 1830 SEM operated at 25 kV acceleration potential, 24 mm working distance, 0 degrees sample tilt, coated with 250 Å carbon, and also using the attached XRF unit operated at 30 kV.
Fig. 1: Photograph of the specimens. 5.23 and 3.89 cts.
Fig.2: Backscattered electron image of an area of the smaller specimen.
Fig. 3: Energy dispersive spectrum of spot 1 in Fig. 2. (labradorite)
Fig. 4: Energy dispersive spectrum from the larger stone in Fig. 1. (labradorite).
Fig. 5: The smaller specimen in polarized light.
Summary of findings: These specimens (Fig. 1) are beautiful cut stones. Both are plagioclases, compositionally labradorite 9Figs. 2-4). The are crystalline and thus are not glass, monocrystalline and appear natural (Fig. 5). A small iron content of 0.4-0.6 % is likely responsible for the yellow hue.
Key finding: Shattuckite and chrysocolla were both indicated in a dolomite matrix. This is a copper-silicate mixture, not a specimen shown to be pure shattuckite.
Reading the result
X-ray diffraction lines supported shattuckite, while additional peaks supported chrysocolla. The copper silicates were poorly crystallized and likely partly amorphous. The report identifies this tested palm stone; the Congo locality was supplied with the material and was not independently established by the analysis.
Please credit Soul Body Gems, Alexander Falster, and the Maine Mineral & Gem Museum when referring to these results.
Understanding the report figures
Use this guide alongside the written findings and the original report transcript. It explains the purpose of each analytical figure and preserves the laboratory’s own figure labels. The interpretations apply to the tested specimen; signals alone do not establish the identity of every similar-looking stone.
Diffraction scan: This scan helps identify crystalline minerals by comparing the measured pattern with reference patterns. The laboratory interpretation explains which minerals the comparison supports.
Laboratory figure caption: Figure 1 shows the specimen, 7 cm maximum dimension, with a close-up of the interior on the right. The X-ray diffraction scan of the blue material has the quartz pattern overlaid.
Electron microscope image: This view shows small-scale regions selected for analysis. Its brightness contrast helps distinguish regions with different compositions; it is not a photograph of their natural colors. Numbered spots connect this view to the analyses listed in the report.
Laboratory figure caption: Fig.2: Backscattered electron image of an area of the specimen.
Elemental spectrum: The peaks record characteristic X-ray signals from elements in the analyzed spot or area. This is an analysis of that location, not automatically of the entire specimen. Any mineral identification or uncertainty named in the laboratory caption is retained below.
Laboratory figure caption: Fig. 3: Energy dispersive spectrum of spot 1 in Fig. 2. This is the blue part. (a copper silicate)
Elemental spectrum: The peaks record characteristic X-ray signals from elements in the analyzed spot or area. This is an analysis of that location, not automatically of the entire specimen. Any mineral identification or uncertainty named in the laboratory caption is retained below.
Laboratory figure caption: Fig. 4: Energy dispersive spectrum of spot 2 in Fig. 2 (iron oxide, such as goethite or hematite)
Elemental spectrum: The peaks record characteristic X-ray signals from elements in the analyzed spot or area. This is an analysis of that location, not automatically of the entire specimen. Any mineral identification or uncertainty named in the laboratory caption is retained below.
Laboratory figure caption: Fig. 5: Energy dispersive spectrum of spot 3 in Fig. 2. This is the green part. (a copper silicate)
Element map: This map shows where the named elements occur within the analyzed area. Its colors represent the laboratory’s selected element channels, rather than the specimen’s visible colors. The caption below preserves any color key or distribution noted by the laboratory.
Laboratory figure caption: Fig. 6: X-ray map of the area shown in Fig. 2. Copper: blue, silicon: yellow.
Diffraction scan: This scan helps identify crystalline minerals by comparing the measured pattern with reference patterns. The laboratory interpretation explains which minerals the comparison supports.
Laboratory figure caption: Fig. 7: X-ray diffraction scaan of the blue parts in the specimen. Note very poor crystallinity as is evidnet from the amorphous hump.
Elemental spectrum: The peaks record characteristic X-ray signals from elements in the analyzed spot or area. This is an analysis of that location, not automatically of the entire specimen. Any mineral identification or uncertainty named in the laboratory caption is retained below.
Laboratory figure caption: Fig. 3: Energy dispersive spectrum of spot 1 in Fig. 2. (copper silicate)
Elemental spectrum: The peaks record characteristic X-ray signals from elements in the analyzed spot or area. This is an analysis of that location, not automatically of the entire specimen. Any mineral identification or uncertainty named in the laboratory caption is retained below.
Laboratory figure caption: Fig. 4: Energy dispersive spectrum of spot 2 in Fig. 2. (copper silicate)
Elemental spectrum: The peaks record characteristic X-ray signals from elements in the analyzed spot or area. This is an analysis of that location, not automatically of the entire specimen. Any mineral identification or uncertainty named in the laboratory caption is retained below.
Laboratory figure caption: Fig. 5: Energy dispersive spectrum of spot 4 in Fig. 2 (dolomite).
Read the report findings as text
Sample 1204 (blue palm stone), completed December 22, 2024. The specimen contains copper silicates such as chrysocolla, with evidence for shattuckite, in a dolomite matrix. X-ray diffraction lines at 4.43, 2.37, and 3.49 ångströms indicate shattuckite, along with peaks attributable to chrysocolla. The copper silicates are not well crystallized and are likely partly amorphous.
Another Congo specimen: chrysocolla sold as chrysocolla shattuckite
This separate specimen illustrates why the supplied name should be checked against testing. It differs from the palm stone above, for which shattuckite was indicated.
Sample: 1565 (#2 chrysocolla) · Completed: May 18, 2026.
Finding: Composition in the range of typical chrysocolla, largely amorphous, with a small amount of quartz. Shattuckite was not identified in this report.
Locality: Congo, according to Soul Body Gems sourcing information. This material was originally supplied to us as chrysocolla shattuckite.
The brown fragments appear to be chrysocolla with hematite/goethite, formed during brecciation of the deposit. The researcher also suspects stabilization but states that confirmation is still needed; this report does not establish it conclusively.
These results are the property of Soul Body Gems, Alexander Falster, and the Maine Mineral & Gem Museum. Any mention requires full acknowledgment.
Read the report findings and table as text
Sample 1565 (#2 chrysocolla), submitted by Soul Body Gems, completed May 18, 2026. A Bruker Titan X-ray fluorescence spectrometer operated at 10, 25, and 50 kV. A Bruker D2-Phaser X-ray diffractometer operated at 30 kV and 10 mA.
Figure 1 shows the specimen, 7 cm maximum dimension, with a close-up of the interior on the right. The X-ray diffraction scan of the blue material has the quartz pattern overlaid.
Table 1: Major and minor elemental composition from a fresh surface, in wt.%
Element
Wt.%
Aluminum
0.5
Calcium
0.3
Copper
31.3
Iron
1.5
Silicon
16.8
Summary: The composition falls in the range of typical chrysocolla. X-ray diffraction shows largely amorphous material, fairly common for chrysocolla. Main diffraction peaks are present but weak, with a small amount of quartz. Brown fragments appear to be chrysocolla with hematite/goethite, evidently formed during brecciation. The material breaks through the brown masses without offsets. Many chrysocolla lapidary items are stabilized to improve resistance to breaking; the researcher suspects this specimen has been stabilized and intends to check for confirmation. The report ends with the May 18, 2026 date and signature.
Another variation: Copper Silicates
Blue and green copper silicates in a polished heart supplied as Congo material.
Identification: Copper silicates with iron oxides. Specific copper-silicate species were not conclusively resolved.
What the testing revealed
The blue and green portions are copper silicates. Iron oxides, such as goethite or hematite, were also encountered.
X-ray diffraction was inconclusive because the material is poorly crystalline, producing a broad amorphous hump and faint peaks. The report therefore does not confirm shattuckite as the identity of this particular heart.
Soul Body Gems notes that this variation is often mined alongside shattuckite in Congo. That sourcing context explains its inclusion under Shattuckite (Congo); it is separate from laboratory confirmation of its mineral species.
Operating conditions: An AMRAY 1830 SEM operated at 25 kV acceleration potential, 24 mm working distance, 0 degrees sample tilt, coated with 250 Å carbon, and also using the attached XRF unit operated at 30 kV.
A Bruker D2 Phaser X-ray diffractometer was also used in the study and operated at 30 kV and 10 mA.
Fig. 1: Photograph of the specimen. Approximately 55 mm maximum dimension.
Fig.2: Backscattered electron image of an area of the specimen.
Fig. 3: Energy dispersive spectrum of spot 1 in Fig. 2. This is the blue part. (a copper silicate)
Fig. 4: Energy dispersive spectrum of spot 2 in Fig. 2 (iron oxide, such as goethite or hematite)
Fig. 5: Energy dispersive spectrum of spot 3 in Fig. 2. This is the green part. (a copper silicate)
Fig. 6: X-ray map of the area shown in Fig. 2. Copper: blue, silicon: yellow.
Fig. 7: X-ray diffraction scaan of the blue parts in the specimen. Note very poor crystallinity as is evidnet from the amorphous hump.
Summary of findings: This specimen (Fig. 1) is interesting. The blue and green portions are copper silicates (Figs. 2, 3, 5, and 6). Iron ooxides such as goethite or hematite were also encountered (Figs. 2 and 4). X-ray diffraction yielded inconclusive results due to the poor crystallinity of the material. This is evident by the amorphous hump and faint peaks.
Date: 9-25-2024 Signature
Read the original laboratory report as text
The following text and tables are transcribed from the original laboratory document. Figure captions identify the report images; the laboratory interpretations and limitations are preserved.
Laboratory report 1
Analytical Result Report
Sample id: 1204 (blue palm stone)
Submitted by: Soul Body Gems
Date completed: 12-22-2024
Operating conditions: An AMRAY 1830 SEM operated at 25 kV acceleration potential, 24 mm working distance, 0 degrees sample tilt, coated with 250 Å carbon, and also using the attached XRF unit operated at 30 kV.
Fig. 1: Photograph of the specimens. 6cm maximum dimensions.
Fig.2: Backscattered electron image of an area of the specimen.
Fig. 3: Energy dispersive spectrum of spot 1 in Fig. 2. (copper silicate)
Fig. 4: Energy dispersive spectrum of spot 2 in Fig. 2. (copper silicate)
Fig. 5: Energy dispersive spectrum of spot 4 in Fig. 2 (dolomite).
Summary of findings: This specimen (Fig. 1) contains copper silicates (Figs. 2-4), such as chrysocolla but there is evidence for shattuckite as well in a dolomite matrix (Figs. 2 and 5). Shattuckite is indicated by several X-ray diffraction lines at 4.43, 2.37 and 3.49 Ångstroms. It also has some chrysocolla diffraction peaks as well, thus it is a mixture. The copper silicates are not well crystallized and are likely partially amorphous.
Date: 12-22-2024 Signature
Laboratory report 2
Analytical Result Report
Sample id: 1565 (#2 chrysocolla )
Submitted by: Soul Body Gems
Date completed: 5-18-2026
Operating conditions: A Bruker Titan X-ray fluorescence spectrometer was used and operated at 10, 25 and 50 kV.
A Bruker D2-Phaser X-ray diffractometer was also used and operated at 30 kV and 10 mA.
Fig. 1: Photograph of the specimen. 7 cm maximum dimension. Close-up of interior on the right.
Table 1: Major and minor elemental composition of the material, in wt. %. From a fresh surface
Laboratory data as recorded in the report
Aluminum
0.5
Calcium
0.3
Copper
31.3
Iron
1.5
Silicon
16.8
Fig. X-ray diffraction scan of the blue material. Quartz pattern overlaid.
Summary of findings: This is an interesting specimen (Fig. 1). Compositionally, (Table 1) shows that it is in the range of typical chrysocolla. X-ray diffraction (Fig. 2) shows that the material is largely amorphous. This is fairly common for chrysocolla, though. The main diffraction peaks are present but weak, there is a small amount of quartz present. The brown fragments appear to be chrysocolla with hematite/goethite, evidently it formed during some brecciation of the deposit. The material breaks though these brown masses without change such as offsets. Many chryscolla lapidary items have been stabilized, the resistance to breaking is enhanced by this procedure and it appears that this has also been done. I will see if I can confirm this.
Date: 5-18-2026 Signature
Laboratory report 3
Analytical Result Report
Sample id: 1073 (#4, shattuckite heart)
Submitted by: Soul Body Gems
Date completed: 9-25-2024
Operating conditions: An AMRAY 1830 SEM operated at 25 kV acceleration potential, 24 mm working distance, 0 degrees sample tilt, coated with 250 Å carbon, and also using the attached XRF unit operated at 30 kV.
A Bruker D2 Phaser X-ray diffractometer was also used in the study and operated at 30 kV and 10 mA.
Fig. 1: Photograph of the specimen. Approximately 55 mm maximum dimension.
Fig.2: Backscattered electron image of an area of the specimen.
Fig. 3: Energy dispersive spectrum of spot 1 in Fig. 2. This is the blue part. (a copper silicate)
Fig. 4: Energy dispersive spectrum of spot 2 in Fig. 2 (iron oxide, such as goethite or hematite)
Fig. 5: Energy dispersive spectrum of spot 3 in Fig. 2. This is the green part. (a copper silicate)
Fig. 6: X-ray map of the area shown in Fig. 2. Copper: blue, silicon: yellow.
Fig. 7: X-ray diffraction scaan of the blue parts in the specimen. Note very poor crystallinity as is evidnet from the amorphous hump.
Summary of findings: This specimen (Fig. 1) is interesting. The blue and green portions are copper silicates (Figs. 2, 3, 5, and 6). Iron ooxides such as goethite or hematite were also encountered (Figs. 2 and 4). X-ray diffraction yielded inconclusive results due to the poor crystallinity of the material. This is evident by the amorphous hump and faint peaks.
Green palm stones photographed for May 2025 Memory Lane
This green palm stone did not arrive with a settled market name. Laboratory examination revealed a mineralized volcanic rock, likely rhyolite, altered by weathering and copper-bearing fluids.
Key finding: Iron oxides, identifiable plagioclase, a copper-bearing mineralized matrix, and kaolinite. Copper imparts the green color.
What the report suggests
The researcher interprets the original rock as likely rhyolite and suggests mineralization from nearby copper-sulfide veins. Pronounced weathering, indicated by kaolinite, likely oxidized primary copper minerals to secondary green species. These are geological interpretations of this specimen; the report does not assign a specific trade name or identify the green copper phase to a single mineral species.
View the original test results
Select any page to enlarge the full laboratory report.
Please credit Soul Body Gems, Alexander Falster, and the Maine Mineral & Gem Museum when referring to these results.
Understanding the report figures
Use this guide alongside the written findings and the original report transcript. It explains the purpose of each analytical figure and preserves the laboratory’s own figure labels. The interpretations apply to the tested specimen; signals alone do not establish the identity of every similar-looking stone.
Electron microscope image: This view shows small-scale regions selected for analysis. Its brightness contrast helps distinguish regions with different compositions; it is not a photograph of their natural colors. Numbered spots connect this view to the analyses listed in the report.
Laboratory figure caption: Fig.2: Backscattered electron image of an area of the specimen.
Elemental spectrum: The peaks record characteristic X-ray signals from elements in the analyzed spot or area. This is an analysis of that location, not automatically of the entire specimen. Any mineral identification or uncertainty named in the laboratory caption is retained below.
Laboratory figure caption: Fig. 3: Energy dispersive spectrum of spot 1 in Fig. 2. (iron oxide with minor copper)
Elemental spectrum: The peaks record characteristic X-ray signals from elements in the analyzed spot or area. This is an analysis of that location, not automatically of the entire specimen. Any mineral identification or uncertainty named in the laboratory caption is retained below.
Laboratory figure caption: Fig. 4: Energy dispersive spectrum of spot 3 in Fig. 2. (plagioclase)
Elemental spectrum: The peaks record characteristic X-ray signals from elements in the analyzed spot or area. This is an analysis of that location, not automatically of the entire specimen. Any mineral identification or uncertainty named in the laboratory caption is retained below.
Laboratory figure caption: Fig. 5: Energy dispersive spectrum of spot 4 in Fig. 2 (copper-bearing mineralized matrix).
Elemental spectrum: The peaks record characteristic X-ray signals from elements in the analyzed spot or area. This is an analysis of that location, not automatically of the entire specimen. Any mineral identification or uncertainty named in the laboratory caption is retained below.
Laboratory figure caption: Fig. 6: Energy dispersive spectrum of spot 5 in Fig. 2 (kaolinite).
Read the report findings as text
Sample 1201 (green palm stone), completed December 21, 2024. The specimen is an iron-oxide-rich mineralized volcanic rock, likely rhyolite, with plagioclase still identifiable. A copper-bearing matrix gives it green color. Kaolinite indicates pronounced weathering. The researcher proposes mineralization from nearby copper-sulfide veins and later oxidation of primary copper minerals.
Read the original laboratory report as text
The following text and tables are transcribed from the original laboratory document. Figure captions identify the report images; the laboratory interpretations and limitations are preserved.
Laboratory report 1
Analytical Result Report
Sample id: 1201 (green palm stone)
Submitted by: Soul Body Gems
Date completed: 12-21-2024
Operating conditions: An AMRAY 1830 SEM operated at 25 kV acceleration potential, 24 mm working distance, 0 degrees sample tilt, coated with 250 Å carbon, and also using the attached XRF unit operated at 30 kV.
Fig. 1: Photograph of the specimens. 7 cm maximum dimensions.
Fig.2: Backscattered electron image of an area of the specimen.
Fig. 3: Energy dispersive spectrum of spot 1 in Fig. 2. (iron oxide with minor copper)
Fig. 4: Energy dispersive spectrum of spot 3 in Fig. 2. (plagioclase)
Fig. 5: Energy dispersive spectrum of spot 4 in Fig. 2 (copper-bearing mineralized matrix).
Fig. 6: Energy dispersive spectrum of spot 5 in Fig. 2 (kaolinite).
Summary of findings: This specimen (Fig. 1) is a mineralized volcanic rock, with lots of iron oxides (Figs. 2 and 3) likely a rhyolite with plagioclase still identifiable (Figs. 2 and 4). which has undergone mineralization likely derived from a nearby copper-sulfide vein or veins (Figs. 2 and 5). It is the copper that imparts the green color. The presence of kaolinite (Figs. 2 and 6) indicates pronounced weathering effects, this also would include oxidation of primary copper minerals to secondary species which impart the green color.
Key finding: The material is typical of jasper. The researcher considers replacement of rhyolite a likely origin, supported by the aluminum content and traces of potassium.
Locality: Australia, according to Soul Body Gems sourcing information.
What the colors reveal
The dark brown area of the heart-shaped specimen had the highest iron content (6.1 wt.%); its gray area had the lowest (0.25 wt.%). The elongated specimen was compositionally intermediate, with 2.32 wt.% iron. These are measurements of the submitted specimens.
These results are the property of Soul Body Gems, Alexander Falster, and the Maine Mineral & Gem Museum. Any mention requires full acknowledgment.
Read the report findings and table as text
Sample 1571 (#1 outback jasper), submitted by Soul Body Gems, completed June 2, 2026. A Bruker Titan X-ray fluorescence spectrometer operated at 10, 25, and 50 kV. A Bruker D2-Phaser X-ray diffractometer operated at 30 kV and 10 mA. Figure 1 shows a heart-shaped specimen and an elongated specimen, with an 8 cm maximum dimension.
Major and minor elemental composition as reported, in wt.%
Element
Heart dark brown
Heart gray part
Elongated specimen
Aluminum
1.63
2.81
1.97
Calcium
0.03
0.01
0.03
Iron
6.1
0.25
2.32
Manganese
0.11
0.03
0.06
Potassium
0.02
nd
0.02
Silicon
93.32
96.74
95.78
“nd” is retained from the original table. The dark brown portion of the heart-shaped specimen has the highest iron content; the gray portions have the lowest. The elongated specimen is compositionally intermediate. The material is typical for jasper. The researcher suggests that the jasper likely formed through replacement of rhyolite, supported by elevated aluminum and potassium traces. Page 2 contains the date and signature.
Read the original laboratory report as text
The following text and tables are transcribed from the original laboratory document. Figure captions identify the report images; the laboratory interpretations and limitations are preserved.
Laboratory report 1
Analytical Result Report
Sample id: 1571 (#1 outback jasper)
Submitted by: Soul Body Gems
Date completed: 6-2-2026
Operating conditions: A Bruker Titan X-ray fluorescence spectrometer was used and operated at 10, 25 and 50 kV.
A Bruker D2-Phaser X-ray diffractometer was also used and operated at 30 kV and 10 mA.
Fig. 1: Photograph of the specimens. 8 cm maximum dimension.
Table 1: Major and minor elemental composition of the material, in wt. %.
Laboratory data as recorded in the report
Heart dark brown
Heart gray part
Elongated specimen
Aluminum
1.63
2.81
1.97
Calcium
0.03
0.01
0.03
Iron
6.1
0.25
2.32
Manganese
0.11
0.03
0.06
Potassium
0.02
nd
0.02
Silicon
93.32
96.74
95.78
Summary of findings: These are interesting specimen2 (Fig. 1). The dark brown portion in the heart-shaped specimen has the highest iron content and the lowest iron content is in the gray portions (Table 1). The elongated specimen is composionally intermediate between the two areas of the heart-shaped one. The material is typical for jasper. It is likely that this jasper formed from replacement of rhyolite, the elevated aluminum and potassium traces support this assumption.
The photograph shows Lepidolite Tourmaline towers from our collection. The laboratory tested a sphere, sample 10514; the original sphere photograph appears in the report below.
A unique Brazilian find bringing together green tourmaline and contrasting mica and feldspar.
Identification: Green elbaite tourmaline, lepidolite, muscovite, and albite.
Locality: Brazil, according to Soul Body Gems sourcing information.
What the testing revealed
The report identifies both lepidolite and muscovite in this specimen. The green elbaite tourmaline contains more iron than manganese, and the plagioclase feldspar is albite.
The researcher describes the specimen as derived from a fractionated granitic pegmatite. The lepidolite is slightly more fractionated than the muscovite, particularly in its rubidium content.
These results are the property of Soul Body Gems, Alexander Falster, and the Maine Mineral & Gem Museum. Any mention requires full acknowledgment.
Understanding the report figures
Use this guide alongside the written findings and the original report transcript. It explains the purpose of each analytical figure and preserves the laboratory’s own figure labels. The interpretations apply to the tested specimen; signals alone do not establish the identity of every similar-looking stone.
Electron microscope image: This view shows small-scale regions selected for analysis. Its brightness contrast helps distinguish regions with different compositions; it is not a photograph of their natural colors. Numbered spots connect this view to the analyses listed in the report.
Laboratory figure caption: Fig.2: Backscattered electron image of an area of the specimen.
Elemental spectrum: The peaks record characteristic X-ray signals from elements in the analyzed spot or area. This is an analysis of that location, not automatically of the entire specimen. Any mineral identification or uncertainty named in the laboratory caption is retained below.
Laboratory figure caption: Fig. 3: Energy dispersive spectrum of spot 1 in Fig. 2 (tourmaline - elbaite)
Elemental spectrum: The peaks record characteristic X-ray signals from elements in the analyzed spot or area. This is an analysis of that location, not automatically of the entire specimen. Any mineral identification or uncertainty named in the laboratory caption is retained below.
Laboratory figure caption: Fig. 4: Energy dispersive spectrum of spot 2 in Fig. 2 (lepidolite)
Elemental spectrum: The peaks record characteristic X-ray signals from elements in the analyzed spot or area. This is an analysis of that location, not automatically of the entire specimen. Any mineral identification or uncertainty named in the laboratory caption is retained below.
Laboratory figure caption: Fig. 6: Energy dispersive spectrum of spot 3 in Fig. 2 (muscovite)
Elemental spectrum: The peaks record characteristic X-ray signals from elements in the analyzed spot or area. This is an analysis of that location, not automatically of the entire specimen. Any mineral identification or uncertainty named in the laboratory caption is retained below.
Laboratory figure caption: Fig. 7: Energy dispersive spectrum of spot 4 in Fig. 2 (albite)
Element map: This map shows where the named elements occur within the analyzed area. Its colors represent the laboratory’s selected element channels, rather than the specimen’s visible colors. The caption below preserves any color key or distribution noted by the laboratory.
Laboratory figure caption: Fig. 8: X-ray map of the area shown in Fig. 2. Sodium: yellow, potassium: purple, iron: green.
Read the report findings and table as text
Analytical Result Report. Sample id: 10514 (recent package #2). Submitted by Soul Body Gems. Date completed: March 21, 2024.
Operating conditions: An AMRAY 1830 scanning electron microscope operated at 25 kV acceleration potential, 24 mm working distance, and 0 degrees sample tilt. The sample was coated with 250 Å carbon. The attached X-ray fluorescence unit operated at 30 kV. A BRUKER Titan X-ray fluorescence spectrometer was also used, operated for 30 seconds at 50, 25, and 10 kV.
Figure 1: Photograph of the sphere, approximately 60 mm maximum dimension.
Figure 8: X-ray map with sodium in yellow, potassium in purple, and iron in green.
Table 1: Trace and minor elements in lepidolite and muscovite. Values reproduced as reported; units are not specified in the table.
Element
Lepidolite
Muscovite
Iron
0.04
0.22
Manganese
0.32
0.12
Rubidium
0.48
0.34
Sodium
0.77
0.65
Summary: The green tourmaline (elbaite) contains more iron than manganese. Both lepidolite and muscovite occur in the specimen. The lepidolite is a little more fractionated than the muscovite, notably in rubidium content. The plagioclase is albite. The specimen is derived from a fractionated granitic pegmatite. The report concludes with the March 21, 2024 date and signature.
Read the original laboratory report as text
The following text and tables are transcribed from the original laboratory document. Figure captions identify the report images; the laboratory interpretations and limitations are preserved.
Laboratory report 1
Analytical Result Report
Sample id: 10514 (recent package #2)
Submitted by: Soul Body Gems
Date completed: 3-21-2024
Operating conditions: An AMRAY 1830 SEM operated at 25 kV acceleration potential, 24 mm working distance, 0 degrees sample tilt, coated with 250 Å carbon, and also using the attached XRF unit operated at 30 kV.
A BRUKER Titan X-ray fluorescence spectrometer was also used and operated for 30 seconds at 50, 25, and 10 kV.
Fig. 1: Photograph of the specimen. Approximately 60 mm maximum dimension.
Fig.2: Backscattered electron image of an area of the specimen.
Fig. 3: Energy dispersive spectrum of spot 1 in Fig. 2 (tourmaline - elbaite)
Fig. 4: Energy dispersive spectrum of spot 2 in Fig. 2 (lepidolite)
Fig. 6: Energy dispersive spectrum of spot 3 in Fig. 2 (muscovite)
Fig. 7: Energy dispersive spectrum of spot 4 in Fig. 2 (albite)
Fig. 8: X-ray map of the area shown in Fig. 2. Sodium: yellow, potassium: purple, iron: green.
Table 1: Trace and minor elements in lepidolite and muscovite in the specimen.
Laboratory data as recorded in the report
lepidolite
muscovite
Iron
0.04
0.22
Manganese
0.32
0.12
Rubidium
0.48
0.34
Sodium
0.77
0.65
Summary of findings: This specimen (Fig. 1) is very interesting one: the tourmaline (elbaite) (Figs. 2, 3 and 8) is green and contains more iron than manganese. Both lepidolite (Figs. 2 and 4) and muscovite (Figs. 2 and 5) occur in the specimen. Table 1 shows the differences in trace element and minor elements. The lepidolite overall is a little more fractionated than the muscovite, notably seen in the rubidium content. The plagioclase is an albite (Figs. 2 and 7). This sample was derived from a fractionated granitic pegmatite.
This African material was sold as African Turquoise, but testing found no turquoise in the submitted specimen.
Sample: 10523 (#2, April 2024) · Completed: April 19, 2024.
Identified: Chlorite-group clay, albite, grossular-dominant garnet, and quartz.
Locality: Africa; the country is unknown.
Why it is not turquoise
Copper was detected, but phosphorus was not. The report concludes that no turquoise is present. The copper mineralization is disseminated and may be chrysocolla or another secondary copper mineral; chrysocolla was not conclusively identified.
This material appears in the directory as both African Turquoise 2 and Chrysocolla Clay (Africa), with the same report attached to each name. It is separate from our earlier African Turquoise entry.
These results are the property of Soul Body Gems, Alexander Falster, and the Maine Mineral & Gem Museum. Any mention requires full acknowledgment.
Understanding the report figures
Use this guide alongside the written findings and the original report transcript. It explains the purpose of each analytical figure and preserves the laboratory’s own figure labels. The interpretations apply to the tested specimen; signals alone do not establish the identity of every similar-looking stone.
Electron microscope image: This view shows small-scale regions selected for analysis. Its brightness contrast helps distinguish regions with different compositions; it is not a photograph of their natural colors. Numbered spots connect this view to the analyses listed in the report.
Laboratory figure caption: Fig.2: Backscattered electron image of an area of the specimen.
Elemental spectrum: The peaks record characteristic X-ray signals from elements in the analyzed spot or area. This is an analysis of that location, not automatically of the entire specimen. Any mineral identification or uncertainty named in the laboratory caption is retained below.
Laboratory figure caption: Fig. 3: Energy dispersive spectrum of spot 1 in Fig. 2 (chlorite group species)
Elemental spectrum: The peaks record characteristic X-ray signals from elements in the analyzed spot or area. This is an analysis of that location, not automatically of the entire specimen. Any mineral identification or uncertainty named in the laboratory caption is retained below.
Laboratory figure caption: Fig. 4: Energy dispersive spectrum of spot 5 in Fig. 2 (albite)
Elemental spectrum: The peaks record characteristic X-ray signals from elements in the analyzed spot or area. This is an analysis of that location, not automatically of the entire specimen. Any mineral identification or uncertainty named in the laboratory caption is retained below.
Laboratory figure caption: Fig. 5: Energy dispersive spectrum of spot 5 in Fig. 2 (garnet group, grossular dominant)
Element map: This map shows where the named elements occur within the analyzed area. Its colors represent the laboratory’s selected element channels, rather than the specimen’s visible colors. The caption below preserves any color key or distribution noted by the laboratory.
Laboratory figure caption: Fig. 6: X-ray map of the area shown in Fig. 2. Left: Magnesium: red, calcium: blue, iron: green. Right: Silicon: red, copper: green. Silicon: yellow, calcium: blue.
Read the report findings and table as text
Analytical Result Report. Sample 10523 (#2, April 2024), submitted by Soul Body Gems. Completed April 19, 2024.
An AMRAY 1830 SEM operated at 25 kV acceleration potential, 24 mm working distance, and 0 degrees sample tilt. The sample was coated with 250 Å carbon; the attached XRF unit operated at 30 kV. A BRUKER SD2 Phaser X-ray diffractometer operated at 30 kV and 10 mA.
Figure 1: Specimen photograph, approximately 45 mm maximum dimension.
Figure 2: Backscattered electron image of an area of the specimen.
Figure 3: Energy-dispersive spectrum of spot 1, chlorite-group species.
Figure 6: Elemental X-ray maps of the area in Figure 2. The left map labels magnesium red, calcium blue, and iron green. The right-map caption labels silicon red and copper green, then also lists silicon yellow and calcium blue; that inconsistency is retained in the original report.
Table 1: Minor and trace elements in the specimen (wt.%)
Element
Wt.%
Calcium
1.73
Copper
2.22
Iron
3.60
Magnesium
1.00
Manganese
0.06
Phosphorus
nd
Potassium
2.27
Sodium
1.69
Titanium
0.39
Summary: Clay species, identified as a chlorite-group species; clastic albite grains; grossular-dominant garnet; and quartz. Copper is present, but phosphorus was not detected, so no turquoise is present. Copper mineralization appears disseminated and may be chrysocolla or another secondary copper mineral. “nd” is reproduced from the original table. Page 4 includes the April 19, 2024 date and signature.
Read the original laboratory report as text
The following text and tables are transcribed from the original laboratory document. Figure captions identify the report images; the laboratory interpretations and limitations are preserved.
Laboratory report 1
Analytical Result Report
Sample id: 10523 (#2, April 2024)
Submitted by: Soul Body Gems
Date completed: 4-19-2024
Operating conditions: An AMRAY 1830 SEM operated at 25 kV acceleration potential, 24 mm working distance, 0 degrees sample tilt, coated with 250 Å carbon, and also using the attached XRF unit operated at 30 kV.
A BRUKER SD2 Phaser X-ray diffractometer was used and operated at 30 kV and 10 mA..
Fig. 1: Photograph of the specimen. Approximately 45 mm maximum dimension.
Fig.2: Backscattered electron image of an area of the specimen.
Fig. 3: Energy dispersive spectrum of spot 1 in Fig. 2 (chlorite group species)
Fig. 4: Energy dispersive spectrum of spot 5 in Fig. 2 (albite)
Fig. 5: Energy dispersive spectrum of spot 5 in Fig. 2 (garnet group, grossular dominant)
Fig. 6: X-ray map of the area shown in Fig. 2. Left: Magnesium: red, calcium: blue, iron: green. Right: Silicon: red, copper: green. Silicon: yellow, calcium: blue.
Table 1: Minor and trace element in the specimen.
Laboratory data as recorded in the report
Element
Wt. %
Calcium
1.73
Copper
2.22
Iron
3.60
Magnesium
1.00
Manganese
0.06
Phosphorus
nd
Potassium
2.27
Sodium
1.69
Titanium
0.39
Summary of findings: This specimen (Fig. 1) is very pretty. The composition is made up of clay species (Figs. 2 and 3, a chlorite group species), clastic grains of albite (Figs. 2 and 4), garnet, a grossular-dominant member of the garnet group (Figs. 2 and 5), quartz (Figs. 2 and 6, several grains visible). There is some copper present in the sample (Fig 6 ad Table 1 but no phosphorus was detected (Table 1). Thus, no turquoise is present. The copper mineralization appears to be disseminated, it maybe be present as chrysocolla or another secondary copper mineral.
This African material was sold as African Turquoise, but testing found no turquoise in the submitted specimen.
Sample: 10523 (#2, April 2024) · Completed: April 19, 2024.
Identified: Chlorite-group clay, albite, grossular-dominant garnet, and quartz.
Locality: Africa; the country is unknown.
Why it is not turquoise
Copper was detected, but phosphorus was not. The report concludes that no turquoise is present. The copper mineralization is disseminated and may be chrysocolla or another secondary copper mineral; chrysocolla was not conclusively identified.
This material appears in the directory as both African Turquoise 2 and Chrysocolla Clay (Africa), with the same report attached to each name. It is separate from our earlier African Turquoise entry.
These results are the property of Soul Body Gems, Alexander Falster, and the Maine Mineral & Gem Museum. Any mention requires full acknowledgment.
Understanding the report figures
Use this guide alongside the written findings and the original report transcript. It explains the purpose of each analytical figure and preserves the laboratory’s own figure labels. The interpretations apply to the tested specimen; signals alone do not establish the identity of every similar-looking stone.
Electron microscope image: This view shows small-scale regions selected for analysis. Its brightness contrast helps distinguish regions with different compositions; it is not a photograph of their natural colors. Numbered spots connect this view to the analyses listed in the report.
Laboratory figure caption: Fig.2: Backscattered electron image of an area of the specimen.
Elemental spectrum: The peaks record characteristic X-ray signals from elements in the analyzed spot or area. This is an analysis of that location, not automatically of the entire specimen. Any mineral identification or uncertainty named in the laboratory caption is retained below.
Laboratory figure caption: Fig. 3: Energy dispersive spectrum of spot 1 in Fig. 2 (chlorite group species)
Elemental spectrum: The peaks record characteristic X-ray signals from elements in the analyzed spot or area. This is an analysis of that location, not automatically of the entire specimen. Any mineral identification or uncertainty named in the laboratory caption is retained below.
Laboratory figure caption: Fig. 4: Energy dispersive spectrum of spot 5 in Fig. 2 (albite)
Elemental spectrum: The peaks record characteristic X-ray signals from elements in the analyzed spot or area. This is an analysis of that location, not automatically of the entire specimen. Any mineral identification or uncertainty named in the laboratory caption is retained below.
Laboratory figure caption: Fig. 5: Energy dispersive spectrum of spot 5 in Fig. 2 (garnet group, grossular dominant)
Element map: This map shows where the named elements occur within the analyzed area. Its colors represent the laboratory’s selected element channels, rather than the specimen’s visible colors. The caption below preserves any color key or distribution noted by the laboratory.
Laboratory figure caption: Fig. 6: X-ray map of the area shown in Fig. 2. Left: Magnesium: red, calcium: blue, iron: green. Right: Silicon: red, copper: green. Silicon: yellow, calcium: blue.
Read the report findings and table as text
Analytical Result Report. Sample 10523 (#2, April 2024), submitted by Soul Body Gems. Completed April 19, 2024.
An AMRAY 1830 SEM operated at 25 kV acceleration potential, 24 mm working distance, and 0 degrees sample tilt. The sample was coated with 250 Å carbon; the attached XRF unit operated at 30 kV. A BRUKER SD2 Phaser X-ray diffractometer operated at 30 kV and 10 mA.
Figure 1: Specimen photograph, approximately 45 mm maximum dimension.
Figure 2: Backscattered electron image of an area of the specimen.
Figure 3: Energy-dispersive spectrum of spot 1, chlorite-group species.
Figure 6: Elemental X-ray maps of the area in Figure 2. The left map labels magnesium red, calcium blue, and iron green. The right-map caption labels silicon red and copper green, then also lists silicon yellow and calcium blue; that inconsistency is retained in the original report.
Table 1: Minor and trace elements in the specimen (wt.%)
Element
Wt.%
Calcium
1.73
Copper
2.22
Iron
3.60
Magnesium
1.00
Manganese
0.06
Phosphorus
nd
Potassium
2.27
Sodium
1.69
Titanium
0.39
Summary: Clay species, identified as a chlorite-group species; clastic albite grains; grossular-dominant garnet; and quartz. Copper is present, but phosphorus was not detected, so no turquoise is present. Copper mineralization appears disseminated and may be chrysocolla or another secondary copper mineral. “nd” is reproduced from the original table. Page 4 includes the April 19, 2024 date and signature.
Read the original laboratory report as text
The following text and tables are transcribed from the original laboratory document. Figure captions identify the report images; the laboratory interpretations and limitations are preserved.
Laboratory report 1
Analytical Result Report
Sample id: 10523 (#2, April 2024)
Submitted by: Soul Body Gems
Date completed: 4-19-2024
Operating conditions: An AMRAY 1830 SEM operated at 25 kV acceleration potential, 24 mm working distance, 0 degrees sample tilt, coated with 250 Å carbon, and also using the attached XRF unit operated at 30 kV.
A BRUKER SD2 Phaser X-ray diffractometer was used and operated at 30 kV and 10 mA..
Fig. 1: Photograph of the specimen. Approximately 45 mm maximum dimension.
Fig.2: Backscattered electron image of an area of the specimen.
Fig. 3: Energy dispersive spectrum of spot 1 in Fig. 2 (chlorite group species)
Fig. 4: Energy dispersive spectrum of spot 5 in Fig. 2 (albite)
Fig. 5: Energy dispersive spectrum of spot 5 in Fig. 2 (garnet group, grossular dominant)
Fig. 6: X-ray map of the area shown in Fig. 2. Left: Magnesium: red, calcium: blue, iron: green. Right: Silicon: red, copper: green. Silicon: yellow, calcium: blue.
Table 1: Minor and trace element in the specimen.
Laboratory data as recorded in the report
Element
Wt. %
Calcium
1.73
Copper
2.22
Iron
3.60
Magnesium
1.00
Manganese
0.06
Phosphorus
nd
Potassium
2.27
Sodium
1.69
Titanium
0.39
Summary of findings: This specimen (Fig. 1) is very pretty. The composition is made up of clay species (Figs. 2 and 3, a chlorite group species), clastic grains of albite (Figs. 2 and 4), garnet, a grossular-dominant member of the garnet group (Figs. 2 and 5), quartz (Figs. 2 and 6, several grains visible). There is some copper present in the sample (Fig 6 ad Table 1 but no phosphorus was detected (Table 1). Thus, no turquoise is present. The copper mineralization appears to be disseminated, it maybe be present as chrysocolla or another secondary copper mineral.
Congo material supplied as chrysocolla shattuckite, tested to clarify its identity.
Sample: 1565 (#2 chrysocolla) · Completed: May 18, 2026.
Finding: Composition in the range of typical chrysocolla, largely amorphous, with a small amount of quartz. Shattuckite was not identified in this report.
Locality: Congo, according to Soul Body Gems sourcing information. This material was originally supplied to us as chrysocolla shattuckite.
The brown fragments appear to be chrysocolla with hematite/goethite, formed during brecciation of the deposit. The researcher also suspects stabilization but states that confirmation is still needed; this report does not establish it conclusively.
These results are the property of Soul Body Gems, Alexander Falster, and the Maine Mineral & Gem Museum. Any mention requires full acknowledgment.
Understanding the report figures
Use this guide alongside the written findings and the original report transcript. It explains the purpose of each analytical figure and preserves the laboratory’s own figure labels. The interpretations apply to the tested specimen; signals alone do not establish the identity of every similar-looking stone.
Diffraction scan: This scan helps identify crystalline minerals by comparing the measured pattern with reference patterns. The laboratory interpretation explains which minerals the comparison supports.
Laboratory figure caption: Figure 1 shows the specimen, 7 cm maximum dimension, with a close-up of the interior on the right. The X-ray diffraction scan of the blue material has the quartz pattern overlaid.
Read the report findings and table as text
Sample 1565 (#2 chrysocolla), submitted by Soul Body Gems, completed May 18, 2026. A Bruker Titan X-ray fluorescence spectrometer operated at 10, 25, and 50 kV. A Bruker D2-Phaser X-ray diffractometer operated at 30 kV and 10 mA.
Figure 1 shows the specimen, 7 cm maximum dimension, with a close-up of the interior on the right. The X-ray diffraction scan of the blue material has the quartz pattern overlaid.
Table 1: Major and minor elemental composition from a fresh surface, in wt.%
Element
Wt.%
Aluminum
0.5
Calcium
0.3
Copper
31.3
Iron
1.5
Silicon
16.8
Summary: The composition falls in the range of typical chrysocolla. X-ray diffraction shows largely amorphous material, fairly common for chrysocolla. Main diffraction peaks are present but weak, with a small amount of quartz. Brown fragments appear to be chrysocolla with hematite/goethite, evidently formed during brecciation. The material breaks through the brown masses without offsets. Many chrysocolla lapidary items are stabilized to improve resistance to breaking; the researcher suspects this specimen has been stabilized and intends to check for confirmation. The report ends with the May 18, 2026 date and signature.
Read the original laboratory report as text
The following text and tables are transcribed from the original laboratory document. Figure captions identify the report images; the laboratory interpretations and limitations are preserved.
Laboratory report 1
Analytical Result Report
Sample id: 1565 (#2 chrysocolla )
Submitted by: Soul Body Gems
Date completed: 5-18-2026
Operating conditions: A Bruker Titan X-ray fluorescence spectrometer was used and operated at 10, 25 and 50 kV.
A Bruker D2-Phaser X-ray diffractometer was also used and operated at 30 kV and 10 mA.
Fig. 1: Photograph of the specimen. 7 cm maximum dimension. Close-up of interior on the right.
Table 1: Major and minor elemental composition of the material, in wt. %. From a fresh surface
Laboratory data as recorded in the report
Aluminum
0.5
Calcium
0.3
Copper
31.3
Iron
1.5
Silicon
16.8
Fig. X-ray diffraction scan of the blue material. Quartz pattern overlaid.
Summary of findings: This is an interesting specimen (Fig. 1). Compositionally, (Table 1) shows that it is in the range of typical chrysocolla. X-ray diffraction (Fig. 2) shows that the material is largely amorphous. This is fairly common for chrysocolla, though. The main diffraction peaks are present but weak, there is a small amount of quartz present. The brown fragments appear to be chrysocolla with hematite/goethite, evidently it formed during some brecciation of the deposit. The material breaks though these brown masses without change such as offsets. Many chryscolla lapidary items have been stabilized, the resistance to breaking is enhanced by this procedure and it appears that this has also been done. I will see if I can confirm this.
Date: 5-18-2026 Signature
A Brazilian sphere containing almandine-dominant garnet associated with quartz and muscovite.
Sample: 1079 (#2, Brazilian sphere) · Completed: September 26, 2024.
Identified: Almandine-dominant garnet, muscovite, quartz, and a small monazite-group grain, likely monazite-(Ce).
Locality: Brazil, according to Soul Body Gems sourcing information.
Inside the sphere
The rounded reddish grains are garnet. Darker grains that were examined as possible tourmaline also proved to be garnet. The researcher considers a granitic pegmatite the likely source of this material.
These results are the property of Soul Body Gems, Alexander Falster, and the Maine Mineral & Gem Museum. Any mention requires full acknowledgment.
Understanding the report figures
Use this guide alongside the written findings and the original report transcript. It explains the purpose of each analytical figure and preserves the laboratory’s own figure labels. The interpretations apply to the tested specimen; signals alone do not establish the identity of every similar-looking stone.
Electron microscope image: This view shows small-scale regions selected for analysis. Its brightness contrast helps distinguish regions with different compositions; it is not a photograph of their natural colors. Numbered spots connect this view to the analyses listed in the report.
Laboratory figure caption: Fig.2: Backscattered electron image of an area of the specimen. (bluish part sticking up)
Elemental spectrum: The peaks record characteristic X-ray signals from elements in the analyzed spot or area. This is an analysis of that location, not automatically of the entire specimen. Any mineral identification or uncertainty named in the laboratory caption is retained below.
Laboratory figure caption: Fig. 3: Energy dispersive spectrum of spot 1 in Fig. 2. (garnet group, almandine dominant)
Elemental spectrum: The peaks record characteristic X-ray signals from elements in the analyzed spot or area. This is an analysis of that location, not automatically of the entire specimen. Any mineral identification or uncertainty named in the laboratory caption is retained below.
Laboratory figure caption: Fig. 4: Energy dispersive spectrum of spot 2 in Fig. 2 (muscovite)
Elemental spectrum: The peaks record characteristic X-ray signals from elements in the analyzed spot or area. This is an analysis of that location, not automatically of the entire specimen. Any mineral identification or uncertainty named in the laboratory caption is retained below.
Laboratory figure caption: Fig. 5: Energy dispersive spectrum of spot 3 in Fig. 2 (quartz)
Electron microscope image: This view shows small-scale regions selected for analysis. Its brightness contrast helps distinguish regions with different compositions; it is not a photograph of their natural colors. Numbered spots connect this view to the analyses listed in the report.
Laboratory figure caption: Fig.6: Backscattered electron image of another area of the specimen. (paler colored portion)
Elemental spectrum: The peaks record characteristic X-ray signals from elements in the analyzed spot or area. This is an analysis of that location, not automatically of the entire specimen. Any mineral identification or uncertainty named in the laboratory caption is retained below.
Laboratory figure caption: Fig. 7: Energy dispersive spectrum of spot 1 in Fig. 5. (monazite group species)
Read the report findings as text
Analytical Result Report. Sample 1079 (#2, Brazilian sphere), submitted by Soul Body Gems, completed September 26, 2024. An AMRAY 1830 SEM operated at 25 kV acceleration potential, 24 mm working distance, and 0 degrees sample tilt. The sample was coated with 250 Å carbon. The attached XRF unit operated at 30 kV.
Figure 1: Specimen photograph, approximately 45 mm maximum dimension.
Figure 2: Backscattered electron image of the bluish portion.
Figure 6: Backscattered electron image of the paler portion.
Figure 7: Energy-dispersive spectrum of a monazite-group species.
Summary: Rounded reddish grains are almandine-dominant garnet. Muscovite and quartz are associated. A small monazite-group grain, likely monazite-(Ce), was found. Dark grains investigated as possible tourmaline all turned out to be garnet. The material likely derives from a granitic pegmatite. The report ends with the September 26, 2024 date and signature.
Read the original laboratory report as text
The following text and tables are transcribed from the original laboratory document. Figure captions identify the report images; the laboratory interpretations and limitations are preserved.
Laboratory report 1
Analytical Result Report
Sample id: 1079 (#2, Brazilian sphere)
Submitted by: Soul Body Gems
Date completed: 9-26-2024
Operating conditions: An AMRAY 1830 SEM operated at 25 kV acceleration potential, 24 mm working distance, 0 degrees sample tilt, coated with 250 Å carbon, and also using the attached XRF unit operated at 30 kV.
Fig. 1: Photograph of the specimen. Approximately 45mm maximum dimension.
Fig.2: Backscattered electron image of an area of the specimen. (bluish part sticking up)
Fig. 3: Energy dispersive spectrum of spot 1 in Fig. 2. (garnet group, almandine dominant)
Fig. 4: Energy dispersive spectrum of spot 2 in Fig. 2 (muscovite)
Fig. 5: Energy dispersive spectrum of spot 3 in Fig. 2 (quartz)
Fig.6: Backscattered electron image of another area of the specimen. (paler colored portion)
Fig. 7: Energy dispersive spectrum of spot 1 in Fig. 5. (monazite group species)
Summary of findings: This specimen (Fig. 1) is very pretty. The rounded reddish grains sre a garnet group species, almandine-dominant *Figs. 2 and 3). Muscovite and quartz are associated (figs. 2, 4 and 5). A small grain of a monazite group species, likely monazite-(Ce), was also found (Figs. 6 and 7). I was checking also he darker grains that have the same size as the garnets, thinking they might be a tourmaline group species but they all turned out to be garnet. This material is likely derived from a granitic pegmatite.
Date: 9-26-2024 Signature
Naturally rainbow-iridescent material from a small pocket discovered in March 2025 in Kladno, Czech Republic.
Soul Body Gems purchased these exceptionally vibrant specimens directly from the miner. The discovery date and sourcing history come from our records.
Sample: 1537 (#2 Czech specimen) · Completed: November 26, 2025.
Identified: Potassium feldspar matrix with an iridescent iron-oxide surface, mainly hematite and possibly some goethite.
The report attributes the iridescence to a surface coating on the iron oxide. Goethite is described as possible, rather than conclusively identified.
These results are the property of Soul Body Gems, Alexander Falster, and the Maine Mineral & Gem Museum. Any mention requires full acknowledgment.
Understanding the report figures
Use this guide alongside the written findings and the original report transcript. It explains the purpose of each analytical figure and preserves the laboratory’s own figure labels. The interpretations apply to the tested specimen; signals alone do not establish the identity of every similar-looking stone.
Electron microscope image: This view shows small-scale regions selected for analysis. Its brightness contrast helps distinguish regions with different compositions; it is not a photograph of their natural colors. Numbered spots connect this view to the analyses listed in the report.
Laboratory figure caption: Fig.2: Backscattered electron image of an area of specimen in Fig. 1.
Elemental spectrum: The peaks record characteristic X-ray signals from elements in the analyzed spot or area. This is an analysis of that location, not automatically of the entire specimen. Any mineral identification or uncertainty named in the laboratory caption is retained below.
Laboratory figure caption: Fig. 3: Energy dispersive spectrum of spot 1 in Fig. 2. (potassium feldspar).
Electron microscope image: This view shows small-scale regions selected for analysis. Its brightness contrast helps distinguish regions with different compositions; it is not a photograph of their natural colors. Numbered spots connect this view to the analyses listed in the report.
Laboratory figure caption: Fig.4: Backscattered electron image of another area of specimen in Fig. 1.
Elemental spectrum: The peaks record characteristic X-ray signals from elements in the analyzed spot or area. This is an analysis of that location, not automatically of the entire specimen. Any mineral identification or uncertainty named in the laboratory caption is retained below.
Laboratory figure caption: Fig. 5: Energy dispersive spectrum of spot 1 in Fig. 4. (iron oxide).
Read the report findings as text
Analytical Result Report. Sample 1537 (#2 Czech specimen), submitted by Soul Body Gems, completed November 26, 2025. An AMRAY 1830 SEM operated at 25 kV acceleration potential, 24 mm working distance, and 0 degrees sample tilt. The specimen was coated with 250 Å carbon, and the attached XRF unit operated at 30 kV.
Figure 1: Specimen photograph, about 4 cm maximum dimension.
Figure 2: Backscattered electron image of one area.
Figure 4: Backscattered electron image of another area.
Figure 5: Energy-dispersive spectrum identifying iron oxide.
Summary: The matrix is potassium feldspar. The iridescent material is an iron oxide, mainly hematite, possibly some goethite as well, with a surface coating giving it its iridescence. The report ends with the November 26, 2025 date and signature.
Read the original laboratory report as text
The following text and tables are transcribed from the original laboratory document. Figure captions identify the report images; the laboratory interpretations and limitations are preserved.
Laboratory report 1
Analytical Result Report
Sample id: 1537 (#2 Czech specimen)
Submitted by: Soul Body Gems
Date completed: 11-26-2025
Operating conditions: An AMRAY 1830 SEM operated at 25 kV acceleration potential, 24 mm working distance, 0 degrees sample tilt, coated with 250 Å carbon, and also using the attached XRF unit operated at 30 kV.
Fig. 1: Photograph of the specimen. About 4 cm in maximum dimension.
Fig.2: Backscattered electron image of an area of specimen in Fig. 1.
Fig. 3: Energy dispersive spectrum of spot 1 in Fig. 2. (potassium feldspar).
Fig.4: Backscattered electron image of another area of specimen in Fig. 1.
Fig. 5: Energy dispersive spectrum of spot 1 in Fig. 4. (iron oxide).
Summary of findings: This is an interesting specimen. The matrix is a potassium feldspar material (Figs. 2 and 3), the iridescent material is an iron oxide, mainly hematite, possibly some goethite as well with a surface coating which gives it the iridescence.
Madagascar material with blue-green grandidierite and an uncommon association of accompanying minerals.
Sample: 1113 (#2 grandidierite) · Completed: November 16, 2024.
Identified: Grandidierite associated with potassium feldspar, chlorapatite, and enstatite/clino-enstatite.
Locality: Madagascar, according to Soul Body Gems sourcing information.
More than one mineral
X-ray diffraction confirms that the blue-green material is grandidierite. The white, reddish, and tan areas are potassium feldspar; lavender to whitish areas are chlorapatite; and enstatite is off-white to tan.
These results are the property of Soul Body Gems, Alexander Falster, and the Maine Mineral & Gem Museum. Any mention requires full acknowledgment.
Understanding the report figures
Use this guide alongside the written findings and the original report transcript. It explains the purpose of each analytical figure and preserves the laboratory’s own figure labels. The interpretations apply to the tested specimen; signals alone do not establish the identity of every similar-looking stone.
Electron microscope image: This view shows small-scale regions selected for analysis. Its brightness contrast helps distinguish regions with different compositions; it is not a photograph of their natural colors. Numbered spots connect this view to the analyses listed in the report.
Laboratory figure caption: Fig.2: Backscattered electron images of an area of one of the specimens.
Elemental spectrum: The peaks record characteristic X-ray signals from elements in the analyzed spot or area. This is an analysis of that location, not automatically of the entire specimen. Any mineral identification or uncertainty named in the laboratory caption is retained below.
Laboratory figure caption: Fig. 3: Energy dispersive spectrum of spot 1 in Fig. 2. (likely grandidierite)
Elemental spectrum: The peaks record characteristic X-ray signals from elements in the analyzed spot or area. This is an analysis of that location, not automatically of the entire specimen. Any mineral identification or uncertainty named in the laboratory caption is retained below.
Laboratory figure caption: Fig. 4: Energy dispersive spectrum of spot 2 in Fig. 2 (potassium feldspar)
Electron microscope image: This view shows small-scale regions selected for analysis. Its brightness contrast helps distinguish regions with different compositions; it is not a photograph of their natural colors. Numbered spots connect this view to the analyses listed in the report.
Laboratory figure caption: Fig.5: Backscattered electron images of an area of another of the specimens.
Elemental spectrum: The peaks record characteristic X-ray signals from elements in the analyzed spot or area. This is an analysis of that location, not automatically of the entire specimen. Any mineral identification or uncertainty named in the laboratory caption is retained below.
Laboratory figure caption: Fig. 6: Energy dispersive spectrum of spot 1 in Fig. 5. (grandidierite)
Elemental spectrum: The peaks record characteristic X-ray signals from elements in the analyzed spot or area. This is an analysis of that location, not automatically of the entire specimen. Any mineral identification or uncertainty named in the laboratory caption is retained below.
Laboratory figure caption: Fig. 7: Energy dispersive spectrum of spot 2 in Fig. 5 (chlorapatite)
Electron microscope image: This view shows small-scale regions selected for analysis. Its brightness contrast helps distinguish regions with different compositions; it is not a photograph of their natural colors. Numbered spots connect this view to the analyses listed in the report.
Laboratory figure caption: Fig.8: Backscattered electron images of an area of another of the specimens.
Elemental spectrum: The peaks record characteristic X-ray signals from elements in the analyzed spot or area. This is an analysis of that location, not automatically of the entire specimen. Any mineral identification or uncertainty named in the laboratory caption is retained below.
Laboratory figure caption: Fig. 9: Energy dispersive spectrum of spot 1 in Fig. 8 (enstatite ?)
Diffraction scan: This scan helps identify crystalline minerals by comparing the measured pattern with reference patterns. The laboratory interpretation explains which minerals the comparison supports.
Laboratory figure caption: Fig. 10: X-ray diffraction scan of the blue-green portion with matching reference stick pattern for grandidierite.
Read the report findings as text
Analytical Result Report. Sample 1113 (#2 grandidierite), submitted by Soul Body Gems, completed November 16, 2024. An AMRAY 1830 SEM operated at 25 kV acceleration potential, 24 mm working distance, and 0 degrees sample tilt. The specimen was coated with 250 Å carbon, and the attached XRF unit operated at 30 kV. A Bruker D2 Phaser X-ray diffractometer was also used at 30 kV; the source records the current as “10 mmA”.
Figure 1: Photograph of specimens, approximately 30 mm maximum dimension.
Figures 2 and 3: Backscattered electron image and spectrum of likely grandidierite.
Figure 4: Potassium feldspar spectrum.
Figures 5 and 6: Another area and grandidierite spectrum.
Figure 7: Chlorapatite spectrum.
Figures 8 and 9: Another area and possible enstatite spectrum.
Figure 10: X-ray diffraction scan of the blue-green portion with matching grandidierite reference pattern.
Summary: Blue-green material is grandidierite, confirmed by X-ray diffraction. It is associated with potassium feldspar, chlorapatite, and enstatite/clino-enstatite. Blue-green areas are grandidierite, white to reddish and tan areas potassium feldspar, lavender to whitish areas chlorapatite, and off-white to tan areas enstatite. The researcher describes an uncommon mineral association. The report ends with the November 16, 2024 date and signature.
Read the original laboratory report as text
The following text and tables are transcribed from the original laboratory document. Figure captions identify the report images; the laboratory interpretations and limitations are preserved.
Laboratory report 1
Analytical Result Report
Sample id: 1113 (#2 grandidierite)
Submitted by: Soul Body Gems
Date completed: 11-16-2024
Operating conditions: An AMRAY 1830 SEM operated at 25 kV acceleration potential, 24 mm working distance, 0 degrees sample tilt, coated with 250 Å carbon, and also using the attached XRF unit operated at 30 kV.
A Bruker D2 Phaser X-ray diffractometer was also used and opperated at 30 kV and 10 mmA.
Fig. 1: Photograph of the specimen. Approximately 30 mm maximum dimension.
2211
Fig.2: Backscattered electron images of an area of one of the specimens.
Fig. 3: Energy dispersive spectrum of spot 1 in Fig. 2. (likely grandidierite)
Fig. 4: Energy dispersive spectrum of spot 2 in Fig. 2 (potassium feldspar)
1122
Fig.5: Backscattered electron images of an area of another of the specimens.
Fig. 6: Energy dispersive spectrum of spot 1 in Fig. 5. (grandidierite)
Fig. 7: Energy dispersive spectrum of spot 2 in Fig. 5 (chlorapatite)
11
Fig.8: Backscattered electron images of an area of another of the specimens.
Fig. 9: Energy dispersive spectrum of spot 1 in Fig. 8 (enstatite ?)
Fig. 10: X-ray diffraction scan of the blue-green portion with matching reference stick pattern for grandidierite.
Summary of findings: This specimen lot (Fig. 1) is very cool! The blue-green material is indeed grandidierite (Figs. 2, 3), 4 and 6 and confirmed by XRD (Fig. 10). It is associated by potassium feldspar (Figs. 2 and 4), chlorapatite (Figs. 5 and 7) and by enstatite/clino-enstatite (Figs. 8 and 9. The blue-green is grandidierite, white to reddish and tan is potassium feldspar, lavender to whitish is chlorapatite and enstatite is off-white to tan. A rather uncommon mineral association!
Grandidierite Round Sphere SS Bracelets · Soul Body Gems, December 2024.
Mexican material sold as Palomino Turquoise, identified by testing as a phosphate-mineral mixture rather than turquoise.
Sample: 1573 (#2 palimino turquoise from Mexico) · Completed: June 2, 2026.
Identified: Overite, variscite, and metavariscite.
Locality: Mexico.
Why the trade name is misleading
X-ray diffraction matches a mixture of overite, variscite, and metavariscite. The copper content is very low, and the report concludes that the stone is not turquoise.
This report is shared by the Palomino Turquoise and Variscite (Mexico) entries. The latter name helps visitors find the identified material, while the full result records all three phosphate minerals.
These results are the property of Soul Body Gems, Alexander Falster, and the Maine Mineral & Gem Museum. Any mention requires full acknowledgment.
Understanding the report figures
Use this guide alongside the written findings and the original report transcript. It explains the purpose of each analytical figure and preserves the laboratory’s own figure labels. The interpretations apply to the tested specimen; signals alone do not establish the identity of every similar-looking stone.
Diffraction scan: This scan helps identify crystalline minerals by comparing the measured pattern with reference patterns. The laboratory interpretation explains which minerals the comparison supports.
Laboratory figure caption: Figure 1 photographs a ring with a stone about 1 cm maximum dimension. Figure 2 is an X-ray diffraction scan with reference patterns overlaid.
Diffraction scan: This scan helps identify crystalline minerals by comparing the measured pattern with reference patterns. The laboratory interpretation explains which minerals the comparison supports.
Laboratory figure caption: Fig. 2: X-ray diffraction scan of the specimen with reference stick pattern overlay.
Read the report findings and table as text
Analytical Result Report. Sample 1573 (#2 palimino turquoise from Mexico), submitted by Soul Body Gems, completed June 2, 2026. A Bruker Titan X-ray fluorescence spectrometer operated at 10, 25, and 50 kV. A Bruker D2-Phaser X-ray diffractometer operated at 30 kV and 10 mA.
Figure 1 photographs a ring with a stone about 1 cm maximum dimension. Figure 2 is an X-ray diffraction scan with reference patterns overlaid.
Table 1: Major and minor elemental composition, in wt.%
Element
Wt.%
Aluminum
11.4
Calcium
9.45
Copper
0.07
Iron
0.06
Magnesium
5.43
Manganese
0.10
Phosphorus
17.88
Summary: The stone is essentially an aluminum phosphate with calcium and magnesium as main components. X-ray diffraction matches overite, variscite, and metavariscite. It is not turquoise; copper content is very low, insufficient to give any bluish color. The report describes the ring metal as sterling silver, measured at 95% silver with the remainder mainly copper. The report ends with the June 2, 2026 date and signature.
Read the original laboratory report as text
The following text and tables are transcribed from the original laboratory document. Figure captions identify the report images; the laboratory interpretations and limitations are preserved.
Laboratory report 1
Analytical Result Report
Sample id: 1573 (#2 palimino turquoise from Mexico)
Submitted by: Soul Body Gems
Date completed: 6-2-2026
Operating conditions: A Bruker Titan X-ray fluorescence spectrometer was used and operated at 10, 25 and 50 kV.
A Bruker D2-Phaser X-ray diffractometer was also used and operated at 30 kV and 10 mA.
Fig. 1: Photograph of the specimens. The stone is about 1 cmin maximum dimension.
Table 1: Major and minor elemental composition of the material, in wt. %.
Laboratory data as recorded in the report
Aluminum
11.4
Calcium
9.45
Copper
0.07
Iron
0.06
Magnesium
5.43
Manganese
0.10
Phosphorus
17.88
Fig. 2: X-ray diffraction scan of the specimen with reference stick pattern overlay.
Summary of findings: This is a pretty specimen. The composition shows that the stone is essentially an aluminum phosphate with calcium and magnesium as main components. X-ray diffraction shows good matches for a mixture of overite, variscite and metavariscite. It is not turquoise, the copper content is very low, not enough to give it any bluish color. The metal os the ring is sterling silver with 95% silver, the rest mainly copper.
Date: 6-2-2026 Signature
Mexican material sold as Palomino Turquoise, identified by testing as a phosphate-mineral mixture rather than turquoise.
Sample: 1573 (#2 palimino turquoise from Mexico) · Completed: June 2, 2026.
Identified: Overite, variscite, and metavariscite.
Locality: Mexico.
Why the trade name is misleading
X-ray diffraction matches a mixture of overite, variscite, and metavariscite. The copper content is very low, and the report concludes that the stone is not turquoise.
This report is shared by the Palomino Turquoise and Variscite (Mexico) entries. The latter name helps visitors find the identified material, while the full result records all three phosphate minerals.
These results are the property of Soul Body Gems, Alexander Falster, and the Maine Mineral & Gem Museum. Any mention requires full acknowledgment.
Understanding the report figures
Use this guide alongside the written findings and the original report transcript. It explains the purpose of each analytical figure and preserves the laboratory’s own figure labels. The interpretations apply to the tested specimen; signals alone do not establish the identity of every similar-looking stone.
Diffraction scan: This scan helps identify crystalline minerals by comparing the measured pattern with reference patterns. The laboratory interpretation explains which minerals the comparison supports.
Laboratory figure caption: Figure 1 photographs a ring with a stone about 1 cm maximum dimension. Figure 2 is an X-ray diffraction scan with reference patterns overlaid.
Diffraction scan: This scan helps identify crystalline minerals by comparing the measured pattern with reference patterns. The laboratory interpretation explains which minerals the comparison supports.
Laboratory figure caption: Fig. 2: X-ray diffraction scan of the specimen with reference stick pattern overlay.
Read the report findings and table as text
Analytical Result Report. Sample 1573 (#2 palimino turquoise from Mexico), submitted by Soul Body Gems, completed June 2, 2026. A Bruker Titan X-ray fluorescence spectrometer operated at 10, 25, and 50 kV. A Bruker D2-Phaser X-ray diffractometer operated at 30 kV and 10 mA.
Figure 1 photographs a ring with a stone about 1 cm maximum dimension. Figure 2 is an X-ray diffraction scan with reference patterns overlaid.
Table 1: Major and minor elemental composition, in wt.%
Element
Wt.%
Aluminum
11.4
Calcium
9.45
Copper
0.07
Iron
0.06
Magnesium
5.43
Manganese
0.10
Phosphorus
17.88
Summary: The stone is essentially an aluminum phosphate with calcium and magnesium as main components. X-ray diffraction matches overite, variscite, and metavariscite. It is not turquoise; copper content is very low, insufficient to give any bluish color. The report describes the ring metal as sterling silver, measured at 95% silver with the remainder mainly copper. The report ends with the June 2, 2026 date and signature.
Read the original laboratory report as text
The following text and tables are transcribed from the original laboratory document. Figure captions identify the report images; the laboratory interpretations and limitations are preserved.
Laboratory report 1
Analytical Result Report
Sample id: 1573 (#2 palimino turquoise from Mexico)
Submitted by: Soul Body Gems
Date completed: 6-2-2026
Operating conditions: A Bruker Titan X-ray fluorescence spectrometer was used and operated at 10, 25 and 50 kV.
A Bruker D2-Phaser X-ray diffractometer was also used and operated at 30 kV and 10 mA.
Fig. 1: Photograph of the specimens. The stone is about 1 cmin maximum dimension.
Table 1: Major and minor elemental composition of the material, in wt. %.
Laboratory data as recorded in the report
Aluminum
11.4
Calcium
9.45
Copper
0.07
Iron
0.06
Magnesium
5.43
Manganese
0.10
Phosphorus
17.88
Fig. 2: X-ray diffraction scan of the specimen with reference stick pattern overlay.
Summary of findings: This is a pretty specimen. The composition shows that the stone is essentially an aluminum phosphate with calcium and magnesium as main components. X-ray diffraction shows good matches for a mixture of overite, variscite and metavariscite. It is not turquoise, the copper content is very low, not enough to give it any bluish color. The metal os the ring is sterling silver with 95% silver, the rest mainly copper.
Supplier background places the recent mining of this material around 2020–2021. Its delicate pastel appearance distinguishes it visually from the familiar pink of rose quartz.
Sample: 1099 (#2, pink quartz) · Completed: October 25, 2024.
Finding: Quartz with feldspar inclusions, on a matrix containing potassium feldspar, quartz, and clay species such as illite. The researcher does not consider it pegmatitic rose quartz.
How this pink quartz formed
The report describes two generations of quartz and a matrix resembling weathered rhyolite. The researcher interprets the crystals as likely formed along veins and fractures in rhyolite. Blocky feldspar inclusions were observed, while the fibrous dumortierite inclusions commonly found in pegmatitic rose quartz were absent.
What may cause the color
The researcher suggests that minor manganese and iron may together account for the pink color. This remains an interpretation, rather than a definitive identification of the color mechanism.
These results are the property of Soul Body Gems, Alexander Falster, and the Maine Mineral & Gem Museum. Any mention requires full acknowledgment.
Understanding the report figures
Use this guide alongside the written findings and the original report transcript. It explains the purpose of each analytical figure and preserves the laboratory’s own figure labels. The interpretations apply to the tested specimen; signals alone do not establish the identity of every similar-looking stone.
Electron microscope image: This view shows small-scale regions selected for analysis. Its brightness contrast helps distinguish regions with different compositions; it is not a photograph of their natural colors. Numbered spots connect this view to the analyses listed in the report.
Laboratory figure caption: Fig.2: Backscattered electron image of an area of the specimen.
Elemental spectrum: The peaks record characteristic X-ray signals from elements in the analyzed spot or area. This is an analysis of that location, not automatically of the entire specimen. Any mineral identification or uncertainty named in the laboratory caption is retained below.
Laboratory figure caption: Fig. 4: Energy dispersive spectrum of spot 1 in Fig. 3. (quartz)
Diffraction scan: This scan helps identify crystalline minerals by comparing the measured pattern with reference patterns. The laboratory interpretation explains which minerals the comparison supports.
Laboratory figure caption: Fig. 5: X-ray diffraction scan of the matrix of the specimen.
Read the report findings and table as text
Analytical Result Report. Sample 1099 (#2, pink quartz), submitted by Soul Body Gems, completed October 25, 2024. An AMRAY 1830 SEM operated at 25 kV acceleration potential, 24 mm working distance, and 0 degrees sample tilt. The specimen was coated with 250 Å carbon, and the attached XRF unit operated at 30 kV. A Bruker D2-Phaser X-ray diffractometer operated at 30 kV and 10 mA.
Figure 1: Photograph of the specimen, approximately 60 mm maximum dimension.
Figure 2: Two sets of quartz petrographic photomicrographs, plane-polarized light on the left and crossed polarizers on the right.
Backscattered electron image of an area of the specimen, also labeled Figure 2 in the source.
Table 1: Trace and minor elements in the quartz, in wt.%
Element
Wt.%
Aluminum
0.75
Iron
0.13
Manganese
0.04
Phosphorus
nd
Titanium
0.07
Summary: Two generations of quartz occur on a crumbly matrix: first-generation crystals several centimeters in maximum dimension, with a second generation up to about 0.5 cm. Their morphology resembles hydrothermal vein quartz, without the pronounced growth ridges common in pegmatitic rose quartz crystals. Crushed grains show abundant blocky feldspar inclusions but no fibrous dumortierite inclusions. Minor aluminum, iron, manganese, and titanium occur; phosphorus was not detected.
The matrix is mainly potassium feldspar, apparently a less well-ordered type such as sanidine or orthoclase rather than microcline. Quartz and clay species such as illite were detected. The weathered matrix resembles rhyolite; the quartz likely formed along veins and fractures in rhyolite. Pink color is likely caused by combined minor manganese and iron. The researcher does not believe this is pegmatitic rose quartz. “nd” is retained from the original table. The report ends with the October 25, 2024 date and signature.
Read the original laboratory report as text
The following text and tables are transcribed from the original laboratory document. Figure captions identify the report images; the laboratory interpretations and limitations are preserved.
Laboratory report 1
Analytical Result Report
Sample id: 1099 (#2, pink quartz)
Submitted by: Soul Body Gems
Date completed: 10-25-2024
Operating conditions: An AMRAY 1830 SEM operated at 25 kV acceleration potential, 24 mm working distance, 0 degrees sample tilt, coated with 250 Å carbon, and also using the attached XRF unit operated at 30 kV.
A Brukker D2 Phaser X-ray diffractometer was also used and operated at 30 kV and 10 mA.
Fig. 1: Photograph of the specimen. Approximately 60 mm maximum dimension.
Fig. 2: Two sets of petrographic photomicrographs of grains of the quartz. Left: plane polarized light, right: crossed Nichols.
Fig.2: Backscattered electron image of an area of the specimen.
Fig. 4: Energy dispersive spectrum of spot 1 in Fig. 3. (quartz)
Table 1: Trace and minor elements in the quartz (in wt. %).
Laboratory data as recorded in the report
Element
Reported value
Aluminum
0.75
Iron
0.13
Manganese
0.04
Phosphorus
nd
Titanium
0.07
Fig. 5: X-ray diffraction scan of the matrix of the specimen.
Summary of findings: This specimen (Fig. 1) is interesting! Two generations of quartz, the first-generation crystals several cm in maximum dimension with a second generation of up to about 0.5 cm in maximum dimension are on a crumbly matrix. The crystals are very similar to hydrothermal vein quartz in morphology and are missing the often-pronounced growth ridges common in pegmatitic rose quartz crystals. Crushed grains under the petrographic microscope show abundant inclusions of blocky feldspar grains but they are missing the fibrous inclusions of dumortierite which a re common in pegmatitic rose quartz. Trace elements show minor amounts of aluminum, iron, manganese and titanium but they are missing phosphorus which has been observed in some pink quartz crystals.
The matrix consists mainly of potassium feldspar, seemingly of a less well-ordered type such as sanidine or orthoclase and not microcline which is common in pegmatites. Quartz and clay species ausch as illite were also detected. The altered or weathered matrix resembles weathered rhyolite. I is likely that the quartz formed along veins and fractures in rhyolite originally. The pink color is likely due to the combined effects of minor manganese and iron. I do not believe that this is pegmatitic rose quartz.
A Tanzanian sphere listed under the supplied name Iolite Kaolinite Sunstone, with its composition clarified by laboratory testing.
Sample: 1536 (#2 iolite sphere) · Completed: November 26, 2025.
Confirmed by X-ray diffraction: Cordierite (iolite), quartz, and kaolinite.
Locality: Tanzania, according to Soul Body Gems sourcing information.
Reading the different areas
The brown portions are cordierite, known as iolite. The white portions contain kaolinite and quartz, possibly with aluminum hydroxides such as gibbsite. Gibbsite is suggested rather than confirmed. Sunstone is part of the supplied page name, but is not identified in this report.
These results are the property of Soul Body Gems, Alexander Falster, and the Maine Mineral & Gem Museum. Any mention requires full acknowledgment.
Understanding the report figures
Use this guide alongside the written findings and the original report transcript. It explains the purpose of each analytical figure and preserves the laboratory’s own figure labels. The interpretations apply to the tested specimen; signals alone do not establish the identity of every similar-looking stone.
Electron microscope image: This view shows small-scale regions selected for analysis. Its brightness contrast helps distinguish regions with different compositions; it is not a photograph of their natural colors. Numbered spots connect this view to the analyses listed in the report.
Laboratory figure caption: Fig.2: Backscattered electron image of an area of specimen in Fig. 1.
Elemental spectrum: The peaks record characteristic X-ray signals from elements in the analyzed spot or area. This is an analysis of that location, not automatically of the entire specimen. Any mineral identification or uncertainty named in the laboratory caption is retained below.
Laboratory figure caption: Fig. 3: Energy dispersive spectrum of spot 1 in Fig. 2. (possibly cordierite).
Electron microscope image: This view shows small-scale regions selected for analysis. Its brightness contrast helps distinguish regions with different compositions; it is not a photograph of their natural colors. Numbered spots connect this view to the analyses listed in the report.
Laboratory figure caption: Fig.4: Backscattered electron image of another area of specimen in Fig. 1.
Elemental spectrum: The peaks record characteristic X-ray signals from elements in the analyzed spot or area. This is an analysis of that location, not automatically of the entire specimen. Any mineral identification or uncertainty named in the laboratory caption is retained below.
Laboratory figure caption: Fig. 5: Energy dispersive spectrum of spot 1 in Fig. 4. (possibly kaolinite mixed with gibbsite etc.).
Elemental spectrum: The peaks record characteristic X-ray signals from elements in the analyzed spot or area. This is an analysis of that location, not automatically of the entire specimen. Any mineral identification or uncertainty named in the laboratory caption is retained below.
Laboratory figure caption: Fig. 6: Energy dispersive spectrum of spot 6 in Fig. 4. (quartz).
Diffraction scan: This scan helps identify crystalline minerals by comparing the measured pattern with reference patterns. The laboratory interpretation explains which minerals the comparison supports.
Laboratory figure caption: Fig. 7: X-ray diffraction scan of the brown parts. A cordierite stick pattern has been overlaid.
Diffraction scan: This scan helps identify crystalline minerals by comparing the measured pattern with reference patterns. The laboratory interpretation explains which minerals the comparison supports.
Laboratory figure caption: Fig. 8: X-ray diffraction scan of the white parts. Quartz and kaolinite stick patterns have been overlaid.
Read the report findings as text
Analytical Result Report. Sample 1536 (#2 iolite sphere), submitted by Soul Body Gems, completed November 26, 2025. An AMRAY 1830 SEM operated at 25 kV acceleration potential, 24 mm working distance, and 0 degrees sample tilt. The specimen was coated with 250 Å carbon, and the attached XRF unit operated at 30 kV. A Bruker D2-Phaser X-ray diffractometer operated at 30 kV and 10 mA.
Figure 1: Photograph of the sphere, about 4.5 cm in diameter.
Figure 2: Backscattered electron image of an area of the specimen.
Figure 3: Energy-dispersive spectrum of possible cordierite.
Figure 4: Backscattered electron image of another area.
Figure 5: Energy-dispersive spectrum of possible kaolinite mixed with gibbsite and other material.
Figure 6: Quartz spectrum.
Figure 7: X-ray diffraction scan of brown parts with cordierite reference pattern.
Figure 8: X-ray diffraction scan of white parts with quartz and kaolinite reference patterns.
Summary: Brown portions are a magnesium aluminum silicate fitting cordierite (iolite). White portions are kaolinite, possibly mixed with aluminum hydroxides such as gibbsite, and quartz. X-ray diffraction confirms cordierite (iolite), quartz, and kaolinite. The report ends with the November 26, 2025 date and signature.
The following text and tables are transcribed from the original laboratory document. Figure captions identify the report images; the laboratory interpretations and limitations are preserved.
Laboratory report 1
Analytical Result Report
Sample id: 1536 (#2 iolite sphere)
Submitted by: Soul Body Gems
Date completed: 11-26-2025
Operating conditions: An AMRAY 1830 SEM operated at 25 kV acceleration potential, 24 mm working distance, 0 degrees sample tilt, coated with 250 Å carbon, and also using the attached XRF unit operated at 30 kV.
In addition, a Bruker D2-Phaser X-ray diffractometer was used and operated at 30 kV and 10mA.
Fig. 1: Photograph of the specimen. About 4.5 cm in diameter.
Fig.2: Backscattered electron image of an area of specimen in Fig. 1.
Fig. 3: Energy dispersive spectrum of spot 1 in Fig. 2. (possibly cordierite).
Fig.4: Backscattered electron image of another area of specimen in Fig. 1.
Fig. 5: Energy dispersive spectrum of spot 1 in Fig. 4. (possibly kaolinite mixed with gibbsite etc.).
Fig. 6: Energy dispersive spectrum of spot 6 in Fig. 4. (quartz).
Fig. 7: X-ray diffraction scan of the brown parts. A cordierite stick pattern has been overlaid.
Fig. 8: X-ray diffraction scan of the white parts. Quartz and kaolinite stick patterns have been overlaid.
Summary of findings: This is a pretty sphere (Fig. 1). The brown parts are a magnesium aluminum silicate (Figs. 2 and 3) and cordierite (iolite) would fit. The white parts are kaolinite possibly mixed with some aluminum hydroxides such as gibbsite (Figs. 4 and 5) and quartz (Figs. 4 and 6). X-ray diffraction was used to confirm cordierite (iolite) (Fig. 7) and quartz and kaolinite Fig. 8).
Copper Sunstone is another market name used for the Tanzanian material also listed here as Iolite Kaolinite Sunstone.
The trade name does not establish its composition: this report identifies cordierite (iolite), quartz and kaolinite. Copper inclusions and sunstone are not identified in this report.
Sample: 1536 (#2 iolite sphere) · Completed: November 26, 2025.
Confirmed by X-ray diffraction: Cordierite (iolite), quartz, and kaolinite.
Locality: Tanzania, according to Soul Body Gems sourcing information.
Reading the different areas
The brown portions are cordierite, known as iolite. The white portions contain kaolinite and quartz, possibly with aluminum hydroxides such as gibbsite. Gibbsite is suggested rather than confirmed. Sunstone is part of the supplied page name, but is not identified in this report.
These results are the property of Soul Body Gems, Alexander Falster, and the Maine Mineral & Gem Museum. Any mention requires full acknowledgment.
Understanding the report figures
Use this guide alongside the written findings and the original report transcript. It explains the purpose of each analytical figure and preserves the laboratory’s own figure labels. The interpretations apply to the tested specimen; signals alone do not establish the identity of every similar-looking stone.
Electron microscope image: This view shows small-scale regions selected for analysis. Its brightness contrast helps distinguish regions with different compositions; it is not a photograph of their natural colors. Numbered spots connect this view to the analyses listed in the report.
Laboratory figure caption: Fig.2: Backscattered electron image of an area of specimen in Fig. 1.
Elemental spectrum: The peaks record characteristic X-ray signals from elements in the analyzed spot or area. This is an analysis of that location, not automatically of the entire specimen. Any mineral identification or uncertainty named in the laboratory caption is retained below.
Laboratory figure caption: Fig. 3: Energy dispersive spectrum of spot 1 in Fig. 2. (possibly cordierite).
Electron microscope image: This view shows small-scale regions selected for analysis. Its brightness contrast helps distinguish regions with different compositions; it is not a photograph of their natural colors. Numbered spots connect this view to the analyses listed in the report.
Laboratory figure caption: Fig.4: Backscattered electron image of another area of specimen in Fig. 1.
Elemental spectrum: The peaks record characteristic X-ray signals from elements in the analyzed spot or area. This is an analysis of that location, not automatically of the entire specimen. Any mineral identification or uncertainty named in the laboratory caption is retained below.
Laboratory figure caption: Fig. 5: Energy dispersive spectrum of spot 1 in Fig. 4. (possibly kaolinite mixed with gibbsite etc.).
Elemental spectrum: The peaks record characteristic X-ray signals from elements in the analyzed spot or area. This is an analysis of that location, not automatically of the entire specimen. Any mineral identification or uncertainty named in the laboratory caption is retained below.
Laboratory figure caption: Fig. 6: Energy dispersive spectrum of spot 6 in Fig. 4. (quartz).
Diffraction scan: This scan helps identify crystalline minerals by comparing the measured pattern with reference patterns. The laboratory interpretation explains which minerals the comparison supports.
Laboratory figure caption: Fig. 7: X-ray diffraction scan of the brown parts. A cordierite stick pattern has been overlaid.
Diffraction scan: This scan helps identify crystalline minerals by comparing the measured pattern with reference patterns. The laboratory interpretation explains which minerals the comparison supports.
Laboratory figure caption: Fig. 8: X-ray diffraction scan of the white parts. Quartz and kaolinite stick patterns have been overlaid.
Read the report findings as text
Analytical Result Report. Sample 1536 (#2 iolite sphere), submitted by Soul Body Gems, completed November 26, 2025. An AMRAY 1830 SEM operated at 25 kV acceleration potential, 24 mm working distance, and 0 degrees sample tilt. The specimen was coated with 250 Å carbon, and the attached XRF unit operated at 30 kV. A Bruker D2-Phaser X-ray diffractometer operated at 30 kV and 10 mA.
Figure 1: Photograph of the sphere, about 4.5 cm in diameter.
Figure 2: Backscattered electron image of an area of the specimen.
Figure 3: Energy-dispersive spectrum of possible cordierite.
Figure 4: Backscattered electron image of another area.
Figure 5: Energy-dispersive spectrum of possible kaolinite mixed with gibbsite and other material.
Figure 6: Quartz spectrum.
Figure 7: X-ray diffraction scan of brown parts with cordierite reference pattern.
Figure 8: X-ray diffraction scan of white parts with quartz and kaolinite reference patterns.
Summary: Brown portions are a magnesium aluminum silicate fitting cordierite (iolite). White portions are kaolinite, possibly mixed with aluminum hydroxides such as gibbsite, and quartz. X-ray diffraction confirms cordierite (iolite), quartz, and kaolinite. The report ends with the November 26, 2025 date and signature.
The following text and tables are transcribed from the original laboratory document. Figure captions identify the report images; the laboratory interpretations and limitations are preserved.
Laboratory report 1
Analytical Result Report
Sample id: 1536 (#2 iolite sphere)
Submitted by: Soul Body Gems
Date completed: 11-26-2025
Operating conditions: An AMRAY 1830 SEM operated at 25 kV acceleration potential, 24 mm working distance, 0 degrees sample tilt, coated with 250 Å carbon, and also using the attached XRF unit operated at 30 kV.
In addition, a Bruker D2-Phaser X-ray diffractometer was used and operated at 30 kV and 10mA.
Fig. 1: Photograph of the specimen. About 4.5 cm in diameter.
Fig.2: Backscattered electron image of an area of specimen in Fig. 1.
Fig. 3: Energy dispersive spectrum of spot 1 in Fig. 2. (possibly cordierite).
Fig.4: Backscattered electron image of another area of specimen in Fig. 1.
Fig. 5: Energy dispersive spectrum of spot 1 in Fig. 4. (possibly kaolinite mixed with gibbsite etc.).
Fig. 6: Energy dispersive spectrum of spot 6 in Fig. 4. (quartz).
Fig. 7: X-ray diffraction scan of the brown parts. A cordierite stick pattern has been overlaid.
Fig. 8: X-ray diffraction scan of the white parts. Quartz and kaolinite stick patterns have been overlaid.
Summary of findings: This is a pretty sphere (Fig. 1). The brown parts are a magnesium aluminum silicate (Figs. 2 and 3) and cordierite (iolite) would fit. The white parts are kaolinite possibly mixed with some aluminum hydroxides such as gibbsite (Figs. 4 and 5) and quartz (Figs. 4 and 6). X-ray diffraction was used to confirm cordierite (iolite) (Fig. 7) and quartz and kaolinite Fig. 8).
Dark Night Peanut Obsidian · Soul Body Gems, November 2024.
An unusually dark Mexican variety of peanut obsidian, with rounded structures set against a dark background.
Soul Body Gems sourcing records describe this as a distinctive find from Mexico, possibly a one-time pocket. The extent and duration of the find are not confirmed.
Sample: 1091 (#3, Mexican jasper/obsidian) · Completed: October 2, 2024.
Identification: Devitrified obsidian with a spherulitic texture.
Glass beginning to crystallize
The report identifies devitrification: the onset of crystallization in obsidian. Its rounded spherulites are characteristic of that process. The researcher describes a broadly homogeneous composition with more silica than feldspar alone would contain.
These results are shared by the Dark Night Obsidian and Peanut Obsidian (Dark) entries, representing one tested material rather than two separate reports.
These results are the property of Soul Body Gems, Alexander Falster, and the Maine Mineral & Gem Museum. Any mention requires full acknowledgment.
Understanding the report figures
Use this guide alongside the written findings and the original report transcript. It explains the purpose of each analytical figure and preserves the laboratory’s own figure labels. The interpretations apply to the tested specimen; signals alone do not establish the identity of every similar-looking stone.
Electron microscope image: This view shows small-scale regions selected for analysis. Its brightness contrast helps distinguish regions with different compositions; it is not a photograph of their natural colors. Numbered spots connect this view to the analyses listed in the report.
Laboratory figure caption: Fig.2: Backscattered electron image of an area of the specimen.
Elemental spectrum: The peaks record characteristic X-ray signals from elements in the analyzed spot or area. This is an analysis of that location, not automatically of the entire specimen. Any mineral identification or uncertainty named in the laboratory caption is retained below.
Laboratory figure caption: Fig. 3: Energy dispersive spectrum of spot 1 in Fig. 2. left (obsidian, devitrified)
Elemental spectrum: The peaks record characteristic X-ray signals from elements in the analyzed spot or area. This is an analysis of that location, not automatically of the entire specimen. Any mineral identification or uncertainty named in the laboratory caption is retained below.
Laboratory figure caption: Fig. 4: Energy dispersive spectrum of spot 2 in Fig.2 (obsidian, devitrified)
Element map: This map shows where the named elements occur within the analyzed area. Its colors represent the laboratory’s selected element channels, rather than the specimen’s visible colors. The caption below preserves any color key or distribution noted by the laboratory.
Laboratory figure caption: Fig. 5: X-ray map of the area shown in Fig. 2: Silicon: yellow, calcium: green, sodium: red.
Read the report findings as text
Analytical Result Report. Sample 1091 (#3, Mexican jasper/obsidian), submitted by Soul Body Gems, completed October 2, 2024. An AMRAY 1830 SEM operated at 25 kV acceleration potential, 24 mm working distance, and 0 degrees sample tilt. The sample was coated with 250 Å carbon; the attached XRF unit operated at 30 kV.
Figure 1: Specimen photograph, approximately 55 mm maximum dimension.
Figure 2: Backscattered electron image of an area of the specimen.
Figures 3 and 4: Energy-dispersive spectra of two spots, identified as devitrified obsidian.
Summary: The specimen is devitrified obsidian. Its spherulitic texture is typical of the onset of crystallization. The composition is homogeneous and richer in silica than feldspars alone; the researcher describes the crystalline product as essentially rhyolite, containing about one-third quartz. The elemental map shows some minor calcium in material after the spherulites formed. The researcher notes that such spherulites generally consist of cristobalite and feldspars, sometimes only one, and that glassy materials eventually crystallize over geological time. The report ends with the October 2, 2024 date and signature.
Read the original laboratory report as text
The following text and tables are transcribed from the original laboratory document. Figure captions identify the report images; the laboratory interpretations and limitations are preserved.
Laboratory report 1
Analytical Result Report
Sample id: 1091 (#3, Mexican jasper/obsidian)
Submitted by: Soul Body Gems
Date completed: 10-2-2024
Operating conditions: An AMRAY 1830 SEM operated at 25 kV acceleration potential, 24 mm working distance, 0 degrees sample tilt, coated with 250 Å carbon, and also using the attached XRF unit operated at 30 kV.
Fig. 1: Photograph of the specimen. Approximately 55mm maximum dimension.
Fig.2: Backscattered electron image of an area of the specimen.
Fig. 3: Energy dispersive spectrum of spot 1 in Fig. 2. left (obsidian, devitrified)
Fig. 4: Energy dispersive spectrum of spot 2 in Fig.2 (obsidian, devitrified)
Fig. 5: X-ray map of the area shown in Fig. 2: Silicon: yellow, calcium: green, sodium: red.
Summary of findings: This specimen (Fig. 1) is a devitrified obsidian. The spherulitic texture is very typical for obsidian’s devitrification process which is the onset of crystallization. We see from Figs. 2-4 that the composition is homogenous, and it appears to be silica-richer than just the feldspars, which is because the composition of the crystalline product, essentially a rhyolite, contains about 1/3 of quartz. Fig. 5 shows an X-ray map that shows some minor calcium in the material after the spherulites formed. These spherulites are usually composed of cristobalite and feldspars, sometimes just one of them but eventually, the whole piece will be crystalline. Glassy materials are geologically not very long-lived.
Dark Night Peanut Obsidian · Soul Body Gems, November 2024.
An unusually dark Mexican variety of peanut obsidian, with rounded structures set against a dark background.
Soul Body Gems sourcing records describe this as a distinctive find from Mexico, possibly a one-time pocket. The extent and duration of the find are not confirmed.
Sample: 1091 (#3, Mexican jasper/obsidian) · Completed: October 2, 2024.
Identification: Devitrified obsidian with a spherulitic texture.
Glass beginning to crystallize
The report identifies devitrification: the onset of crystallization in obsidian. Its rounded spherulites are characteristic of that process. The researcher describes a broadly homogeneous composition with more silica than feldspar alone would contain.
These results are shared by the Dark Night Obsidian and Peanut Obsidian (Dark) entries, representing one tested material rather than two separate reports.
These results are the property of Soul Body Gems, Alexander Falster, and the Maine Mineral & Gem Museum. Any mention requires full acknowledgment.
Understanding the report figures
Use this guide alongside the written findings and the original report transcript. It explains the purpose of each analytical figure and preserves the laboratory’s own figure labels. The interpretations apply to the tested specimen; signals alone do not establish the identity of every similar-looking stone.
Electron microscope image: This view shows small-scale regions selected for analysis. Its brightness contrast helps distinguish regions with different compositions; it is not a photograph of their natural colors. Numbered spots connect this view to the analyses listed in the report.
Laboratory figure caption: Fig.2: Backscattered electron image of an area of the specimen.
Elemental spectrum: The peaks record characteristic X-ray signals from elements in the analyzed spot or area. This is an analysis of that location, not automatically of the entire specimen. Any mineral identification or uncertainty named in the laboratory caption is retained below.
Laboratory figure caption: Fig. 3: Energy dispersive spectrum of spot 1 in Fig. 2. left (obsidian, devitrified)
Elemental spectrum: The peaks record characteristic X-ray signals from elements in the analyzed spot or area. This is an analysis of that location, not automatically of the entire specimen. Any mineral identification or uncertainty named in the laboratory caption is retained below.
Laboratory figure caption: Fig. 4: Energy dispersive spectrum of spot 2 in Fig.2 (obsidian, devitrified)
Element map: This map shows where the named elements occur within the analyzed area. Its colors represent the laboratory’s selected element channels, rather than the specimen’s visible colors. The caption below preserves any color key or distribution noted by the laboratory.
Laboratory figure caption: Fig. 5: X-ray map of the area shown in Fig. 2: Silicon: yellow, calcium: green, sodium: red.
Read the report findings as text
Analytical Result Report. Sample 1091 (#3, Mexican jasper/obsidian), submitted by Soul Body Gems, completed October 2, 2024. An AMRAY 1830 SEM operated at 25 kV acceleration potential, 24 mm working distance, and 0 degrees sample tilt. The sample was coated with 250 Å carbon; the attached XRF unit operated at 30 kV.
Figure 1: Specimen photograph, approximately 55 mm maximum dimension.
Figure 2: Backscattered electron image of an area of the specimen.
Figures 3 and 4: Energy-dispersive spectra of two spots, identified as devitrified obsidian.
Summary: The specimen is devitrified obsidian. Its spherulitic texture is typical of the onset of crystallization. The composition is homogeneous and richer in silica than feldspars alone; the researcher describes the crystalline product as essentially rhyolite, containing about one-third quartz. The elemental map shows some minor calcium in material after the spherulites formed. The researcher notes that such spherulites generally consist of cristobalite and feldspars, sometimes only one, and that glassy materials eventually crystallize over geological time. The report ends with the October 2, 2024 date and signature.
Read the original laboratory report as text
The following text and tables are transcribed from the original laboratory document. Figure captions identify the report images; the laboratory interpretations and limitations are preserved.
Laboratory report 1
Analytical Result Report
Sample id: 1091 (#3, Mexican jasper/obsidian)
Submitted by: Soul Body Gems
Date completed: 10-2-2024
Operating conditions: An AMRAY 1830 SEM operated at 25 kV acceleration potential, 24 mm working distance, 0 degrees sample tilt, coated with 250 Å carbon, and also using the attached XRF unit operated at 30 kV.
Fig. 1: Photograph of the specimen. Approximately 55mm maximum dimension.
Fig.2: Backscattered electron image of an area of the specimen.
Fig. 3: Energy dispersive spectrum of spot 1 in Fig. 2. left (obsidian, devitrified)
Fig. 4: Energy dispersive spectrum of spot 2 in Fig.2 (obsidian, devitrified)
Fig. 5: X-ray map of the area shown in Fig. 2: Silicon: yellow, calcium: green, sodium: red.
Summary of findings: This specimen (Fig. 1) is a devitrified obsidian. The spherulitic texture is very typical for obsidian’s devitrification process which is the onset of crystallization. We see from Figs. 2-4 that the composition is homogenous, and it appears to be silica-richer than just the feldspars, which is because the composition of the crystalline product, essentially a rhyolite, contains about 1/3 of quartz. Fig. 5 shows an X-ray map that shows some minor calcium in the material after the spherulites formed. These spherulites are usually composed of cristobalite and feldspars, sometimes just one of them but eventually, the whole piece will be crystalline. Glassy materials are geologically not very long-lived.
Date: 10-2-2024 Signature
Two Tanzanian specimens from the same pocket find, sold with sunstone/moonstone wording and tested separately to clarify their composition.
Both reports identify quartz and sodium-rich plagioclase feldspar. Neither identifies moonstone. The May report explicitly describes the pink feldspar as sunstone rather than moonstone.
Locality: Tanzania; the shared-pocket history is from Soul Body Gems sourcing records.
Could the feldspar explain the blue sheen?
The identified albite and sodium-rich plagioclase offer a possible explanation for the blue sheen observed in this material. Certain albite-rich feldspar intergrowths, known as peristerite, can produce iridescent schiller. These reports establish composition but do not examine the microscopic structures responsible for the sheen, so that explanation remains a hypothesis rather than a confirmed optical finding.
Use this guide alongside the written findings and the original report transcript. It explains the purpose of each analytical figure and preserves the laboratory’s own figure labels. The interpretations apply to the tested specimen; signals alone do not establish the identity of every similar-looking stone.
Diffraction scan: This scan helps identify crystalline minerals by comparing the measured pattern with reference patterns. The laboratory interpretation explains which minerals the comparison supports.
Laboratory figure caption: Fig. 2: X-ray diffractogram of the material with matching reference stick patterns.
Read sample 1564 report and table as text
Sample 1564 (#3), submitted by Soul Body Gems, completed February 24, 2026. A Bruker Titan X-ray fluorescence spectrometer operated at 10, 25, and 50 kV; a Bruker D2-Phaser X-ray diffractometer operated at 30 kV and 10 mA. Figure 1 shows a specimen of 4.5 cm maximum dimension. Figure 2 is the X-ray diffractogram with matching reference patterns.
Major and minor elemental composition, in wt.%
Element
Wt.%
Aluminum
3.6
Calcium
0.1
Iron
0.1
Potassium
0.1
Silicon
40.3
Summary: Silicon-dominant composition with minor aluminum and small minor and trace contributions. Pink color is caused by trivalent iron. X-ray diffraction identifies quartz and albite as the main components. Albite domains show more satin surface luster and slightly negative relief because albite is softer and undercuts during processing. The report ends with the February 24, 2026 date and signature.
Specimen 2 — sunstone with smoky quartz
Sample: 1570 (#3 sunstone/moonstone Tanzania) · Completed: May 29, 2026.
Finding: Pink sodium-rich plagioclase, oligoclase to calcic albite; smoky quartz.
Elemental analysis and X-ray diffraction agree on this identification. The researcher calls the pink portion sunstone, rather than moonstone.
Sample 1570 (#3 sunstone/moonstone Tanzania), submitted by Soul Body Gems, completed May 29, 2026. A Bruker Titan X-ray fluorescence spectrometer operated at 10, 25, and 50 kV; a Bruker D2-Phaser X-ray diffractometer operated at 30 kV and 10 mA. Figure 1 shows a specimen of 6 cm maximum dimension. The diffraction scan has oligoclase and quartz reference patterns overlaid.
Major and minor elemental composition, in wt.%; sodium measured by LIBS
Element
Pink portion
Smoky portion
Aluminum
12.1
0.5
Calcium
1.9
nd
Iron
0.1
nd
Potassium
0.6
nd
Silicon
29.3
46.4
Sodium
5.1
nd
Summary: Pink material is sodium-rich plagioclase, oligoclase to calcic albite; the smoky portion is quartz. Elemental analyses and X-ray diffractometry agree. The pink portion is identified as sunstone rather than moonstone. The report contrasts typical potassium-sodium feldspar moonstones with sunstones that may be plagioclase or potassium feldspar. “nd” is retained from the original table. The report ends with the May 29, 2026 date and signature.
These results are the property of Soul Body Gems, Alexander Falster, and the Maine Mineral & Gem Museum. Any mention requires full acknowledgment.
Read the original laboratory report as text
The following text and tables are transcribed from the original laboratory document. Figure captions identify the report images; the laboratory interpretations and limitations are preserved.
Laboratory report 1
Analytical Result Report
Sample id: 1564 (#3)
Submitted by: Soul Body Gems
Date completed: 2-24-2026
Operating conditions: A Bruker Titan X-ray fluorescence spectrometer was used and operated at 10, 25 and 50 kV.
A Bruker D2-Phaser X-ray diffractometer was also used and oppeprated at 30 kV and 10 mA.
Fig. 1: Photograph of the specimens. 4.5 cm maximum dimension
Table 1: Major and minor elemental composition of the material, in wt. %.
Laboratory data as recorded in the report
Element
Reported value
Aluminum
3.6
Calcium
0.1
Iron
0.1
Potassium
0.1
Silicon
40.3
Fig. 2: X-ray diffractogram of the material with matching reference stick patterns.
Summary of findings: This is a pretty specimen. Chemically, it is silicon-dominant with minor aluminum and small contributions of minor and trace elements. The pink color is caused by trivalent iron. X-ray diffraction shows that two minerals are the main components: quartz and albite. The albite domains are visible on the polished specimen as having a more satin surface luster and slightly negative relief as albite is softer and undercuts a little during processing.
Date: 2-24-2026 Signature
Laboratory report 2
Analytical Result Report
Sample id: 1570 (#3 sunstone/moonstone Tanzania )
Submitted by: Soul Body Gems
Date completed: 5-292026
Operating conditions: A Bruker Titan X-ray fluorescence spectrometer was used and operated at 10, 25 and 50 kV.
A Bruker D2-Phaser X-ray diffractometer was also used and operated at 30 kV and 10 mA.
Fig. 1: Photograph of the specimen. 6 cm maximum dimension.
Table 1: Major and minor elemental composition of the material, in wt. %. Na by LIBS.
Laboratory data as recorded in the report
Pink portion
Smoky portion
Aluminum
12.1
0.5
Calcium
1.9
nd
Iron
0.1
nd
Potassium
0.6
nd
Silicon
29.3
46.4
Sodium
5.1
nd
Fig. X-ray diffraction scan of the blue material. Oligoclase and quartz preference patterns overlaid.
Summary of findings: This is an interesting specimen (Fig. 1). The pink material is a sodium-rich plagioclase, oligoclase to calcic albite whereas the smoky portion is quartz. There is good agreement on the elemental analyses as well the X-ray diffractometry. The pink portion is this a sunstone rather than a moonstone. Moonstones are typical potassium-sodium feldspars whereas sunstones are either plagioclase or potassium feldspar.
Date: 5-29-2026 Signature
Two Tanzanian specimens from the same pocket find, sold with sunstone/moonstone wording and tested separately to clarify their composition.
Both reports identify quartz and sodium-rich plagioclase feldspar. Neither identifies moonstone. The May report explicitly describes the pink feldspar as sunstone rather than moonstone.
Locality: Tanzania; the shared-pocket history is from Soul Body Gems sourcing records.
Could the feldspar explain the blue sheen?
The identified albite and sodium-rich plagioclase offer a possible explanation for the blue sheen observed in this material. Certain albite-rich feldspar intergrowths, known as peristerite, can produce iridescent schiller. These reports establish composition but do not examine the microscopic structures responsible for the sheen, so that explanation remains a hypothesis rather than a confirmed optical finding.
Use this guide alongside the written findings and the original report transcript. It explains the purpose of each analytical figure and preserves the laboratory’s own figure labels. The interpretations apply to the tested specimen; signals alone do not establish the identity of every similar-looking stone.
Diffraction scan: This scan helps identify crystalline minerals by comparing the measured pattern with reference patterns. The laboratory interpretation explains which minerals the comparison supports.
Laboratory figure caption: Fig. 2: X-ray diffractogram of the material with matching reference stick patterns.
Read sample 1564 report and table as text
Sample 1564 (#3), submitted by Soul Body Gems, completed February 24, 2026. A Bruker Titan X-ray fluorescence spectrometer operated at 10, 25, and 50 kV; a Bruker D2-Phaser X-ray diffractometer operated at 30 kV and 10 mA. Figure 1 shows a specimen of 4.5 cm maximum dimension. Figure 2 is the X-ray diffractogram with matching reference patterns.
Major and minor elemental composition, in wt.%
Element
Wt.%
Aluminum
3.6
Calcium
0.1
Iron
0.1
Potassium
0.1
Silicon
40.3
Summary: Silicon-dominant composition with minor aluminum and small minor and trace contributions. Pink color is caused by trivalent iron. X-ray diffraction identifies quartz and albite as the main components. Albite domains show more satin surface luster and slightly negative relief because albite is softer and undercuts during processing. The report ends with the February 24, 2026 date and signature.
Specimen 2 — sunstone with smoky quartz
Sample: 1570 (#3 sunstone/moonstone Tanzania) · Completed: May 29, 2026.
Finding: Pink sodium-rich plagioclase, oligoclase to calcic albite; smoky quartz.
Elemental analysis and X-ray diffraction agree on this identification. The researcher calls the pink portion sunstone, rather than moonstone.
Sample 1570 (#3 sunstone/moonstone Tanzania), submitted by Soul Body Gems, completed May 29, 2026. A Bruker Titan X-ray fluorescence spectrometer operated at 10, 25, and 50 kV; a Bruker D2-Phaser X-ray diffractometer operated at 30 kV and 10 mA. Figure 1 shows a specimen of 6 cm maximum dimension. The diffraction scan has oligoclase and quartz reference patterns overlaid.
Major and minor elemental composition, in wt.%; sodium measured by LIBS
Element
Pink portion
Smoky portion
Aluminum
12.1
0.5
Calcium
1.9
nd
Iron
0.1
nd
Potassium
0.6
nd
Silicon
29.3
46.4
Sodium
5.1
nd
Summary: Pink material is sodium-rich plagioclase, oligoclase to calcic albite; the smoky portion is quartz. Elemental analyses and X-ray diffractometry agree. The pink portion is identified as sunstone rather than moonstone. The report contrasts typical potassium-sodium feldspar moonstones with sunstones that may be plagioclase or potassium feldspar. “nd” is retained from the original table. The report ends with the May 29, 2026 date and signature.
These results are the property of Soul Body Gems, Alexander Falster, and the Maine Mineral & Gem Museum. Any mention requires full acknowledgment.
Read the original laboratory report as text
The following text and tables are transcribed from the original laboratory document. Figure captions identify the report images; the laboratory interpretations and limitations are preserved.
Laboratory report 1
Analytical Result Report
Sample id: 1564 (#3)
Submitted by: Soul Body Gems
Date completed: 2-24-2026
Operating conditions: A Bruker Titan X-ray fluorescence spectrometer was used and operated at 10, 25 and 50 kV.
A Bruker D2-Phaser X-ray diffractometer was also used and oppeprated at 30 kV and 10 mA.
Fig. 1: Photograph of the specimens. 4.5 cm maximum dimension
Table 1: Major and minor elemental composition of the material, in wt. %.
Laboratory data as recorded in the report
Element
Reported value
Aluminum
3.6
Calcium
0.1
Iron
0.1
Potassium
0.1
Silicon
40.3
Fig. 2: X-ray diffractogram of the material with matching reference stick patterns.
Summary of findings: This is a pretty specimen. Chemically, it is silicon-dominant with minor aluminum and small contributions of minor and trace elements. The pink color is caused by trivalent iron. X-ray diffraction shows that two minerals are the main components: quartz and albite. The albite domains are visible on the polished specimen as having a more satin surface luster and slightly negative relief as albite is softer and undercuts a little during processing.
Date: 2-24-2026 Signature
Laboratory report 2
Analytical Result Report
Sample id: 1570 (#3 sunstone/moonstone Tanzania )
Submitted by: Soul Body Gems
Date completed: 5-292026
Operating conditions: A Bruker Titan X-ray fluorescence spectrometer was used and operated at 10, 25 and 50 kV.
A Bruker D2-Phaser X-ray diffractometer was also used and operated at 30 kV and 10 mA.
Fig. 1: Photograph of the specimen. 6 cm maximum dimension.
Table 1: Major and minor elemental composition of the material, in wt. %. Na by LIBS.
Laboratory data as recorded in the report
Pink portion
Smoky portion
Aluminum
12.1
0.5
Calcium
1.9
nd
Iron
0.1
nd
Potassium
0.6
nd
Silicon
29.3
46.4
Sodium
5.1
nd
Fig. X-ray diffraction scan of the blue material. Oligoclase and quartz preference patterns overlaid.
Summary of findings: This is an interesting specimen (Fig. 1). The pink material is a sodium-rich plagioclase, oligoclase to calcic albite whereas the smoky portion is quartz. There is good agreement on the elemental analyses as well the X-ray diffractometry. The pink portion is this a sunstone rather than a moonstone. Moonstones are typical potassium-sodium feldspars whereas sunstones are either plagioclase or potassium feldspar.
These results are the property of Soul Body Gems, Alexander Falster, and the Maine Mineral & Gem Museum. Any mention requires full acknowledgment.
Understanding the report figures
Use this guide alongside the written findings and the original report transcript. It explains the purpose of each analytical figure and preserves the laboratory’s own figure labels. The interpretations apply to the tested specimen; signals alone do not establish the identity of every similar-looking stone.
Electron microscope image: This view shows small-scale regions selected for analysis. Its brightness contrast helps distinguish regions with different compositions; it is not a photograph of their natural colors. Numbered spots connect this view to the analyses listed in the report.
Laboratory figure caption: Fig.2: Backscattered electron image of an area of the specimen in Fig. 1.
Elemental spectrum: The peaks record characteristic X-ray signals from elements in the analyzed spot or area. This is an analysis of that location, not automatically of the entire specimen. Any mineral identification or uncertainty named in the laboratory caption is retained below.
Laboratory figure caption: Fig. 3: Energy dispersive spectrum of spot 1 in Fig. 2. (possibly dumoortierite)
Elemental spectrum: The peaks record characteristic X-ray signals from elements in the analyzed spot or area. This is an analysis of that location, not automatically of the entire specimen. Any mineral identification or uncertainty named in the laboratory caption is retained below.
Laboratory figure caption: Fig. 4: Energy dispersive spectrum of spot 2 in Fig. 2 (quartz).
Electron microscope image: This view shows small-scale regions selected for analysis. Its brightness contrast helps distinguish regions with different compositions; it is not a photograph of their natural colors. Numbered spots connect this view to the analyses listed in the report.
Laboratory figure caption: Fig.5: Backscattered electron image of another area of the specimen in Fig. 1.
Elemental spectrum: The peaks record characteristic X-ray signals from elements in the analyzed spot or area. This is an analysis of that location, not automatically of the entire specimen. Any mineral identification or uncertainty named in the laboratory caption is retained below.
Laboratory figure caption: Fig. 6: Energy dispersive spectrum of spot 1 in Fig. 5 (titanium oxide).
Elemental spectrum: The peaks record characteristic X-ray signals from elements in the analyzed spot or area. This is an analysis of that location, not automatically of the entire specimen. Any mineral identification or uncertainty named in the laboratory caption is retained below.
Laboratory figure caption: Fig. 7: Energy dispersive spectrum of spot 2 in Fig. 5 (dravite).
Element map: This map shows where the named elements occur within the analyzed area. Its colors represent the laboratory’s selected element channels, rather than the specimen’s visible colors. The caption below preserves any color key or distribution noted by the laboratory.
Laboratory figure caption: Fig. 8: X-ray maps of the area shown in Fig. 5. Aluminum: yellow, silicon: red, magnesium: blue, iron: green., rutile: black.
Diffraction scan: This scan helps identify crystalline minerals by comparing the measured pattern with reference patterns. The laboratory interpretation explains which minerals the comparison supports.
Laboratory figure caption: Fig. 9: X-ray diffraction scan of the purple material with mamtching patterns for quartz and dumortierite.
Read the report findings as text
Sample 10588 (#3), submitted by Soul Body Gems, completed April 25, 2024. An AMRAY 1830 SEM operated at 25 kV acceleration potential, 24 mm working distance, and 0 degrees sample tilt. The specimen was coated with 250 Å carbon; the attached XRF unit operated at 30 kV. A BRUKER D2-Phaser X-ray diffractometer operated at 35 kV and 10 mA.
Figure 1: Specimen photograph, approximately 49 mm maximum dimension.
Figures 2 and 3: Backscattered electron image and spectrum of a high-aluminum silicate.
Figures 4–6: Another area and spectra suggesting intimate intergrowth of the silicate and quartz.
Figure 7: Zircon spectrum.
Figure 8: Aluminum in blue and silicon in yellow on elemental maps.
Figure 9: X-ray diffraction scan with matching quartz and dumortierite patterns.
Summary: High-aluminum silicate intimately intergrown with quartz. Iron is likely the cause of color. Minor zircon is present. Diffuse silicon-rich patches suggest intergrown quartz. X-ray diffraction identifies dumortierite with quartz, not sugilite. The report ends with the April 25, 2024 date and signature.
Additional tested specimen: purple palm stone
Sample 1233 · April 8, 2025
This additional specimen contains dumortierite, quartz and dravite (a tourmaline-group mineral), with minor titanium oxide, likely rutile. X-ray diffraction also confirmed dumortierite. This report complements the earlier tested specimen; it does not replace it.
View the additional test results
Select a page to enlarge it. All five pages are included.
Operating conditions: An AMRAY 1830 SEM operated at 25 kV acceleration potential, 24 mm working distance, 0 degrees sample tilt, coated with 250 Å carbon, and also using the attached XRF unit operated at 30 kV.
A Bruker D2 Phaser X-ray diffractometer was also used in the study and operated at 30 kV and 10 mA.
Fig. 1: Photograph of the specimens. 6 cm maximum dimension .
Fig.2: Backscattered electron image of an area of the specimen in Fig. 1.
Fig. 3: Energy dispersive spectrum of spot 1 in Fig. 2. (possibly dumoortierite)
Fig. 4: Energy dispersive spectrum of spot 2 in Fig. 2 (quartz).
Fig.5: Backscattered electron image of another area of the specimen in Fig. 1.
Fig. 6: Energy dispersive spectrum of spot 1 in Fig. 5 (titanium oxide).
Fig. 7: Energy dispersive spectrum of spot 2 in Fig. 5 (dravite).
Fig. 8: X-ray maps of the area shown in Fig. 5. Aluminum: yellow, silicon: red, magnesium: blue, iron: green., rutile: black.
Fig. 9: X-ray diffraction scan of the purple material with mamtching patterns for quartz and dumortierite.
Summary of findings: This is an unusual one! (Fig. 1). The palm stone is composed of dumortierite (Figs. 2 and 3), quartz (Figs. 2 and 4) and dravite (Figs. 5 and 7), a tourmaline group member and some minor titanium oxide, likely rutile (Figs. 5 and 6). The X-ray map (Fig. 8) gives an idea of the relative abundances, yellow is dumortierite, red is quartz, blue-green is dravite, black is rutile. Dumortierite was also confirmed by X-ray diffraction (Fig. 9).
Date: 4-8-2025 Signature
Copper in altered volcanic rock from Michigan’s Upper Peninsula, with composition and host rock consistent with that region.
Sample: 1563 (#3 copper disk) · Completed: March 18, 2026.
Finding: Copper containing minor iron and traces of silver, cobalt, and selenium, in altered iron-rich tholeiitic basalt.
The researcher considers both the copper composition and associated rock typical of the Upper Peninsula. Alteration prevents determining whether olivine was originally present.
These results are the property of Soul Body Gems, Alexander Falster, and the Maine Mineral & Gem Museum. Any mention requires full acknowledgment.
Read the report findings and table as text
Sample 1563 (#3 copper disk), submitted by Soul Body Gems, completed March 18, 2026. A Bruker Titan X-ray fluorescence spectrometer operated at 10, 25, and 50 kV. A Bruker D2-Phaser X-ray diffractometer operated at 30 kV and 10 mA. Figure 1 shows a specimen of 3.7 cm maximum dimension.
Major and minor elemental composition, in wt.%
Element
Wt.%
Cobalt
0.06
Copper
99.1
Iron
0.7
Selenium
0.001
Silver
0.02
Summary: Copper typical of Michigan’s Upper Peninsula, containing silver, selenium, and cobalt. Matrix is altered iron-rich tholeiitic basalt; alteration obscures whether olivine was present. Regional rocks include basalts extending into iron-rich andesites. The copper and host rock match this region. The researcher relates this source to copper used by Copper Culture peoples as far back as 6,500 years. Page 2 contains the March 18, 2026 date and signature.
Read the original laboratory report as text
The following text and tables are transcribed from the original laboratory document. Figure captions identify the report images; the laboratory interpretations and limitations are preserved.
Laboratory report 1
Analytical Result Report
Sample id: 1563 (#3 copper disk)
Submitted by: Soul Body Gems
Date completed: 3-18-2026
Operating conditions: A Bruker Titan X-ray fluorescence spectrometer was used and operated at 10, 25 and 50 kV.
A Bruker D2-Phaser X-ray diffractometer was also used and operated at 30 kV and 10 mA.
Fig. 1: Photograph of the specimen. 3.7 cm maximum dimension.
Table 1: Major and minor elemental composition of the material, in wt. %.
Laboratory data as recorded in the report
Element
Reported value
Cobalt
0.06
Copper
99.1
Iron
0.7
Selenium
0.001
Silver
0.02
Summary of findings: This is an interesting specimen (Fig. 1). The copper is typical for the upper Peninsula of Michigan. It contains noticeable silver content as well as selenium and cobalt. I have done a lot of work on this copper. The matrix is altered iron-rich tholeiitic basalt. I can’t tell if any olivine has been present anymore due to the alteration. The typical rocks in the UP are various basalts and can range into iron-rich andesites. Thus, the copper’s composition and the associated country rock match what occurs there. This is also the source of the copper that was used by the Copper Culture people back to 6500 years.
Date: 3-18-2026 Signature
A very dark-red amber specimen purchased as Baltic amber and compared with a confirmed Baltic reference specimen.
Sample: 1555 (#3 dark Baltic amber) · Completed: December 17, 2025.
Conclusion: Very likely of Baltic origin, based on closely matching density and minor/trace-element composition.
The tested piece measured 1.01 g/cm³ in density; the known Baltic comparison piece measured 1.006 g/cm³. This supports the supplied origin while retaining the researcher’s stated degree of confidence.
These results are the property of Soul Body Gems, Alexander Falster, and the Maine Mineral & Gem Museum. Any mention requires full acknowledgment.
Read the report findings and comparison table as text
Sample 1555 (#3 dark Baltic amber), submitted by Soul Body Gems, completed December 17, 2025. A Bruker Titan X-ray fluorescence spectrometer operated at 10, 25, and 50 kV. Figure 1 shows a specimen of 3.3 cm maximum dimension.
Minor and trace elements, in ppm
Element
This specimen
Old Baltic piece
Aluminum
3850
3100
Calcium
790
840
Iron
406
310
Phosphorus
198
144
Potassium
669
788
Silicon
4220
3450
Sulfur
7600
6050
Summary: Dark amber occurs in Baltic deposits; the report estimates about 15% is dark. The tested piece has a density of 1.01 g/cm³ compared with 1.006 g/cm³ for an older confirmed dark Baltic amber. Minor and trace elements closely match. The researcher concludes it is very likely of Baltic origin. The report ends with the December 17, 2025 date and signature.
Read the original laboratory report as text
The following text and tables are transcribed from the original laboratory document. Figure captions identify the report images; the laboratory interpretations and limitations are preserved.
Laboratory report 1
Analytical Result Report
Sample id: 1555 (#3 dark Baltic amber)
Submitted by: Soul Body Gems
Date completed: 12-17-2025
Operating conditions: A Bruker Titan X-ray fluorescence spectrometer was used and operated at 10, 25 and 50 kV.
Fig. 1: Photograph of the specimens. 3.3 cm maximum dimension.
Table 1: Minor and trace elements in the specimen, in ppm.
Laboratory data as recorded in the report
This specimen
Old Baltic piece
Aluminum
3850
3100
Calcium
790
840
Iron
406
310
Phosphorus
198
144
Potassium
669
788
Silicon
4220
3450
Sulfur
7600
6050
Summary of findings: This is an interesting specimen (Fig.1). Dark amber does occur in the Baltic deposits, about 15% is dark. The density of this piece is1.01 g/cm3. An old confirmed piece of dark amber that I had around was very close to that: 1.006 g/cm3. The minor and trace elements for this and the confirmed piece are all very close. Thus it appears that this is very likely of Baltic origin.
Identification: Colorless fluorite; the researcher considers the specimen apparently untreated.
Locality: China, according to Soul Body Gems sourcing information.
Evidence for an untreated specimen
The report observes intact trains of fluid inclusions rather than the ruptured inclusions expected after heat treatment. This supports its apparently untreated condition. Bleaching was a market speculation, not a separate treatment test documented in this report.
Yttrium ranges from 1.4 to 2.49 wt.%. Ytterbium and other heavy rare-earth elements are reported in the 0.1–0.15 wt.% range. A hydrothermal fluorite vein assemblage is suggested as the source.
These results are the property of Soul Body Gems, Alexander Falster, and the Maine Mineral & Gem Museum. Any mention requires full acknowledgment.
Understanding the report figures
Use this guide alongside the written findings and the original report transcript. It explains the purpose of each analytical figure and preserves the laboratory’s own figure labels. The interpretations apply to the tested specimen; signals alone do not establish the identity of every similar-looking stone.
Electron microscope image: This view shows small-scale regions selected for analysis. Its brightness contrast helps distinguish regions with different compositions; it is not a photograph of their natural colors. Numbered spots connect this view to the analyses listed in the report.
Laboratory figure caption: Fig.2: Backscattered electron images of fluorescent areas of the specimens in Fig. 1.
Elemental spectrum: The peaks record characteristic X-ray signals from elements in the analyzed spot or area. This is an analysis of that location, not automatically of the entire specimen. Any mineral identification or uncertainty named in the laboratory caption is retained below.
Laboratory figure caption: Fig. 3: Energy dispersive spectrum of spot 1 in Fig. 2. (fluorite)
Read the report findings as text
Sample 1529 (#3 white/colorless sphere), submitted by Soul Body Gems. The header records October 15, 2025; the closing date reads October 14, 2025. An AMRAY 1830 SEM operated at 25 kV acceleration potential, 24 mm working distance, and 0 degrees sample tilt. The specimen was coated with 250 Å carbon; the attached XRF unit operated at 30 kV.
Figure 1: Sphere photograph, 5 cm maximum dimension.
Figure 2: Backscattered electron images of fluorescent areas.
Summary: Colorless fluorite. The peak at 7.38 is a calcium sum peak. Yttrium ranges from 1.4 to 2.49 wt.%. Ytterbium and other heavy rare-earth elements are in the 0.1–0.15 wt.% range. The specimen appears untreated; fluid-inclusion trains are not decrepitated, as they would be if heat-treated. It likely originated in a hydrothermal fluorite vein assemblage. The original report includes its date and signature.
Read the original laboratory report as text
The following text and tables are transcribed from the original laboratory document. Figure captions identify the report images; the laboratory interpretations and limitations are preserved.
Laboratory report 1
Analytical Result Report
Sample id: 1529 (#3 white/colorless sphere)
Submitted by: Soul Body Gems
Date completed: 10-15-2025
Operating conditions: An AMRAY 1830 SEM operated at 25 kV acceleration potential, 24 mm working distance, 0 degrees sample tilt, coated with 250 Å carbon, and also using the attached XRF unit operated at 30 kV.
Fig. 1: Photograph of the specimen. 5 cm maximum dimension.
Fig.2: Backscattered electron images of fluorescent areas of the specimens in Fig. 1.
Fig. 3: Energy dispersive spectrum of spot 1 in Fig. 2. (fluorite)
Summary of findings: This is an interesting sphere! (Fig.1). It is colorless fluorite (Figs. 2 and 3). The peak at 7.38 is a calcium sum peak. The yttrium content ranges from 1.4 to 2,49 wt. %. Ytterbium and the other heavy rare earth elements are in the 0.1 to 0.15 wt. % range. This specimen appears to be untreated, the trains of fluid inclusions (Fig. 1) are not decrepitated which they would be if the specimen was heat treated. It likely came from a hydrothermal fluorite vein assemblage.
Identification: Colorless fluorite; the researcher considers the specimen apparently untreated.
Locality: China, according to Soul Body Gems sourcing information.
Evidence for an untreated specimen
The report observes intact trains of fluid inclusions rather than the ruptured inclusions expected after heat treatment. This supports its apparently untreated condition. Bleaching was a market speculation, not a separate treatment test documented in this report.
Yttrium ranges from 1.4 to 2.49 wt.%. Ytterbium and other heavy rare-earth elements are reported in the 0.1–0.15 wt.% range. A hydrothermal fluorite vein assemblage is suggested as the source.
These results are the property of Soul Body Gems, Alexander Falster, and the Maine Mineral & Gem Museum. Any mention requires full acknowledgment.
Understanding the report figures
Use this guide alongside the written findings and the original report transcript. It explains the purpose of each analytical figure and preserves the laboratory’s own figure labels. The interpretations apply to the tested specimen; signals alone do not establish the identity of every similar-looking stone.
Electron microscope image: This view shows small-scale regions selected for analysis. Its brightness contrast helps distinguish regions with different compositions; it is not a photograph of their natural colors. Numbered spots connect this view to the analyses listed in the report.
Laboratory figure caption: Fig.2: Backscattered electron images of fluorescent areas of the specimens in Fig. 1.
Elemental spectrum: The peaks record characteristic X-ray signals from elements in the analyzed spot or area. This is an analysis of that location, not automatically of the entire specimen. Any mineral identification or uncertainty named in the laboratory caption is retained below.
Laboratory figure caption: Fig. 3: Energy dispersive spectrum of spot 1 in Fig. 2. (fluorite)
Read the report findings as text
Sample 1529 (#3 white/colorless sphere), submitted by Soul Body Gems. The header records October 15, 2025; the closing date reads October 14, 2025. An AMRAY 1830 SEM operated at 25 kV acceleration potential, 24 mm working distance, and 0 degrees sample tilt. The specimen was coated with 250 Å carbon; the attached XRF unit operated at 30 kV.
Figure 1: Sphere photograph, 5 cm maximum dimension.
Figure 2: Backscattered electron images of fluorescent areas.
Summary: Colorless fluorite. The peak at 7.38 is a calcium sum peak. Yttrium ranges from 1.4 to 2.49 wt.%. Ytterbium and other heavy rare-earth elements are in the 0.1–0.15 wt.% range. The specimen appears untreated; fluid-inclusion trains are not decrepitated, as they would be if heat-treated. It likely originated in a hydrothermal fluorite vein assemblage. The original report includes its date and signature.
Read the original laboratory report as text
The following text and tables are transcribed from the original laboratory document. Figure captions identify the report images; the laboratory interpretations and limitations are preserved.
Laboratory report 1
Analytical Result Report
Sample id: 1529 (#3 white/colorless sphere)
Submitted by: Soul Body Gems
Date completed: 10-15-2025
Operating conditions: An AMRAY 1830 SEM operated at 25 kV acceleration potential, 24 mm working distance, 0 degrees sample tilt, coated with 250 Å carbon, and also using the attached XRF unit operated at 30 kV.
Fig. 1: Photograph of the specimen. 5 cm maximum dimension.
Fig.2: Backscattered electron images of fluorescent areas of the specimens in Fig. 1.
Fig. 3: Energy dispersive spectrum of spot 1 in Fig. 2. (fluorite)
Summary of findings: This is an interesting sphere! (Fig.1). It is colorless fluorite (Figs. 2 and 3). The peak at 7.38 is a calcium sum peak. The yttrium content ranges from 1.4 to 2,49 wt. %. Ytterbium and the other heavy rare earth elements are in the 0.1 to 0.15 wt. % range. This specimen appears to be untreated, the trains of fluid inclusions (Fig. 1) are not decrepitated which they would be if the specimen was heat treated. It likely came from a hydrothermal fluorite vein assemblage.
Identification: Colorless fluorite; the researcher considers the specimen apparently untreated.
Locality: China, according to Soul Body Gems sourcing information.
Evidence for an untreated specimen
The report observes intact trains of fluid inclusions rather than the ruptured inclusions expected after heat treatment. This supports its apparently untreated condition. Bleaching was a market speculation, not a separate treatment test documented in this report.
Yttrium ranges from 1.4 to 2.49 wt.%. Ytterbium and other heavy rare-earth elements are reported in the 0.1–0.15 wt.% range. A hydrothermal fluorite vein assemblage is suggested as the source.
These results are the property of Soul Body Gems, Alexander Falster, and the Maine Mineral & Gem Museum. Any mention requires full acknowledgment.
Understanding the report figures
Use this guide alongside the written findings and the original report transcript. It explains the purpose of each analytical figure and preserves the laboratory’s own figure labels. The interpretations apply to the tested specimen; signals alone do not establish the identity of every similar-looking stone.
Electron microscope image: This view shows small-scale regions selected for analysis. Its brightness contrast helps distinguish regions with different compositions; it is not a photograph of their natural colors. Numbered spots connect this view to the analyses listed in the report.
Laboratory figure caption: Fig.2: Backscattered electron images of fluorescent areas of the specimens in Fig. 1.
Elemental spectrum: The peaks record characteristic X-ray signals from elements in the analyzed spot or area. This is an analysis of that location, not automatically of the entire specimen. Any mineral identification or uncertainty named in the laboratory caption is retained below.
Laboratory figure caption: Fig. 3: Energy dispersive spectrum of spot 1 in Fig. 2. (fluorite)
Read the report findings as text
Sample 1529 (#3 white/colorless sphere), submitted by Soul Body Gems. The header records October 15, 2025; the closing date reads October 14, 2025. An AMRAY 1830 SEM operated at 25 kV acceleration potential, 24 mm working distance, and 0 degrees sample tilt. The specimen was coated with 250 Å carbon; the attached XRF unit operated at 30 kV.
Figure 1: Sphere photograph, 5 cm maximum dimension.
Figure 2: Backscattered electron images of fluorescent areas.
Summary: Colorless fluorite. The peak at 7.38 is a calcium sum peak. Yttrium ranges from 1.4 to 2.49 wt.%. Ytterbium and other heavy rare-earth elements are in the 0.1–0.15 wt.% range. The specimen appears untreated; fluid-inclusion trains are not decrepitated, as they would be if heat-treated. It likely originated in a hydrothermal fluorite vein assemblage. The original report includes its date and signature.
Read the original laboratory report as text
The following text and tables are transcribed from the original laboratory document. Figure captions identify the report images; the laboratory interpretations and limitations are preserved.
Laboratory report 1
Analytical Result Report
Sample id: 1529 (#3 white/colorless sphere)
Submitted by: Soul Body Gems
Date completed: 10-15-2025
Operating conditions: An AMRAY 1830 SEM operated at 25 kV acceleration potential, 24 mm working distance, 0 degrees sample tilt, coated with 250 Å carbon, and also using the attached XRF unit operated at 30 kV.
Fig. 1: Photograph of the specimen. 5 cm maximum dimension.
Fig.2: Backscattered electron images of fluorescent areas of the specimens in Fig. 1.
Fig. 3: Energy dispersive spectrum of spot 1 in Fig. 2. (fluorite)
Summary of findings: This is an interesting sphere! (Fig.1). It is colorless fluorite (Figs. 2 and 3). The peak at 7.38 is a calcium sum peak. The yttrium content ranges from 1.4 to 2,49 wt. %. Ytterbium and the other heavy rare earth elements are in the 0.1 to 0.15 wt. % range. This specimen appears to be untreated, the trains of fluid inclusions (Fig. 1) are not decrepitated which they would be if the specimen was heat treated. It likely came from a hydrothermal fluorite vein assemblage.
Obsidian Rhyolite (Mexico) · Soul Body Gems, May 2024.
Two specimens from a special, limited Mexican pocket find, examined to understand their volcanic composition and contrasting textures.
Locality: Mexico. Soul Body Gems obtained a limited amount of this find; the shared-pocket history comes from our sourcing records.
Specimen 1 — quartz-filled cavities in rhyolitic material
Sample: 10512 (recent package #4) · Completed: March 20, 2024.
Finding: Quartz-filled rounded cavities in surrounding material of rhyolitic composition, possibly still partly glassy obsidian.
The researcher interprets the rounded cavities as likely filled lithophysae, described in the report as essentially gas bubbles. Trace and alkali elements fit a rhyolite/obsidian composition.
These results are the property of Soul Body Gems, Alexander Falster, and the Maine Mineral & Gem Museum. Any mention requires full acknowledgment.
Understanding the report figures
Use this guide alongside the written findings and the original report transcript. It explains the purpose of each analytical figure and preserves the laboratory’s own figure labels. The interpretations apply to the tested specimen; signals alone do not establish the identity of every similar-looking stone.
Electron microscope image: This view shows small-scale regions selected for analysis. Its brightness contrast helps distinguish regions with different compositions; it is not a photograph of their natural colors. Numbered spots connect this view to the analyses listed in the report.
Laboratory figure caption: Fig.2: Backscattered electron image of an area of the specimen.
Elemental spectrum: The peaks record characteristic X-ray signals from elements in the analyzed spot or area. This is an analysis of that location, not automatically of the entire specimen. Any mineral identification or uncertainty named in the laboratory caption is retained below.
Laboratory figure caption: Fig. 3: Energy dispersive spectrum of spot 1 in Fig. 2 (quartz)
Elemental spectrum: The peaks record characteristic X-ray signals from elements in the analyzed spot or area. This is an analysis of that location, not automatically of the entire specimen. Any mineral identification or uncertainty named in the laboratory caption is retained below.
Laboratory figure caption: Fig. 4: Energy dispersive spectrum of spot 2 in Fig. 2 (rhyolite composition)
Electron microscope image: This view shows small-scale regions selected for analysis. Its brightness contrast helps distinguish regions with different compositions; it is not a photograph of their natural colors. Numbered spots connect this view to the analyses listed in the report.
Laboratory figure caption: Fig.5: Backscattered electron image of another area of the specimen.
Elemental spectrum: The peaks record characteristic X-ray signals from elements in the analyzed spot or area. This is an analysis of that location, not automatically of the entire specimen. Any mineral identification or uncertainty named in the laboratory caption is retained below.
Laboratory figure caption: Fig. 6: Energy dispersive spectrum of spot 1 in Fig. 5 (quartz)
Elemental spectrum: The peaks record characteristic X-ray signals from elements in the analyzed spot or area. This is an analysis of that location, not automatically of the entire specimen. Any mineral identification or uncertainty named in the laboratory caption is retained below.
Laboratory figure caption: Fig. 7: Energy dispersive spectrum of spot 2 in Fig. 5 (rhyolite composition)
Element map: This map shows where the named elements occur within the analyzed area. Its colors represent the laboratory’s selected element channels, rather than the specimen’s visible colors. The caption below preserves any color key or distribution noted by the laboratory.
Laboratory figure caption: Fig. 8: X-ray maps of the area shown in Fig. 5. Silicon: yellow, potassium: red, aluminum: purple.
Elemental spectrum: The peaks record characteristic X-ray signals from elements in the analyzed spot or area. This is an analysis of that location, not automatically of the entire specimen. Any mineral identification or uncertainty named in the laboratory caption is retained below.
Laboratory figure caption: Fig. 3: Energy dispersive spectrum of spot 1 in Fig. 2 (rhyolite composition)
Electron microscope image: This view shows small-scale regions selected for analysis. Its brightness contrast helps distinguish regions with different compositions; it is not a photograph of their natural colors. Numbered spots connect this view to the analyses listed in the report.
Laboratory figure caption: Fig. 5: Backscattered electron image of another area of the specimen.
Elemental spectrum: The peaks record characteristic X-ray signals from elements in the analyzed spot or area. This is an analysis of that location, not automatically of the entire specimen. Any mineral identification or uncertainty named in the laboratory caption is retained below.
Laboratory figure caption: Fig. 6: Energy dispersive spectrum of spot 1 in Fig. 5 (kaolinite)
Read sample 10512 findings and table as text
Sample 10512 (recent package #4), submitted by Soul Body Gems, completed March 20, 2024. An AMRAY 1830 SEM operated at 25 kV acceleration potential, 24 mm working distance, and 0 degrees sample tilt. The specimen was coated with 250 Å carbon; the attached XRF unit operated at 30 kV. A BRUKER Titan X-ray fluorescence spectrometer also operated for 30 seconds at 50, 25, and 10 kV.
Figure 1: Photograph, approximately 55 mm maximum dimension.
Table 1: Minor and trace elements in potassium feldspar, in wt.%
Element
Wt.%
Barium
0.05
Iron
0.33
Manganese
0.01
Sodium
2.54
Potassium
4.11
Summary: Rounded areas, likely filled lithophysae, are filled with quartz. Surrounding material has rhyolitic composition and may still be partly glassy, hence obsidian. Trace and alkali elements fit rhyolite/obsidian. Aluminum compounds trapped in the mapped area suggest polishing with corundum. The report ends with the March 20, 2024 date and signature.
Specimen 2 — rhyolitic composition with kaolinite alteration
Sample: 10513 (recent package #5) · Completed: March 20, 2024.
Finding: Rhyolitic composition, with some areas altered to kaolinite.
The second piece resembles the first compositionally but is described as wholly converted to rhyolitic material. It is very fine-grained and more homogeneous under the microscope than its visible surface pattern suggests.
These results are the property of Soul Body Gems, Alexander Falster, and the Maine Mineral & Gem Museum. Any mention requires full acknowledgment.
Read sample 10513 findings and table as text
Sample 10513 (recent package #5), submitted by Soul Body Gems, completed March 20, 2024. An AMRAY 1830 SEM operated at 25 kV acceleration potential, 24 mm working distance, and 0 degrees sample tilt. The specimen was coated with 250 Å carbon; the attached XRF unit operated at 30 kV. A BRUKER Titan X-ray fluorescence spectrometer operated for 30 seconds at 50, 25, and 10 kV.
Figure 1: Photograph, approximately 55 mm maximum dimension.
Figure 2: Backscattered electron image.
Figures 3 and 4: Rhyolitic-composition spectra.
Figure 5: Backscattered image of another area.
Figure 6: Kaolinite spectrum.
Table 1: Minor and trace elements in potassium feldspar, in wt.%
Element
Wt.%
Barium
0.07
Iron
0.55
Manganese
0.01
Sodium
3.04
Potassium
2.65
Summary: Similar in composition to package sample #4, but described as wholly converted into rhyolitic composition, with local kaolinite alteration. The material is homogeneous and very fine-grained; irregularities visible to the eye are less obvious in backscattered images. The report’s comparative sentence about iron and potassium contains a sample-number inconsistency; the measurements above reproduce its table unchanged. The report ends with the March 20, 2024 date and signature.
Read the original laboratory report as text
The following text and tables are transcribed from the original laboratory document. Figure captions identify the report images; the laboratory interpretations and limitations are preserved.
Laboratory report 1
Analytical Result Report
Sample id: 10512 (recent package #4)
Submitted by: Soul Body Gems
Date completed: 3-20-2024
Operating conditions: An AMRAY 1830 SEM operated at 25 kV acceleration potential, 24 mm working distance, 0 degrees sample tilt, coated with 250 Å carbon, and also using the attached XRF unit operated at 30 kV.
A BRUKER Titan X-ray fluorescence spectrometer was also used and operated for 30 seconds at 50, 25, and 10 kV.
Fig. 1: Photograph of the specimen. Approximately 55 mm maximum dimension.
Fig.2: Backscattered electron image of an area of the specimen.
Fig. 3: Energy dispersive spectrum of spot 1 in Fig. 2 (quartz)
Fig. 4: Energy dispersive spectrum of spot 2 in Fig. 2 (rhyolite composition)
Fig.5: Backscattered electron image of another area of the specimen.
Fig. 6: Energy dispersive spectrum of spot 1 in Fig. 5 (quartz)
Fig. 7: Energy dispersive spectrum of spot 2 in Fig. 5 (rhyolite composition)
Fig. 8: X-ray maps of the area shown in Fig. 5. Silicon: yellow, potassium: red, aluminum: purple.
Table 1: minor and trace elements in the potassium feldspar. (in wt. %)
Laboratory data as recorded in the report
Element
Reported value
Barium
0.05
Iron
0.33
Manganese
0.01
Sodium
2.54
Potassium
4.11
Summary of findings: This specimen (Fig. 1) very interesting. The spherical parts (likely filled lithophysae, essentially gas bubbles) are filled with quartz (Figs. 2,3, 5, and 7 and 8) whereas the surrounding area has a rhyolitic composition (Figs, 2,4,5,7,and 8) or it may even be partially still glassy and thus be an obsidian. Trace and alkali elements fit the overall composition of a rhyolite/obsidian. Incidentally, it appears that the specimen was polished with corundum as the aluminum X-ray maps shows trapped aluminum compounds in Fig.8.
Date: March 20, 2024 Signature
Laboratory report 2
Analytical Result Report
Sample id: 10513 (recent package #5)
Submitted by: Soul Body Gems
Date completed: 3-20-2024
Operating conditions: An AMRAY 1830 SEM operated at 25 kV acceleration potential, 24 mm working distance, 0 degrees sample tilt, coated with 250 Å carbon, and also using the attached XRF unit operated at 30 kV.
A BRUKER Titan X-ray fluorescence spectrometer was also used and operated for 30 seconds at 50, 25, and 10 kV.
Fig. 1: Photograph of the specimen. Approximately 55 mm maximum dimension.
Fig.2: Backscattered electron image of an area of the specimen.
Fig. 3: Energy dispersive spectrum of spot 1 in Fig. 2 (rhyolite composition)
Fig. 4: Energy dispersive spectrum of spot 2 in Fig. 2 (rhyolite composition)
Fig. 5: Backscattered electron image of another area of the specimen.
Fig. 6: Energy dispersive spectrum of spot 1 in Fig. 5 (kaolinite)
Table 1: minor and trace elements in the potassium feldspar. (in wt. %)
Laboratory data as recorded in the report
Element
Reported value
Barium
0.07
Iron
0.55
Manganese
0.01
Sodium
3.04
Potassium
2.65
Summary of findings: This specimen (Fig. 1) very attractive! There is a similarity in composition to sample 4 but it appears to wholly converted into rhyolitic composition (Figs 2-4) with a few areas where alteration to kaolinite has occurred (Figs. 5 and 6). The compositional data also fit a rhyolitic composition but this sample has a little more iron and potassium than sample 5. They are still very similar and may present individual events spaced spatially very closely. An X-ray map of this sample is much more homogeneous and very fine-grained, the irregularities that are visible with the nakked eye are far lless obvious in backscattered electron images, suggesting homogeneity.
Porcelain Jasper SS Rings · Soul Body Gems, November 2024.
Mexican material known by the trade name Porcelain Jasper, tested to clarify its volcanic origin.
Sample: 1094 (#4, porcelain jasper) · Completed: October 2, 2024.
Identification: Silicified rhyolite or obsidian, with minor iron oxides filling fractures.
Locality: Mexico, according to Soul Body Gems sourcing information.
What “silicified” means here
The high silicon signal indicates that additional quartz entered and mineralized pre-existing rhyolite or obsidian. Some fractures contain iron oxide, identified as hematite or goethite without resolving which one.
These results are the property of Soul Body Gems, Alexander Falster, and the Maine Mineral & Gem Museum. Any mention requires full acknowledgment.
Understanding the report figures
Use this guide alongside the written findings and the original report transcript. It explains the purpose of each analytical figure and preserves the laboratory’s own figure labels. The interpretations apply to the tested specimen; signals alone do not establish the identity of every similar-looking stone.
Electron microscope image: This view shows small-scale regions selected for analysis. Its brightness contrast helps distinguish regions with different compositions; it is not a photograph of their natural colors. Numbered spots connect this view to the analyses listed in the report.
Laboratory figure caption: Fig.2: Backscattered electron image of an area of the specimen.
Elemental spectrum: The peaks record characteristic X-ray signals from elements in the analyzed spot or area. This is an analysis of that location, not automatically of the entire specimen. Any mineral identification or uncertainty named in the laboratory caption is retained below.
Laboratory figure caption: Fig. 3: Energy dispersive spectrum of spot 1 in Fig. 2. left (siliicified rhyolite/obsidian)
Elemental spectrum: The peaks record characteristic X-ray signals from elements in the analyzed spot or area. This is an analysis of that location, not automatically of the entire specimen. Any mineral identification or uncertainty named in the laboratory caption is retained below.
Laboratory figure caption: Fig. 4: Energy dispersive spectrum of spot 2 in Fig.2. (iron oxide, hematite or goethite).
Element map: This map shows where the named elements occur within the analyzed area. Its colors represent the laboratory’s selected element channels, rather than the specimen’s visible colors. The caption below preserves any color key or distribution noted by the laboratory.
Laboratory figure caption: Fig. 5: X-ray map of the area shown in Fig. 2: Silicon: yellow, potassium: red., iron: green
Read the report findings as text
Sample 1094 (#4, porcelain jasper), submitted by Soul Body Gems, completed October 2, 2024. An AMRAY 1830 SEM operated at 25 kV acceleration potential, 24 mm working distance, and 0 degrees sample tilt. The specimen was coated with 250 Å carbon; the attached XRF unit operated at 30 kV.
Figure 1: Photograph, approximately 50 mm maximum dimension.
Figure 2: Backscattered electron image.
Figure 3: Spectrum of silicified rhyolite/obsidian.
Figure 4: Iron-oxide spectrum, hematite or goethite.
Figure 5: Elemental map, silicon yellow, potassium red, iron green.
Summary: Silicified rhyolite or obsidian, with minor iron oxides filling fractures. A high silicon peak indicates additional quartz entered and mineralized the pre-existing rock. The report ends with the October 2, 2024 date and signature.
Read the original laboratory report as text
The following text and tables are transcribed from the original laboratory document. Figure captions identify the report images; the laboratory interpretations and limitations are preserved.
Laboratory report 1
Analytical Result Report
Sample id: 1094 (#4, porcelain jasper)
Submitted by: Soul Body Gems
Date completed: 10-2-2024
Operating conditions: An AMRAY 1830 SEM operated at 25 kV acceleration potential, 24 mm working distance, 0 degrees sample tilt, coated with 250 Å carbon, and also using the attached XRF unit operated at 30 kV.
Fig. 1: Photograph of the specimen. Approximately 50mm maximum dimension.
Fig.2: Backscattered electron image of an area of the specimen.
Fig. 3: Energy dispersive spectrum of spot 1 in Fig. 2. left (siliicified rhyolite/obsidian)
Fig. 4: Energy dispersive spectrum of spot 2 in Fig.2. (iron oxide, hematite or goethite).
Fig. 5: X-ray map of the area shown in Fig. 2: Silicon: yellow, potassium: red., iron: green
Summary of findings: This specimen (Fig. 1) is a silicified rhyolite or obsidian (Figs. 2,3 and 5). Minor iron oxides are filling some fractures (Figs. 2 and 4). The high silicon peak indicates that additional quartz was brought in and mineralized the pre-existing rhyolite or obsidian.
Date: 10-2-2024 Signature
Mexican material sold under the names Purple Lace Agate, Amethyst Opal, and Matllali Lace Agate, with distinct purple and white silica-rich portions.
Sample: 1553 (#5 amethyst) · Completed: March 18, 2026.
Finding: Purple amethyst (low-quartz), with a white portion identified as opal-CT containing low-quartz, tridymite, and cristobalite.
Locality: Mexico, according to Soul Body Gems sourcing information.
Amethyst meeting opal-CT
The two colored portions are primarily silicon dioxide, but the white portion has more impurities. Its mixture of silica phases is characteristic of opal crystallizing from an amorphous state, described by the researcher as opal-CT.
All three directory names share this report and its findings.
These results are the property of Soul Body Gems, Alexander Falster, and the Maine Mineral & Gem Museum. Any mention requires full acknowledgment.
Understanding the report figures
Use this guide alongside the written findings and the original report transcript. It explains the purpose of each analytical figure and preserves the laboratory’s own figure labels. The interpretations apply to the tested specimen; signals alone do not establish the identity of every similar-looking stone.
Diffraction scan: This scan helps identify crystalline minerals by comparing the measured pattern with reference patterns. The laboratory interpretation explains which minerals the comparison supports.
Laboratory figure caption: Fig. 2: X-ray diffraction scan of the purple portion on the left and the white portion on the right.
Read the report findings and table as text
Sample 1553 (#5 amethyst), submitted by Soul Body Gems, completed March 18, 2026. A Bruker Titan X-ray fluorescence spectrometer operated at 10, 25, and 50 kV. A Bruker D2-Phaser X-ray diffractometer operated at 30 kV and 10 mA. Figure 1 shows a specimen of 4.5 cm maximum dimension, with a white-area close-up. Figure 2 compares purple and white diffraction scans.
Major and minor elemental composition, in wt.%
Element
Purple portion
White portion
Aluminum
0.05
1.00
Calcium
0.1
0.45
Iron
0.15
0.10
Silicon
46.2
45.4
Summary: Both portions are essentially silicon dioxide, with more impurities in the white portion. Purple material is amethyst, low-quartz. White material is a mixture of low-quartz, tridymite, and cristobalite, typical of opal crystallizing from an amorphous state. This intermediate material is called opal-CT, often found near volcanic activity. The report ends with the March 18, 2026 date and signature.
Read the original laboratory report as text
The following text and tables are transcribed from the original laboratory document. Figure captions identify the report images; the laboratory interpretations and limitations are preserved.
Laboratory report 1
Analytical Result Report
Sample id: 1553 (#5 amethyst)
Submitted by: Soul Body Gems
Date completed: 3-18-2026
Operating conditions: A Bruker Titan X-ray fluorescence spectrometer was used and operated at 10, 25 and 50 kV.
A Bruker D2-Phaser X-ray diffractometer was also used and operated at 30 kV and 10 mA.
Fig. 1: Photograph of the specimen. 4.5 cm maximum dimension. Close-up oof the white area on the right.
Table 1: Major and minor elemental composition of the material, in wt. %.
Laboratory data as recorded in the report
purple
white
Aluminum
0.05
1.00
Calcium
0.1
0.45
Iron
0.15
0.10
Silicon
46.2
45.4
Fig. 2: X-ray diffraction scan of the purple portion on the left and the white portion on the right.
Summary of findings: This is an interesting specimen (Fig. 1). The composition is essentially silicon dioxide for both, moore impurities are present in the white part. The purple portion is amethyst, low-quartz whereas the white portion is a mixture of low-quartz, tridymite and cristobalite which is typical for opal that is crystallizing from the amorphous state. This intermediate material is referred to as opal-CT. This is found often near volcanic activity.
Date: 3-18-2026 Signature
Mexican material sold under the names Purple Lace Agate, Amethyst Opal, and Matllali Lace Agate, with distinct purple and white silica-rich portions.
Sample: 1553 (#5 amethyst) · Completed: March 18, 2026.
Finding: Purple amethyst (low-quartz), with a white portion identified as opal-CT containing low-quartz, tridymite, and cristobalite.
Locality: Mexico, according to Soul Body Gems sourcing information.
Amethyst meeting opal-CT
The two colored portions are primarily silicon dioxide, but the white portion has more impurities. Its mixture of silica phases is characteristic of opal crystallizing from an amorphous state, described by the researcher as opal-CT.
All three directory names share this report and its findings.
These results are the property of Soul Body Gems, Alexander Falster, and the Maine Mineral & Gem Museum. Any mention requires full acknowledgment.
Understanding the report figures
Use this guide alongside the written findings and the original report transcript. It explains the purpose of each analytical figure and preserves the laboratory’s own figure labels. The interpretations apply to the tested specimen; signals alone do not establish the identity of every similar-looking stone.
Diffraction scan: This scan helps identify crystalline minerals by comparing the measured pattern with reference patterns. The laboratory interpretation explains which minerals the comparison supports.
Laboratory figure caption: Fig. 2: X-ray diffraction scan of the purple portion on the left and the white portion on the right.
Read the report findings and table as text
Sample 1553 (#5 amethyst), submitted by Soul Body Gems, completed March 18, 2026. A Bruker Titan X-ray fluorescence spectrometer operated at 10, 25, and 50 kV. A Bruker D2-Phaser X-ray diffractometer operated at 30 kV and 10 mA. Figure 1 shows a specimen of 4.5 cm maximum dimension, with a white-area close-up. Figure 2 compares purple and white diffraction scans.
Major and minor elemental composition, in wt.%
Element
Purple portion
White portion
Aluminum
0.05
1.00
Calcium
0.1
0.45
Iron
0.15
0.10
Silicon
46.2
45.4
Summary: Both portions are essentially silicon dioxide, with more impurities in the white portion. Purple material is amethyst, low-quartz. White material is a mixture of low-quartz, tridymite, and cristobalite, typical of opal crystallizing from an amorphous state. This intermediate material is called opal-CT, often found near volcanic activity. The report ends with the March 18, 2026 date and signature.
Read the original laboratory report as text
The following text and tables are transcribed from the original laboratory document. Figure captions identify the report images; the laboratory interpretations and limitations are preserved.
Laboratory report 1
Analytical Result Report
Sample id: 1553 (#5 amethyst)
Submitted by: Soul Body Gems
Date completed: 3-18-2026
Operating conditions: A Bruker Titan X-ray fluorescence spectrometer was used and operated at 10, 25 and 50 kV.
A Bruker D2-Phaser X-ray diffractometer was also used and operated at 30 kV and 10 mA.
Fig. 1: Photograph of the specimen. 4.5 cm maximum dimension. Close-up oof the white area on the right.
Table 1: Major and minor elemental composition of the material, in wt. %.
Laboratory data as recorded in the report
purple
white
Aluminum
0.05
1.00
Calcium
0.1
0.45
Iron
0.15
0.10
Silicon
46.2
45.4
Fig. 2: X-ray diffraction scan of the purple portion on the left and the white portion on the right.
Summary of findings: This is an interesting specimen (Fig. 1). The composition is essentially silicon dioxide for both, moore impurities are present in the white part. The purple portion is amethyst, low-quartz whereas the white portion is a mixture of low-quartz, tridymite and cristobalite which is typical for opal that is crystallizing from the amorphous state. This intermediate material is referred to as opal-CT. This is found often near volcanic activity.
Date: 3-18-2026 Signature
Mexican material sold under the names Purple Lace Agate, Amethyst Opal, and Matllali Lace Agate, with distinct purple and white silica-rich portions.
Sample: 1553 (#5 amethyst) · Completed: March 18, 2026.
Finding: Purple amethyst (low-quartz), with a white portion identified as opal-CT containing low-quartz, tridymite, and cristobalite.
Locality: Mexico, according to Soul Body Gems sourcing information.
Amethyst meeting opal-CT
The two colored portions are primarily silicon dioxide, but the white portion has more impurities. Its mixture of silica phases is characteristic of opal crystallizing from an amorphous state, described by the researcher as opal-CT.
All three directory names share this report and its findings.
These results are the property of Soul Body Gems, Alexander Falster, and the Maine Mineral & Gem Museum. Any mention requires full acknowledgment.
Understanding the report figures
Use this guide alongside the written findings and the original report transcript. It explains the purpose of each analytical figure and preserves the laboratory’s own figure labels. The interpretations apply to the tested specimen; signals alone do not establish the identity of every similar-looking stone.
Diffraction scan: This scan helps identify crystalline minerals by comparing the measured pattern with reference patterns. The laboratory interpretation explains which minerals the comparison supports.
Laboratory figure caption: Fig. 2: X-ray diffraction scan of the purple portion on the left and the white portion on the right.
Read the report findings and table as text
Sample 1553 (#5 amethyst), submitted by Soul Body Gems, completed March 18, 2026. A Bruker Titan X-ray fluorescence spectrometer operated at 10, 25, and 50 kV. A Bruker D2-Phaser X-ray diffractometer operated at 30 kV and 10 mA. Figure 1 shows a specimen of 4.5 cm maximum dimension, with a white-area close-up. Figure 2 compares purple and white diffraction scans.
Major and minor elemental composition, in wt.%
Element
Purple portion
White portion
Aluminum
0.05
1.00
Calcium
0.1
0.45
Iron
0.15
0.10
Silicon
46.2
45.4
Summary: Both portions are essentially silicon dioxide, with more impurities in the white portion. Purple material is amethyst, low-quartz. White material is a mixture of low-quartz, tridymite, and cristobalite, typical of opal crystallizing from an amorphous state. This intermediate material is called opal-CT, often found near volcanic activity. The report ends with the March 18, 2026 date and signature.
Read the original laboratory report as text
The following text and tables are transcribed from the original laboratory document. Figure captions identify the report images; the laboratory interpretations and limitations are preserved.
Laboratory report 1
Analytical Result Report
Sample id: 1553 (#5 amethyst)
Submitted by: Soul Body Gems
Date completed: 3-18-2026
Operating conditions: A Bruker Titan X-ray fluorescence spectrometer was used and operated at 10, 25 and 50 kV.
A Bruker D2-Phaser X-ray diffractometer was also used and operated at 30 kV and 10 mA.
Fig. 1: Photograph of the specimen. 4.5 cm maximum dimension. Close-up oof the white area on the right.
Table 1: Major and minor elemental composition of the material, in wt. %.
Laboratory data as recorded in the report
purple
white
Aluminum
0.05
1.00
Calcium
0.1
0.45
Iron
0.15
0.10
Silicon
46.2
45.4
Fig. 2: X-ray diffraction scan of the purple portion on the left and the white portion on the right.
Summary of findings: This is an interesting specimen (Fig. 1). The composition is essentially silicon dioxide for both, moore impurities are present in the white part. The purple portion is amethyst, low-quartz whereas the white portion is a mixture of low-quartz, tridymite and cristobalite which is typical for opal that is crystallizing from the amorphous state. This intermediate material is referred to as opal-CT. This is found often near volcanic activity.
Date: 3-18-2026 Signature
A barite specimen from China, identified through chemical analysis and X-ray diffraction.
Sample: 1558 (#5 barite). Report completed: January 29, 2026.
Finding: Both the chemical composition and diffraction pattern confirm barite.
China is the locality recorded in our sourcing notes. The specimen measures approximately 8 cm at its maximum dimension.
These results are the property of Soul Body Gems, Alexander Falster, and the Maine Mineral & Gem Museum. Any mention requires full acknowledgment.
Understanding the report figures
Use this guide alongside the written findings and the original report transcript. It explains the purpose of each analytical figure and preserves the laboratory’s own figure labels. The interpretations apply to the tested specimen; signals alone do not establish the identity of every similar-looking stone.
Diffraction scan: This scan helps identify crystalline minerals by comparing the measured pattern with reference patterns. The laboratory interpretation explains which minerals the comparison supports.
Laboratory figure caption: Fig. 2: X-ray diffraction scan of the specimen with matching reference stick pattern.
Read the report as text
Analytical Result Report
Sample id: 1558 (#5 barite)
Submitted by: Soul Body Gems
Date completed: 1-29-2026
Operating conditions: A Bruker Titan X-ray  fluorescence spectrometer was used and operated at 10, 25 and 50 kV.
A Bruker D2-Phaser X-ray diffractometer was also used in the study and operated at 30 kV and 10 mA.
Fig. 1:  Photograph of the specimens. 8 cm maximum dimension.
.
Fig. 2: X-ray diffraction scan of the specimen with matching reference stick pattern.
Table 1: Chemical composition of the specimen, in wt. %
Summary of findings:  This is a nice specimen of barite (Fig. 1).  The identity has been confirmed both by chemical composition (Table 1) and b X-ray diffraction (Fig. 2).
Date:    1-29--2026                      Signature
Cat Eye Moonstone · October 2025 collection photograph. The report below concerns separately submitted beads.
Moonstone beads from Sri Lanka, also known as Ceylon, tested to identify their feldspar composition.
Sample: 1534 (#5 moonstone). Report completed: November 1, 2025.
Finding: The beads are potassium feldspar, essentially orthoclase.
The optical detail
The report explains that orthoclase displaying adularescence is called moonstone. Thin exsolutions of another feldspar produce the optical effect; in these beads, the researcher describes a broader alignment of those exsolutions rather than the more random arrangement commonly seen.
Sri Lanka is the locality in our sourcing notes. “Ceylon Moonstone” and “Cat Eye Moonstone” are additional names used for this material. The report identifies orthoclase and describes its internal alignment; it does not provide a separate gemological grading of the cat-eye effect.
These results are the property of Soul Body Gems, Alexander Falster, and the Maine Mineral & Gem Museum. Any mention requires full acknowledgment.
Understanding the report figures
Use this guide alongside the written findings and the original report transcript. It explains the purpose of each analytical figure and preserves the laboratory’s own figure labels. The interpretations apply to the tested specimen; signals alone do not establish the identity of every similar-looking stone.
Electron microscope image: This view shows small-scale regions selected for analysis. Its brightness contrast helps distinguish regions with different compositions; it is not a photograph of their natural colors. Numbered spots connect this view to the analyses listed in the report.
Laboratory figure caption: Fig.2: Backscattered electron image of an area of the white hexagonal specimen in Fig. 1.
Elemental spectrum: The peaks record characteristic X-ray signals from elements in the analyzed spot or area. This is an analysis of that location, not automatically of the entire specimen. Any mineral identification or uncertainty named in the laboratory caption is retained below.
Laboratory figure caption: Fig. 3: Energy dispersive spectrum of spot 1 in Fig. 2. (potassium feldspar, orthoclase)
Read the report as text
Analytical Result Report
Sample id: 1534 (#5 moonstone)
Submitted by: Soul Body Gems
Date completed: 11-1-2025
Operating conditions: An AMRAY 1830 SEM operated at 25 kV acceleration potential, 24 mm working distance, 0 degrees sample tilt, coated with 250 Å carbon, and also using the attached XRF unit operated at 30 kV.
Fig. 1:  Photograph of the specimen.  Beads are about 7 mm in diameter.
 Fig.2: Backscattered electron image of an area of the white hexagonal specimen in Fig. 1.
Fig. 3: Energy dispersive spectrum of spot 1 in Fig. 2. (potassium feldspar, orthoclase)
Summary of findings:  These are pretty stones (Fig. 1).   The beads are potassium feldspar, essentially an orthoclase (Figs. 2 and 3).  Orthoclase with the optical effect called ‘adularescence’ is referred to as ‘moonstone’.  This optical effect is due to thin exsolution of a different feldspar, commonly it is more random whereas in these stones there is a broader alignment of these exsolutions.
Date:    11-1-2025                      Signature
Cat Eye Moonstone · October 2025 collection photograph. The report below concerns separately submitted beads.
Moonstone beads from Sri Lanka, also known as Ceylon, tested to identify their feldspar composition.
Sample: 1534 (#5 moonstone). Report completed: November 1, 2025.
Finding: The beads are potassium feldspar, essentially orthoclase.
The optical detail
The report explains that orthoclase displaying adularescence is called moonstone. Thin exsolutions of another feldspar produce the optical effect; in these beads, the researcher describes a broader alignment of those exsolutions rather than the more random arrangement commonly seen.
Sri Lanka is the locality in our sourcing notes. “Ceylon Moonstone” and “Cat Eye Moonstone” are additional names used for this material. The report identifies orthoclase and describes its internal alignment; it does not provide a separate gemological grading of the cat-eye effect.
These results are the property of Soul Body Gems, Alexander Falster, and the Maine Mineral & Gem Museum. Any mention requires full acknowledgment.
Understanding the report figures
Use this guide alongside the written findings and the original report transcript. It explains the purpose of each analytical figure and preserves the laboratory’s own figure labels. The interpretations apply to the tested specimen; signals alone do not establish the identity of every similar-looking stone.
Electron microscope image: This view shows small-scale regions selected for analysis. Its brightness contrast helps distinguish regions with different compositions; it is not a photograph of their natural colors. Numbered spots connect this view to the analyses listed in the report.
Laboratory figure caption: Fig.2: Backscattered electron image of an area of the white hexagonal specimen in Fig. 1.
Elemental spectrum: The peaks record characteristic X-ray signals from elements in the analyzed spot or area. This is an analysis of that location, not automatically of the entire specimen. Any mineral identification or uncertainty named in the laboratory caption is retained below.
Laboratory figure caption: Fig. 3: Energy dispersive spectrum of spot 1 in Fig. 2. (potassium feldspar, orthoclase)
Read the report as text
Analytical Result Report
Sample id: 1534 (#5 moonstone)
Submitted by: Soul Body Gems
Date completed: 11-1-2025
Operating conditions: An AMRAY 1830 SEM operated at 25 kV acceleration potential, 24 mm working distance, 0 degrees sample tilt, coated with 250 Å carbon, and also using the attached XRF unit operated at 30 kV.
Fig. 1:  Photograph of the specimen.  Beads are about 7 mm in diameter.
 Fig.2: Backscattered electron image of an area of the white hexagonal specimen in Fig. 1.
Fig. 3: Energy dispersive spectrum of spot 1 in Fig. 2. (potassium feldspar, orthoclase)
Summary of findings:  These are pretty stones (Fig. 1).   The beads are potassium feldspar, essentially an orthoclase (Figs. 2 and 3).  Orthoclase with the optical effect called ‘adularescence’ is referred to as ‘moonstone’.  This optical effect is due to thin exsolution of a different feldspar, commonly it is more random whereas in these stones there is a broader alignment of these exsolutions.
Date:    11-1-2025                      Signature
Cat Eye Moonstone · October 2025 collection photograph. The report below concerns separately submitted beads.
Moonstone beads from Sri Lanka, also known as Ceylon, tested to identify their feldspar composition.
Sample: 1534 (#5 moonstone). Report completed: November 1, 2025.
Finding: The beads are potassium feldspar, essentially orthoclase.
The optical detail
The report explains that orthoclase displaying adularescence is called moonstone. Thin exsolutions of another feldspar produce the optical effect; in these beads, the researcher describes a broader alignment of those exsolutions rather than the more random arrangement commonly seen.
Sri Lanka is the locality in our sourcing notes. “Ceylon Moonstone” and “Cat Eye Moonstone” are additional names used for this material. The report identifies orthoclase and describes its internal alignment; it does not provide a separate gemological grading of the cat-eye effect.
These results are the property of Soul Body Gems, Alexander Falster, and the Maine Mineral & Gem Museum. Any mention requires full acknowledgment.
Understanding the report figures
Use this guide alongside the written findings and the original report transcript. It explains the purpose of each analytical figure and preserves the laboratory’s own figure labels. The interpretations apply to the tested specimen; signals alone do not establish the identity of every similar-looking stone.
Electron microscope image: This view shows small-scale regions selected for analysis. Its brightness contrast helps distinguish regions with different compositions; it is not a photograph of their natural colors. Numbered spots connect this view to the analyses listed in the report.
Laboratory figure caption: Fig.2: Backscattered electron image of an area of the white hexagonal specimen in Fig. 1.
Elemental spectrum: The peaks record characteristic X-ray signals from elements in the analyzed spot or area. This is an analysis of that location, not automatically of the entire specimen. Any mineral identification or uncertainty named in the laboratory caption is retained below.
Laboratory figure caption: Fig. 3: Energy dispersive spectrum of spot 1 in Fig. 2. (potassium feldspar, orthoclase)
Read the report as text
Analytical Result Report
Sample id: 1534 (#5 moonstone)
Submitted by: Soul Body Gems
Date completed: 11-1-2025
Operating conditions: An AMRAY 1830 SEM operated at 25 kV acceleration potential, 24 mm working distance, 0 degrees sample tilt, coated with 250 Å carbon, and also using the attached XRF unit operated at 30 kV.
Fig. 1:  Photograph of the specimen.  Beads are about 7 mm in diameter.
 Fig.2: Backscattered electron image of an area of the white hexagonal specimen in Fig. 1.
Fig. 3: Energy dispersive spectrum of spot 1 in Fig. 2. (potassium feldspar, orthoclase)
Summary of findings:  These are pretty stones (Fig. 1).   The beads are potassium feldspar, essentially an orthoclase (Figs. 2 and 3).  Orthoclase with the optical effect called ‘adularescence’ is referred to as ‘moonstone’.  This optical effect is due to thin exsolution of a different feldspar, commonly it is more random whereas in these stones there is a broader alignment of these exsolutions.
Date:    11-1-2025                      Signature
A patterned tower from India, sold as Rainforest Jasper and analyzed to identify its composition.
Sample: 1587 (#5 from India). Report completed: July 15, 2026.
Finding: Mainly fine-grained quartz. The principal difference between the brown and white areas is their iron content.
What the analysis shows
The brown area contains 2.2 wt. % iron, compared with 0.05 wt. % in the white area. Small amounts of copper and chromium were also recorded in the brown area; the researcher states that these concentrations are too low to affect the color.
“Rainforest Jasper” is the market name for this specimen. India is the locality in our sourcing notes; the report does not establish a mine of origin or equate this specimen with material from other localities sold under the same name.
These results are the property of Soul Body Gems, Alexander Falster, and the Maine Mineral & Gem Museum. Any mention requires full acknowledgment.
Read the report as text
Analytical Result Report. Sample 1587 (#5 from India), submitted by Soul Body Gems. Completed July 15, 2026.
Operating conditions: Bruker Titan X-ray fluorescence spectrometer operated at 10, 25 and 50 kV.
Figure 1: Photograph of the specimen; caption gives 1.6 cm maximum dimension.
Table 1: Major and minor elemental composition, wt. %
Element
Brown area
White area
Aluminum
0.1
0.2
Chromium
0.05
nd
Copper
0.1
nd
Iron
2.2
0.05
Silicon
44.3
46.1
Sulfur
0.1
nd
Summary of findings: This is a pretty tower. It is composed mainly of fine-grained quartz and the main difference between the brown and white areas is the iron content (Table 1). Interesting to note is a small copper and chromium content, too little to affect the color.
Nightshade Sunstone · Soul Body Gems, September 2024.
A dark patterned specimen known by the market names Night Shade Sunstone and Arusha Confetti Sunstone.
Report: Recent package #6, printed sample ID 10513, completed March 20, 2024.
Finding: Sodic plagioclase-rich material, likely albite, with astrophyllite and nepheline. The researcher describes an agpaitic nepheline syenite assemblage.
Identification and market names
This material is sometimes marketed as containing larvikite. This report does not identify larvikite; it identifies the mineral assemblage above. Astrophyllite was identified in the tested specimen.
The names “Night Shade Sunstone” and “Arusha Confetti Sunstone” are retained so visitors can find the results under either market name. The report does not separately establish a sunstone optical effect or a mine of origin.
November 2025 personal collection freeform, shown under its supplied market name. The report below applies to the separately submitted specimen, sample 10513.
These results are the property of Soul Body Gems, Alexander Falster, and the Maine Mineral & Gem Museum. Any mention requires full acknowledgment.
Understanding the report figures
Use this guide alongside the written findings and the original report transcript. It explains the purpose of each analytical figure and preserves the laboratory’s own figure labels. The interpretations apply to the tested specimen; signals alone do not establish the identity of every similar-looking stone.
Electron microscope image: This view shows small-scale regions selected for analysis. Its brightness contrast helps distinguish regions with different compositions; it is not a photograph of their natural colors. Numbered spots connect this view to the analyses listed in the report.
Laboratory figure caption: Fig.2: Backscattered electron image of an area of the specimen.
Elemental spectrum: The peaks record characteristic X-ray signals from elements in the analyzed spot or area. This is an analysis of that location, not automatically of the entire specimen. Any mineral identification or uncertainty named in the laboratory caption is retained below.
Laboratory figure caption: Fig. 3: Energy dispersive spectrum of spot 1 in Fig. 2 (sodic plagioclase)
Electron microscope image: This view shows small-scale regions selected for analysis. Its brightness contrast helps distinguish regions with different compositions; it is not a photograph of their natural colors. Numbered spots connect this view to the analyses listed in the report.
Laboratory figure caption: Fig.4: Backscattered electron image of another area of the specimen.
Elemental spectrum: The peaks record characteristic X-ray signals from elements in the analyzed spot or area. This is an analysis of that location, not automatically of the entire specimen. Any mineral identification or uncertainty named in the laboratory caption is retained below.
Laboratory figure caption: Fig. 5: Energy dispersive spectrum of spot 1 in Fig. 5 (astrophyllite)
Elemental spectrum: The peaks record characteristic X-ray signals from elements in the analyzed spot or area. This is an analysis of that location, not automatically of the entire specimen. Any mineral identification or uncertainty named in the laboratory caption is retained below.
Laboratory figure caption: Fig. 6: Energy dispersive spectrum of spot 2 in Fig. 5 (sodic plagioclase)
Elemental spectrum: The peaks record characteristic X-ray signals from elements in the analyzed spot or area. This is an analysis of that location, not automatically of the entire specimen. Any mineral identification or uncertainty named in the laboratory caption is retained below.
Laboratory figure caption: Fig. 7: Energy dispersive spectrum of spot 2 in Fig. 5 (nepheline)
Element map: This map shows where the named elements occur within the analyzed area. Its colors represent the laboratory’s selected element channels, rather than the specimen’s visible colors. The caption below preserves any color key or distribution noted by the laboratory.
Laboratory figure caption: Fig. 8: X-ray maps of the area shown in Fig. 2. Sodium: yellow, potassium: purple.
Read the report as text
Analytical Result Report
Sample id: 10513 (recent package #6)
Submitted by: Soul Body Gems
Date completed: 3-20-2024
Operating conditions: An AMRAY 1830 SEM operated at 25 kV acceleration potential, 24 mm working distance, 0 degrees sample tilt, coated with 250 Å carbon, and also using the attached XRF unit operated at 30 kV.
A BRUKER Titan X-ray fluorescence spectrometer was also used and operated for 30 seconds at 50, 25, and 10 kV.
Fig. 1:  Photograph of the specimen.  Approximately 20 mm maximum dimension.
Fig.2: Backscattered electron image of an area of the specimen.
Fig. 3: Energy dispersive spectrum of spot 1 in Fig. 2 (sodic plagioclase)
Fig.4: Backscattered electron image of another area of the specimen.
Fig. 5: Energy dispersive spectrum of spot 1 in Fig. 5 (astrophyllite)
Fig. 6: Energy dispersive spectrum of spot 2 in Fig. 5 (sodic plagioclase)
Fig. 7: Energy dispersive spectrum of spot 2 in Fig. 5 (nepheline)
Fig. 8: X-ray maps of the area shown in Fig. 2.  Sodium: yellow, potassium: purple.
Summary of findings:  This specimen (Fig. 1) is a surprising one.  It is sodic plagioclase-rich (likely albite (Figs. 2,3, 4 and 6).  It also contains astrophyllite (Figs. 4 and 5) and nepheline (Figs. 4 and 6).  Thus, this is a typical nepheline syenite assemblage and it is of the agpaitic type.  Other minerals to be expected would be the eudialyte group but not zircon.  The sodium zirconium silicates would be the dominant zirconium species.
Date:    March 20, 2024                      Signature
Archive note: the printed sample number also appears on another report. This record is distinguished by its package #6 designation, specimen photograph and findings. Expected additional minerals mentioned in the report are predictions, not confirmed identifications.
November 2025 personal collection freeform, shown under its supplied market name. The report below applies to the separately submitted specimen, sample 10513.
A dark patterned specimen known by the market names Night Shade Sunstone and Arusha Confetti Sunstone.
Report: Recent package #6, printed sample ID 10513, completed March 20, 2024.
Finding: Sodic plagioclase-rich material, likely albite, with astrophyllite and nepheline. The researcher describes an agpaitic nepheline syenite assemblage.
Identification and market names
This material is sometimes marketed as containing larvikite. This report does not identify larvikite; it identifies the mineral assemblage above. Astrophyllite was identified in the tested specimen.
The names “Night Shade Sunstone” and “Arusha Confetti Sunstone” are retained so visitors can find the results under either market name. The report does not separately establish a sunstone optical effect or a mine of origin.
These results are the property of Soul Body Gems, Alexander Falster, and the Maine Mineral & Gem Museum. Any mention requires full acknowledgment.
Understanding the report figures
Use this guide alongside the written findings and the original report transcript. It explains the purpose of each analytical figure and preserves the laboratory’s own figure labels. The interpretations apply to the tested specimen; signals alone do not establish the identity of every similar-looking stone.
Electron microscope image: This view shows small-scale regions selected for analysis. Its brightness contrast helps distinguish regions with different compositions; it is not a photograph of their natural colors. Numbered spots connect this view to the analyses listed in the report.
Laboratory figure caption: Fig.2: Backscattered electron image of an area of the specimen.
Elemental spectrum: The peaks record characteristic X-ray signals from elements in the analyzed spot or area. This is an analysis of that location, not automatically of the entire specimen. Any mineral identification or uncertainty named in the laboratory caption is retained below.
Laboratory figure caption: Fig. 3: Energy dispersive spectrum of spot 1 in Fig. 2 (sodic plagioclase)
Electron microscope image: This view shows small-scale regions selected for analysis. Its brightness contrast helps distinguish regions with different compositions; it is not a photograph of their natural colors. Numbered spots connect this view to the analyses listed in the report.
Laboratory figure caption: Fig.4: Backscattered electron image of another area of the specimen.
Elemental spectrum: The peaks record characteristic X-ray signals from elements in the analyzed spot or area. This is an analysis of that location, not automatically of the entire specimen. Any mineral identification or uncertainty named in the laboratory caption is retained below.
Laboratory figure caption: Fig. 5: Energy dispersive spectrum of spot 1 in Fig. 5 (astrophyllite)
Elemental spectrum: The peaks record characteristic X-ray signals from elements in the analyzed spot or area. This is an analysis of that location, not automatically of the entire specimen. Any mineral identification or uncertainty named in the laboratory caption is retained below.
Laboratory figure caption: Fig. 6: Energy dispersive spectrum of spot 2 in Fig. 5 (sodic plagioclase)
Elemental spectrum: The peaks record characteristic X-ray signals from elements in the analyzed spot or area. This is an analysis of that location, not automatically of the entire specimen. Any mineral identification or uncertainty named in the laboratory caption is retained below.
Laboratory figure caption: Fig. 7: Energy dispersive spectrum of spot 2 in Fig. 5 (nepheline)
Element map: This map shows where the named elements occur within the analyzed area. Its colors represent the laboratory’s selected element channels, rather than the specimen’s visible colors. The caption below preserves any color key or distribution noted by the laboratory.
Laboratory figure caption: Fig. 8: X-ray maps of the area shown in Fig. 2. Sodium: yellow, potassium: purple.
Read the report as text
Analytical Result Report
Sample id: 10513 (recent package #6)
Submitted by: Soul Body Gems
Date completed: 3-20-2024
Operating conditions: An AMRAY 1830 SEM operated at 25 kV acceleration potential, 24 mm working distance, 0 degrees sample tilt, coated with 250 Å carbon, and also using the attached XRF unit operated at 30 kV.
A BRUKER Titan X-ray fluorescence spectrometer was also used and operated for 30 seconds at 50, 25, and 10 kV.
Fig. 1:  Photograph of the specimen.  Approximately 20 mm maximum dimension.
Fig.2: Backscattered electron image of an area of the specimen.
Fig. 3: Energy dispersive spectrum of spot 1 in Fig. 2 (sodic plagioclase)
Fig.4: Backscattered electron image of another area of the specimen.
Fig. 5: Energy dispersive spectrum of spot 1 in Fig. 5 (astrophyllite)
Fig. 6: Energy dispersive spectrum of spot 2 in Fig. 5 (sodic plagioclase)
Fig. 7: Energy dispersive spectrum of spot 2 in Fig. 5 (nepheline)
Fig. 8: X-ray maps of the area shown in Fig. 2.  Sodium: yellow, potassium: purple.
Summary of findings:  This specimen (Fig. 1) is a surprising one.  It is sodic plagioclase-rich (likely albite (Figs. 2,3, 4 and 6).  It also contains astrophyllite (Figs. 4 and 5) and nepheline (Figs. 4 and 6).  Thus, this is a typical nepheline syenite assemblage and it is of the agpaitic type.  Other minerals to be expected would be the eudialyte group but not zircon.  The sodium zirconium silicates would be the dominant zirconium species.
Date:    March 20, 2024                      Signature
Archive note: the printed sample number also appears on another report. This record is distinguished by its package #6 designation, specimen photograph and findings. Expected additional minerals mentioned in the report are predictions, not confirmed identifications.
A dark patterned specimen known by the market names Night Shade Sunstone and Arusha Confetti Sunstone.
Report: Recent package #6, printed sample ID 10513, completed March 20, 2024.
Finding: Sodic plagioclase-rich material, likely albite, with astrophyllite and nepheline. The researcher describes an agpaitic nepheline syenite assemblage.
Misleading market name: The tested material was sold as sunstone with larvikite, but the report identifies likely albite, astrophyllite and nepheline—not larvikite. Tanzania is the locality recorded in our sourcing notes.
Identification and market names
This material is sometimes marketed as containing larvikite. This report does not identify larvikite; it identifies the mineral assemblage above. Astrophyllite was identified in the tested specimen.
The names “Night Shade Sunstone” and “Arusha Confetti Sunstone” are retained so visitors can find the results under either market name. The report does not separately establish a sunstone optical effect or a mine of origin.
These results are the property of Soul Body Gems, Alexander Falster, and the Maine Mineral & Gem Museum. Any mention requires full acknowledgment.
Understanding the report figures
Use this guide alongside the written findings and the original report transcript. It explains the purpose of each analytical figure and preserves the laboratory’s own figure labels. The interpretations apply to the tested specimen; signals alone do not establish the identity of every similar-looking stone.
Electron microscope image: This view shows small-scale regions selected for analysis. Its brightness contrast helps distinguish regions with different compositions; it is not a photograph of their natural colors. Numbered spots connect this view to the analyses listed in the report.
Laboratory figure caption: Fig.2: Backscattered electron image of an area of the specimen.
Elemental spectrum: The peaks record characteristic X-ray signals from elements in the analyzed spot or area. This is an analysis of that location, not automatically of the entire specimen. Any mineral identification or uncertainty named in the laboratory caption is retained below.
Laboratory figure caption: Fig. 3: Energy dispersive spectrum of spot 1 in Fig. 2 (sodic plagioclase)
Electron microscope image: This view shows small-scale regions selected for analysis. Its brightness contrast helps distinguish regions with different compositions; it is not a photograph of their natural colors. Numbered spots connect this view to the analyses listed in the report.
Laboratory figure caption: Fig.4: Backscattered electron image of another area of the specimen.
Elemental spectrum: The peaks record characteristic X-ray signals from elements in the analyzed spot or area. This is an analysis of that location, not automatically of the entire specimen. Any mineral identification or uncertainty named in the laboratory caption is retained below.
Laboratory figure caption: Fig. 5: Energy dispersive spectrum of spot 1 in Fig. 5 (astrophyllite)
Elemental spectrum: The peaks record characteristic X-ray signals from elements in the analyzed spot or area. This is an analysis of that location, not automatically of the entire specimen. Any mineral identification or uncertainty named in the laboratory caption is retained below.
Laboratory figure caption: Fig. 6: Energy dispersive spectrum of spot 2 in Fig. 5 (sodic plagioclase)
Elemental spectrum: The peaks record characteristic X-ray signals from elements in the analyzed spot or area. This is an analysis of that location, not automatically of the entire specimen. Any mineral identification or uncertainty named in the laboratory caption is retained below.
Laboratory figure caption: Fig. 7: Energy dispersive spectrum of spot 2 in Fig. 5 (nepheline)
Element map: This map shows where the named elements occur within the analyzed area. Its colors represent the laboratory’s selected element channels, rather than the specimen’s visible colors. The caption below preserves any color key or distribution noted by the laboratory.
Laboratory figure caption: Fig. 8: X-ray maps of the area shown in Fig. 2. Sodium: yellow, potassium: purple.
Read the report as text
Analytical Result Report
Sample id: 10513 (recent package #6)
Submitted by: Soul Body Gems
Date completed: 3-20-2024
Operating conditions: An AMRAY 1830 SEM operated at 25 kV acceleration potential, 24 mm working distance, 0 degrees sample tilt, coated with 250 Å carbon, and also using the attached XRF unit operated at 30 kV.
A BRUKER Titan X-ray fluorescence spectrometer was also used and operated for 30 seconds at 50, 25, and 10 kV.
Fig. 1:  Photograph of the specimen.  Approximately 20 mm maximum dimension.
Fig.2: Backscattered electron image of an area of the specimen.
Fig. 3: Energy dispersive spectrum of spot 1 in Fig. 2 (sodic plagioclase)
Fig.4: Backscattered electron image of another area of the specimen.
Fig. 5: Energy dispersive spectrum of spot 1 in Fig. 5 (astrophyllite)
Fig. 6: Energy dispersive spectrum of spot 2 in Fig. 5 (sodic plagioclase)
Fig. 7: Energy dispersive spectrum of spot 2 in Fig. 5 (nepheline)
Fig. 8: X-ray maps of the area shown in Fig. 2.  Sodium: yellow, potassium: purple.
Summary of findings:  This specimen (Fig. 1) is a surprising one.  It is sodic plagioclase-rich (likely albite (Figs. 2,3, 4 and 6).  It also contains astrophyllite (Figs. 4 and 5) and nepheline (Figs. 4 and 6).  Thus, this is a typical nepheline syenite assemblage and it is of the agpaitic type.  Other minerals to be expected would be the eudialyte group but not zircon.  The sodium zirconium silicates would be the dominant zirconium species.
Date:    March 20, 2024                      Signature
Archive note: the printed sample number also appears on another report. This record is distinguished by its package #6 designation, specimen photograph and findings. Expected additional minerals mentioned in the report are predictions, not confirmed identifications.
Fluorite with "Mica" · Soul Body Gems, November 2024.
Fluorite from China, often sold as “Fluorite with Mica” because of its reflective internal features.
Sample: 1095 (#6 fluorite). Completed: October 2, 2024.
Finding: No muscovite was detected in the several surface-reaching areas scanned. The report interprets the reflective interior areas as localized grain boundaries and small cleavage planes.
The reflections are not identified as mica
The laboratory found polycrystalline fluorite with oscillatory zoning. Small amounts of yttrium and heavy rare earth elements, approximately 0.1–0.3 wt. %, account for the zoning seen in backscattered electron imaging. A line scan tracked yttrium, ytterbium and erbium.
The popular mica description is not supported by this analysis. The report’s precise observation is that muscovite was not detected in the areas scanned; the reflective features were interpreted as boundaries and cleavage within the fluorite.
Locality: China, according to Soul Body Gems sourcing information.
These results are the property of Soul Body Gems, Alexander Falster, and the Maine Mineral & Gem Museum. Any mention requires full acknowledgment.
Understanding the report figures
Use this guide alongside the written findings and the original report transcript. It explains the purpose of each analytical figure and preserves the laboratory’s own figure labels. The interpretations apply to the tested specimen; signals alone do not establish the identity of every similar-looking stone.
Electron microscope image: This view shows small-scale regions selected for analysis. Its brightness contrast helps distinguish regions with different compositions; it is not a photograph of their natural colors. Numbered spots connect this view to the analyses listed in the report.
Laboratory figure caption: Fig.2: Backscattered electron image of an area of the specimen.
Elemental spectrum: The peaks record characteristic X-ray signals from elements in the analyzed spot or area. This is an analysis of that location, not automatically of the entire specimen. Any mineral identification or uncertainty named in the laboratory caption is retained below.
Laboratory figure caption: Fig. 3: Energy dispersive spectrum of spot 1 in Fig. 2. left (fluorite)
Elemental spectrum: The peaks record characteristic X-ray signals from elements in the analyzed spot or area. This is an analysis of that location, not automatically of the entire specimen. Any mineral identification or uncertainty named in the laboratory caption is retained below.
Laboratory figure caption: Fig. 4: Energy dispersive line scan of the area shown in Fig 2. Scan was vertical across the middle of the image.
Read the report as text
Analytical Result Report
Sample id: 1095 (#6, fluorite)
Submitted by: Soul Body Gems
Date completed: 10-2-2024
Operating conditions: An AMRAY 1830 SEM operated at 25 kV acceleration potential, 24 mm working distance, 0 degrees sample tilt, coated with 250 Å carbon, and also using the attached XRF unit operated at 30 kV.
Fig. 1:  Photograph of the specimen.  Approximately 40mm maximum dimension.

Fig.2: Backscattered electron image of an area of the specimen.
Fig. 3: Energy dispersive spectrum of spot 1 in Fig. 2. left  (fluorite)
Fig. 4: Energy dispersive line scan of the area shown in Fig 2.  Scan was vertical across the middle of the image.
Summary of findings:  This specimen (Fig. 1) is very interesting, oscillatory zoning is clearly visible in Fig. 2.  This is caused by small amounts of heavy rare earth elements and yttrium.  Even though the concentration was low (0.1-0.3 wt. %), it did affect the back scattered electron production, but it was not high enough to produce good X-ray maps.  A line scan was produced (Fig. 4) to show the variability of three select elements: yttrium in red, ytterbium I blue and erbium in green.  No muscovite was detected penetrating to the surface in several areas scanned, it appears they reflecting interior areas are localized grain boundaries and small cleavage planes.  Fig. 2 indicates that the material is polycrystalline.
Date:    10-2-2024                      Signature
Quartz from a newer Turkish find reported in 2025, sold as citrine but identified as externally iron-stained quartz.
Sample: 1559 (#6 citrine?). Completed: March 27, 2026.
Finding: Not citrine. The color comes from a thin iron-oxide film on the quartz rather than internal coloration.
Where the color comes from
The researcher describes coarse drusy quartz deposited after brittle deformation fractured the surrounding rock and hydrothermal fluids entered it. The coating is mainly fine-grained hematite, with magnesium, calcium and manganese also recorded in the report’s discussion. Analysis of a fresh surface did not detect iron, supporting the distinction between the quartz interior and its coating.
Provenance: Turkey; the 2025 discovery date is from Soul Body Gems sourcing notes.
These results are the property of Soul Body Gems, Alexander Falster, and the Maine Mineral & Gem Museum. Any mention requires full acknowledgment.
Read the report as text
Analytical Result Report
Sample id: 1559 (#6 citrine?)
Submitted by: Soul Body Gems
Date completed: 3-27-2026
Operating conditions: A Bruker Titan X-ray  fluorescence spectrometer was used and operated at 10, 25 and 50 kV.
A Bruker D2-Phaser X-ray diffractometer was also used and operated at 30 kV and 10 mA.

Fig. 1:  Photograph of the specimen.  9 cm maximum dimension.   Close-up oof the white area on the right.
Table 1: Major and minor elemental composition of the material, in wt. %. From a fresh surface
Summary of findings:  This is an interesting specimen (Fig. 1).  It is a coarse drusy quartz specimen from a brecciated zone of country rock that has undergone brittle deformation  followed by hydrothermal fluid invasion which deposited the quartz crystals. The color oof the quartz is caused by a thin film of iron oxides and is not internal (Table 1).  There is plenty iron oxide present on coating and it is mainly fine-grained hematite plus several  wt. % of magnesium , around 1 wt. % calcium and less than  1  wt. % manganese.  This is not citrine, just stained quartz.
Date:    3-27-2026                      Signature
Table 1: Fresh-surface major and minor elemental composition, wt. %
Element
Fresh surface
Aluminum
0.07
Calcium
0.01
Iron
nd
Silicon
46.5
Quartz from a newer Turkish find reported in 2025, sold as citrine but identified as externally iron-stained quartz.
Sample: 1559 (#6 citrine?). Completed: March 27, 2026.
Finding: Not citrine. The color comes from a thin iron-oxide film on the quartz rather than internal coloration.
Where the color comes from
The researcher describes coarse drusy quartz deposited after brittle deformation fractured the surrounding rock and hydrothermal fluids entered it. The coating is mainly fine-grained hematite, with magnesium, calcium and manganese also recorded in the report’s discussion. Analysis of a fresh surface did not detect iron, supporting the distinction between the quartz interior and its coating.
Provenance: Turkey; the 2025 discovery date is from Soul Body Gems sourcing notes.
These results are the property of Soul Body Gems, Alexander Falster, and the Maine Mineral & Gem Museum. Any mention requires full acknowledgment.
Read the report as text
Analytical Result Report
Sample id: 1559 (#6 citrine?)
Submitted by: Soul Body Gems
Date completed: 3-27-2026
Operating conditions: A Bruker Titan X-ray  fluorescence spectrometer was used and operated at 10, 25 and 50 kV.
A Bruker D2-Phaser X-ray diffractometer was also used and operated at 30 kV and 10 mA.

Fig. 1:  Photograph of the specimen.  9 cm maximum dimension.   Close-up oof the white area on the right.
Table 1: Major and minor elemental composition of the material, in wt. %. From a fresh surface
Summary of findings:  This is an interesting specimen (Fig. 1).  It is a coarse drusy quartz specimen from a brecciated zone of country rock that has undergone brittle deformation  followed by hydrothermal fluid invasion which deposited the quartz crystals. The color oof the quartz is caused by a thin film of iron oxides and is not internal (Table 1).  There is plenty iron oxide present on coating and it is mainly fine-grained hematite plus several  wt. % of magnesium , around 1 wt. % calcium and less than  1  wt. % manganese.  This is not citrine, just stained quartz.
Date:    3-27-2026                      Signature
Table 1: Fresh-surface major and minor elemental composition, wt. %
Element
Fresh surface
Aluminum
0.07
Calcium
0.01
Iron
nd
Silicon
46.5
Silver Moon Actinolite is the new trade name for an Indian find with a particularly silver-blue appearance compared with the actinolite we usually encounter.
Sample: 1572 (#6 new find from India). Completed: June 2, 2026.
Finding: Chemical composition and X-ray diffraction confirm an iron-rich member of the actinolite–tremolite series.
A distinctive appearance, a tested identity
The identified amphibole is the specimen’s main component. The researcher considers a metamorphic origin most likely. “Silver Moon” describes the trade name and visual character; the report does not identify metallic silver or determine the cause of the blue or silver appearance.
Locality: India, according to Soul Body Gems sourcing notes.
These results are the property of Soul Body Gems, Alexander Falster, and the Maine Mineral & Gem Museum. Any mention requires full acknowledgment.
Understanding the report figures
Use this guide alongside the written findings and the original report transcript. It explains the purpose of each analytical figure and preserves the laboratory’s own figure labels. The interpretations apply to the tested specimen; signals alone do not establish the identity of every similar-looking stone.
Diffraction scan: This scan helps identify crystalline minerals by comparing the measured pattern with reference patterns. The laboratory interpretation explains which minerals the comparison supports.
Laboratory figure caption: Fig. 2: X-ray diffraction scan of the specimen with actinolite stick pattern in red.
Read the report as text
Analytical Result Report
Sample id: 1572 (#6 new find from India)
Submitted by: Soul Body Gems
Date completed: 6-2-2026
Operating conditions: A Bruker Titan X-ray  fluorescence spectrometer was used and operated at 10, 25 and 50 kV.
A Bruker D2-Phaser X-ray diffractometer was also used and operated at 30 kV and 10 mA.


Fig. 1:  Photograph of the specimens.  6.5 cm maximum dimension.
Table 1: Major and minor elemental composition of the material, in wt. %.
Fig. 2: X-ray diffraction scan of the specimen with actinolite stick pattern in red.
Summary of findings:  This is a pretty specimen.  Both chemical composition (Table 1) and X-ray diffraction (Fig. 2) confirm the iron-rich member of the actinolite-tremolite series.  This is essentially the main component of the specimen, most likely of metamorphic origin.
Date:    6-2-2026                      Signature
Table 1: Major and minor elemental composition, wt. %
Element
This specimen
Aluminum
1.55
Calcium
8.04
Iron
8.87
Magnesium
10.23
Manganese
0.14
Potassium
0.25
Silicon
25.45
A brown-and-metallic palm stone with a striking combination of carbonate and iron–titanium minerals. Its market name remains unknown in our archive.
Report: Printed sample 1565 (#6), completed February 25, 2026.
Metallic portion: Ilmenite, hematite and rutile, with a little calcite.
Brown portion: Ankerite with a little calcite.
Two contrasting mineral areas
The metallic area is rich in iron and titanium. X-ray diffraction identifies ilmenite, hematite and rutile. The researcher suggests rutile, and at least some hematite, developed as ilmenite broke down under oxidizing conditions. This formation history is an interpretation, while the mineral identifications are analytical findings.
The brown area is carbonate-rich and was identified as ankerite with some calcite. No locality was supplied for this entry.
These results are the property of Soul Body Gems, Alexander Falster, and the Maine Mineral & Gem Museum. Any mention requires full acknowledgment.
Understanding the report figures
Use this guide alongside the written findings and the original report transcript. It explains the purpose of each analytical figure and preserves the laboratory’s own figure labels. The interpretations apply to the tested specimen; signals alone do not establish the identity of every similar-looking stone.
Diffraction scan: This scan helps identify crystalline minerals by comparing the measured pattern with reference patterns. The laboratory interpretation explains which minerals the comparison supports.
Laboratory figure caption: Fig. 2: X-ray diffractogram of the metallic material with matching reference stick patterns for ilmenite, hematite and rutile
Diffraction scan: This scan helps identify crystalline minerals by comparing the measured pattern with reference patterns. The laboratory interpretation explains which minerals the comparison supports.
Laboratory figure caption: Fig. 3: X-ray diffractogram of the brown material with matching reference stick patterns
Read the report as text
Analytical Result Report
Sample id: 1565 (#6)
Submitted by: Soul Body Gems
Date completed: 2-25-2026
Operating conditions: A Bruker Titan X-ray  fluorescence spectrometer was used and operated at 10, 25 and 50 kV.
A Bruker D2-Phaser X-ray diffractometer was also used and oppeprated at 30 kV and 10 mA.
Fig. 1:  Photograph of the specimen.  6.5 cm maximum dimension
Table 1: Major and minor elemental composition of the material, in wt. %.
Fig.  2: X-ray diffractogram of the metallic material with matching reference stick patterns for ilmenite, hematite and rutile
Fig.  3: X-ray diffractogram of the brown material with matching reference stick patterns
Summary of findings:  This is a pretty specimen.  The metallic material is essentially composed of iron and titanium (Table 1).  X-ray diffraction indicates the presence of ilmenite, hematite and rutile (Fig. 2).  A little calcite is also present, likely as inclusions.  It is likely that the rutile is a breakdown product of the ilmenite.  The hematite is likely at least in part also related to breakdown of ilmenite under oxidizing conditions.  The brown material is a carbonate mineral (table 1 and Fig.  3), ankerite with a little calcite present as well (Fig. 3)
Date:    2-25-2026                      Signature
Table 1: Major and minor elemental composition, wt. %
Element
Metallic material
Brown material
Aluminum
2.7
0.7
Calcium
1.1
24.7
Iron
60.7
5.4
Magnesium
nd
13.8
Manganese
nd
0.2
Silicon
1.1
0.5
Titanium
8.9
Not provided
Archive note: the filename refers to February 24; the report itself gives February 25, 2026. Printed sample 1565 also appears on a different report, so this record is distinguished by the #6 designation, specimen photograph and mineral findings.
Scapolite specimens identified as meionite-dominant by chemical analysis and X-ray diffraction.
Sample: 1567 (#6 scapolite). Completed: March 17, 2026.
Finding: Calcium-rich scapolite with meionite dominant. The sulfur content suggests a small contribution from silvialite, another scapolite-group member.
Understanding the names
The report describes “wernerite” as an obsolete name formerly used for intermediate scapolite-group compositions. We retain it as a searchable name while presenting the meionite-dominant identification.
The report photograph includes a specimen under long-wave ultraviolet light. No locality has been supplied for this entry.
These results are the property of Soul Body Gems, Alexander Falster, and the Maine Mineral & Gem Museum. Any mention requires full acknowledgment.
Understanding the report figures
Use this guide alongside the written findings and the original report transcript. It explains the purpose of each analytical figure and preserves the laboratory’s own figure labels. The interpretations apply to the tested specimen; signals alone do not establish the identity of every similar-looking stone.
Diffraction scan: This scan helps identify crystalline minerals by comparing the measured pattern with reference patterns. The laboratory interpretation explains which minerals the comparison supports.
Laboratory figure caption: Fig. 2: X-ray diffractogram of the metallic material with matching reference stick patterns for marialite and meionite.
Diffraction scan: This scan helps identify crystalline minerals by comparing the measured pattern with reference patterns. The laboratory interpretation explains which minerals the comparison supports.
Laboratory figure caption: Fig. 3: X-ray diffractogram of the brown material with matching reference stick patterns
Read the report as text
Analytical Result Report
Sample id: 1567 (#6 scapolite)
Submitted by: Soul Body Gems
Date completed: 3-17-2026
Operating conditions: A Bruker Titan X-ray  fluorescence spectrometer was used and operated at 10, 25 and 50 kV.
A Bruker D2-Phaser X-ray diffractometer was also used and oppeprated at 30 kV and 10 mA.

Fig. 1:  Photograph of the specimen.  6.5 cm maximum dimension.  Left:larger specimen under LW ultraviolet light.
Table 1: Major and minor elemental composition of the material, in wt. %.
Fig.  2: X-ray diffractogram of the metallic material with matching reference stick patterns for marialite and meionite.
Fig.  3: X-ray diffractogram of the brown material with matching reference stick patterns
Summary of findings:  These are pretty specimens.  Chemically, it is a calcium-rich aluminum silicate with a small sulfur component.  Structurally (Fig. 2), it belongs to the scapolite group with meionite being dominant (high calcium) Table 1).  The small sulfur content indicates a small contribution of silviaite, another member of the scapolite group which contains sulfur.  The now obsolete name wernerite was used for the intermediate members of the scapolite group.
Date:    3-17-2026                      Signature
Table 1: Major and minor elemental composition, wt. %
Element
This specimen
Aluminum
17.8
Calcium
12.6
Iron
0.1
Magnesium
0.3
Potassium
0.5
Silicon
18.3
Sulfur
0.8
Transcription note: the source spells silvialite “silviaite” and includes a Figure 3 caption without a corresponding image. The original pages are reproduced above.
Scapolite specimens identified as meionite-dominant by chemical analysis and X-ray diffraction.
Sample: 1567 (#6 scapolite). Completed: March 17, 2026.
Finding: Calcium-rich scapolite with meionite dominant. The sulfur content suggests a small contribution from silvialite, another scapolite-group member.
Understanding the names
The report describes “wernerite” as an obsolete name formerly used for intermediate scapolite-group compositions. We retain it as a searchable name while presenting the meionite-dominant identification.
The report photograph includes a specimen under long-wave ultraviolet light. No locality has been supplied for this entry.
These results are the property of Soul Body Gems, Alexander Falster, and the Maine Mineral & Gem Museum. Any mention requires full acknowledgment.
Understanding the report figures
Use this guide alongside the written findings and the original report transcript. It explains the purpose of each analytical figure and preserves the laboratory’s own figure labels. The interpretations apply to the tested specimen; signals alone do not establish the identity of every similar-looking stone.
Diffraction scan: This scan helps identify crystalline minerals by comparing the measured pattern with reference patterns. The laboratory interpretation explains which minerals the comparison supports.
Laboratory figure caption: Fig. 2: X-ray diffractogram of the metallic material with matching reference stick patterns for marialite and meionite.
Diffraction scan: This scan helps identify crystalline minerals by comparing the measured pattern with reference patterns. The laboratory interpretation explains which minerals the comparison supports.
Laboratory figure caption: Fig. 3: X-ray diffractogram of the brown material with matching reference stick patterns
Read the report as text
Analytical Result Report
Sample id: 1567 (#6 scapolite)
Submitted by: Soul Body Gems
Date completed: 3-17-2026
Operating conditions: A Bruker Titan X-ray  fluorescence spectrometer was used and operated at 10, 25 and 50 kV.
A Bruker D2-Phaser X-ray diffractometer was also used and oppeprated at 30 kV and 10 mA.

Fig. 1:  Photograph of the specimen.  6.5 cm maximum dimension.  Left:larger specimen under LW ultraviolet light.
Table 1: Major and minor elemental composition of the material, in wt. %.
Fig.  2: X-ray diffractogram of the metallic material with matching reference stick patterns for marialite and meionite.
Fig.  3: X-ray diffractogram of the brown material with matching reference stick patterns
Summary of findings:  These are pretty specimens.  Chemically, it is a calcium-rich aluminum silicate with a small sulfur component.  Structurally (Fig. 2), it belongs to the scapolite group with meionite being dominant (high calcium) Table 1).  The small sulfur content indicates a small contribution of silviaite, another member of the scapolite group which contains sulfur.  The now obsolete name wernerite was used for the intermediate members of the scapolite group.
Date:    3-17-2026                      Signature
Table 1: Major and minor elemental composition, wt. %
Element
This specimen
Aluminum
17.8
Calcium
12.6
Iron
0.1
Magnesium
0.3
Potassium
0.5
Silicon
18.3
Sulfur
0.8
Transcription note: the source spells silvialite “silviaite” and includes a Figure 3 caption without a corresponding image. The original pages are reproduced above.
An epidote-group specimen from Morocco, identified by X-ray diffraction and X-ray fluorescence spectroscopy.
Sample: 1560 (#7 epidote). Completed: February 10, 2026.
Finding: Epidote-group identity confirmed. The researcher interprets the higher aluminum and correspondingly lower iron as indicating a zoisite contribution.
Locality: Morocco, according to Soul Body Gems sourcing notes. The report photograph shows a specimen measuring approximately 7 cm at its maximum dimension.
These results are the property of Soul Body Gems, Alexander Falster, and the Maine Mineral & Gem Museum. Any mention requires full acknowledgment.
Understanding the report figures
Use this guide alongside the written findings and the original report transcript. It explains the purpose of each analytical figure and preserves the laboratory’s own figure labels. The interpretations apply to the tested specimen; signals alone do not establish the identity of every similar-looking stone.
Diffraction scan: This scan helps identify crystalline minerals by comparing the measured pattern with reference patterns. The laboratory interpretation explains which minerals the comparison supports.
Laboratory figure caption: Fig. 2: X-ray diffraction scan of the specimen with matching reference stick pattern.
Read the report as text
Analytical Result Report
Sample id: 1560 (#7 epidote)
Submitted by: Soul Body Gems
Date completed: 2-10-2026
Operating conditions: A Bruker Titan X-ray  fluorescence spectrometer was used and operated at 10, 25 and 50 kV.
A Bruker D2-Phaser X-ray diffractometer was also used in the study and operated at 30 kV and 10 mA.
Fig. 1:  Photograph of the specimens. 7 cm maximum dimension.
.
Fig. 2: X-ray diffraction scan of the specimen with matching reference stick pattern.
Table 1: Chemical composition of the specimen, in wt. %
Summary of findings:  This is a nice specimen of the epidote group (Fig. 1).  The identity has been confirmed by X-ray diffraction and X-ray fluorescence spectroscopy.  The higher aluminum and correspondingly lower iron indicate that the is a zoisite contribution present.  This is common.
Date:    2-10-2026                      Signature
Garnet NOT in Wollastonite · Soul Body Gems, September 2024.
Namibian material commonly sold as “Garnet in Wollastonite,” with its actual mineral association clarified by testing.
Sample: 1097 (#7 grossular in wollastonite). Completed: October 17, 2024.
Key correction: The brown crystals are grossular garnet. No wollastonite was seen in the tested specimen.
What surrounds the garnet?
The matrix contains potassium feldspar, sodium-rich plagioclase likely to be albite, and quartz. Some areas contain allanite and hedenbergite, a pyroxene. The garnet rims are also grossular, with mainly fluorite inclusions.
The researcher interprets the specimen as a likely high-temperature metamorphic rock of calc-silicate or skarn affinity. The familiar market name is retained for search, while “Garnet not in Wollastonite” highlights the correction.
Locality: Namibia, according to Soul Body Gems sourcing notes for this material.
These results are the property of Soul Body Gems, Alexander Falster, and the Maine Mineral & Gem Museum. Any mention requires full acknowledgment.
Understanding the report figures
Use this guide alongside the written findings and the original report transcript. It explains the purpose of each analytical figure and preserves the laboratory’s own figure labels. The interpretations apply to the tested specimen; signals alone do not establish the identity of every similar-looking stone.
Electron microscope image: This view shows small-scale regions selected for analysis. Its brightness contrast helps distinguish regions with different compositions; it is not a photograph of their natural colors. Numbered spots connect this view to the analyses listed in the report.
Laboratory figure caption: Fig.2: Backscattered electron image of an area of the specimen.
Elemental spectrum: The peaks record characteristic X-ray signals from elements in the analyzed spot or area. This is an analysis of that location, not automatically of the entire specimen. Any mineral identification or uncertainty named in the laboratory caption is retained below.
Laboratory figure caption: Fig. 3: Energy dispersive spectrum of spot 1 in Fig. 2. left (grossular)
Elemental spectrum: The peaks record characteristic X-ray signals from elements in the analyzed spot or area. This is an analysis of that location, not automatically of the entire specimen. Any mineral identification or uncertainty named in the laboratory caption is retained below.
Laboratory figure caption: Fig. 4: Energy dispersive spectrum of spot 2 in Fig. 2. left (grossular)
Elemental spectrum: The peaks record characteristic X-ray signals from elements in the analyzed spot or area. This is an analysis of that location, not automatically of the entire specimen. Any mineral identification or uncertainty named in the laboratory caption is retained below.
Laboratory figure caption: Fig. 5: Energy dispersive spectrum of spot 3 in Fig. 2. left (fluorite)
Elemental spectrum: The peaks record characteristic X-ray signals from elements in the analyzed spot or area. This is an analysis of that location, not automatically of the entire specimen. Any mineral identification or uncertainty named in the laboratory caption is retained below.
Laboratory figure caption: Fig. 6: Energy dispersive spectrum of spot 4 in Fig. 2. left (potassium feldspar)
Elemental spectrum: The peaks record characteristic X-ray signals from elements in the analyzed spot or area. This is an analysis of that location, not automatically of the entire specimen. Any mineral identification or uncertainty named in the laboratory caption is retained below.
Laboratory figure caption: Fig. 7: Energy dispersive spectrum of spot 5 in Fig. 2. left (sodic plagioclase)
Elemental spectrum: The peaks record characteristic X-ray signals from elements in the analyzed spot or area. This is an analysis of that location, not automatically of the entire specimen. Any mineral identification or uncertainty named in the laboratory caption is retained below.
Laboratory figure caption: Fig. 8: Energy dispersive spectrum of spot 6 in Fig. 2. left (fluorite)
Elemental spectrum: The peaks record characteristic X-ray signals from elements in the analyzed spot or area. This is an analysis of that location, not automatically of the entire specimen. Any mineral identification or uncertainty named in the laboratory caption is retained below.
Laboratory figure caption: Fig. 9: Energy dispersive spectrum of spot 7 in Fig. 2. left (quartz)
Electron microscope image: This view shows small-scale regions selected for analysis. Its brightness contrast helps distinguish regions with different compositions; it is not a photograph of their natural colors. Numbered spots connect this view to the analyses listed in the report.
Laboratory figure caption: Fig. 10: Backscattered electron image of another area of the specimen.
Elemental spectrum: The peaks record characteristic X-ray signals from elements in the analyzed spot or area. This is an analysis of that location, not automatically of the entire specimen. Any mineral identification or uncertainty named in the laboratory caption is retained below.
Laboratory figure caption: Fig. 11: Energy dispersive spectrum of spot 1 in Fig. 10. left (allanite)
Elemental spectrum: The peaks record characteristic X-ray signals from elements in the analyzed spot or area. This is an analysis of that location, not automatically of the entire specimen. Any mineral identification or uncertainty named in the laboratory caption is retained below.
Laboratory figure caption: Fig. 12: Energy dispersive spectrum of spot 2 in Fig. 10. left (hedenbergite)
Read the report as text
Analytical Result Report
Sample id: 1097 (#7, grossular in wollastonite)
Submitted by: Soul Body Gems
Date completed: 10-17-2024
Operating conditions: An AMRAY 1830 SEM operated at 25 kV acceleration potential, 24 mm working distance, 0 degrees sample tilt, coated with 250 Å carbon, and also using the attached XRF unit operated at 30 kV.
Fig. 1:  Photograph of the specimen.  Approximately 45 mm maximum dimension.

Fig.2: Backscattered electron image of an area of the specimen.
Fig. 3: Energy dispersive spectrum of spot 1 in Fig. 2. left  (grossular)
Fig. 4: Energy dispersive spectrum of spot 2 in Fig. 2. left  (grossular)
Fig. 5: Energy dispersive spectrum of spot 3 in Fig. 2. left  (fluorite)
Fig. 6: Energy dispersive spectrum of spot 4 in Fig. 2. left  (potassium feldspar)
Fig. 7: Energy dispersive spectrum of spot 5 in Fig. 2. left  (sodic plagioclase)
Fig. 8: Energy dispersive spectrum of spot 6 in Fig. 2. left  (fluorite)
Fig. 9: Energy dispersive spectrum of spot 7 in Fig. 2. left  (quartz)
Fig. 10: Backscattered electron image of another area of the specimen.
Fig. 11: Energy dispersive spectrum of spot 1 in Fig. 10. left  (allanite)
Fig. 12: Energy dispersive spectrum of spot 2 in Fig. 10. left  (hedenbergite)
Summary of findings:  This specimen (Fig. 1) is interesting! The brown crystals are indeed grossular (Figs. 2 and 3).  The rim appears different with many inclusions but is also grossular (Figs. 2 and 4).  The inclusions in the rim of the grossular are mainly fluorite (Figs. 2 and 5).  The ground mass is composed of potassic feldspar (Figs. 2 and 6), sodic plagioclase, likely albite (Figs. 2 and 7) and quartz (Figs. 2 and 9).  Some grains in the ground mass turned out to be nests of allanite (Figs. 10 and 11)) and hedenbergite, a pyroxene (Figs. 10 and 12).  The material is likely afarily high-tempeprature metamorphic rock, something in the calc silicate or skarn kindred.  Alas, no wollastonie was seen.
Date:    10-17-2024                      Signature
Garnet NOT in Wollastonite · Soul Body Gems, September 2024.
Namibian material commonly sold as “Garnet in Wollastonite,” with its actual mineral association clarified by testing.
Sample: 1097 (#7 grossular in wollastonite). Completed: October 17, 2024.
Key correction: The brown crystals are grossular garnet. No wollastonite was seen in the tested specimen.
What surrounds the garnet?
The matrix contains potassium feldspar, sodium-rich plagioclase likely to be albite, and quartz. Some areas contain allanite and hedenbergite, a pyroxene. The garnet rims are also grossular, with mainly fluorite inclusions.
The researcher interprets the specimen as a likely high-temperature metamorphic rock of calc-silicate or skarn affinity. The familiar market name is retained for search, while “Garnet not in Wollastonite” highlights the correction.
Locality: Namibia, according to Soul Body Gems sourcing notes for this material.
These results are the property of Soul Body Gems, Alexander Falster, and the Maine Mineral & Gem Museum. Any mention requires full acknowledgment.
Understanding the report figures
Use this guide alongside the written findings and the original report transcript. It explains the purpose of each analytical figure and preserves the laboratory’s own figure labels. The interpretations apply to the tested specimen; signals alone do not establish the identity of every similar-looking stone.
Electron microscope image: This view shows small-scale regions selected for analysis. Its brightness contrast helps distinguish regions with different compositions; it is not a photograph of their natural colors. Numbered spots connect this view to the analyses listed in the report.
Laboratory figure caption: Fig.2: Backscattered electron image of an area of the specimen.
Elemental spectrum: The peaks record characteristic X-ray signals from elements in the analyzed spot or area. This is an analysis of that location, not automatically of the entire specimen. Any mineral identification or uncertainty named in the laboratory caption is retained below.
Laboratory figure caption: Fig. 3: Energy dispersive spectrum of spot 1 in Fig. 2. left (grossular)
Elemental spectrum: The peaks record characteristic X-ray signals from elements in the analyzed spot or area. This is an analysis of that location, not automatically of the entire specimen. Any mineral identification or uncertainty named in the laboratory caption is retained below.
Laboratory figure caption: Fig. 4: Energy dispersive spectrum of spot 2 in Fig. 2. left (grossular)
Elemental spectrum: The peaks record characteristic X-ray signals from elements in the analyzed spot or area. This is an analysis of that location, not automatically of the entire specimen. Any mineral identification or uncertainty named in the laboratory caption is retained below.
Laboratory figure caption: Fig. 5: Energy dispersive spectrum of spot 3 in Fig. 2. left (fluorite)
Elemental spectrum: The peaks record characteristic X-ray signals from elements in the analyzed spot or area. This is an analysis of that location, not automatically of the entire specimen. Any mineral identification or uncertainty named in the laboratory caption is retained below.
Laboratory figure caption: Fig. 6: Energy dispersive spectrum of spot 4 in Fig. 2. left (potassium feldspar)
Elemental spectrum: The peaks record characteristic X-ray signals from elements in the analyzed spot or area. This is an analysis of that location, not automatically of the entire specimen. Any mineral identification or uncertainty named in the laboratory caption is retained below.
Laboratory figure caption: Fig. 7: Energy dispersive spectrum of spot 5 in Fig. 2. left (sodic plagioclase)
Elemental spectrum: The peaks record characteristic X-ray signals from elements in the analyzed spot or area. This is an analysis of that location, not automatically of the entire specimen. Any mineral identification or uncertainty named in the laboratory caption is retained below.
Laboratory figure caption: Fig. 8: Energy dispersive spectrum of spot 6 in Fig. 2. left (fluorite)
Elemental spectrum: The peaks record characteristic X-ray signals from elements in the analyzed spot or area. This is an analysis of that location, not automatically of the entire specimen. Any mineral identification or uncertainty named in the laboratory caption is retained below.
Laboratory figure caption: Fig. 9: Energy dispersive spectrum of spot 7 in Fig. 2. left (quartz)
Electron microscope image: This view shows small-scale regions selected for analysis. Its brightness contrast helps distinguish regions with different compositions; it is not a photograph of their natural colors. Numbered spots connect this view to the analyses listed in the report.
Laboratory figure caption: Fig. 10: Backscattered electron image of another area of the specimen.
Elemental spectrum: The peaks record characteristic X-ray signals from elements in the analyzed spot or area. This is an analysis of that location, not automatically of the entire specimen. Any mineral identification or uncertainty named in the laboratory caption is retained below.
Laboratory figure caption: Fig. 11: Energy dispersive spectrum of spot 1 in Fig. 10. left (allanite)
Elemental spectrum: The peaks record characteristic X-ray signals from elements in the analyzed spot or area. This is an analysis of that location, not automatically of the entire specimen. Any mineral identification or uncertainty named in the laboratory caption is retained below.
Laboratory figure caption: Fig. 12: Energy dispersive spectrum of spot 2 in Fig. 10. left (hedenbergite)
Read the report as text
Analytical Result Report
Sample id: 1097 (#7, grossular in wollastonite)
Submitted by: Soul Body Gems
Date completed: 10-17-2024
Operating conditions: An AMRAY 1830 SEM operated at 25 kV acceleration potential, 24 mm working distance, 0 degrees sample tilt, coated with 250 Å carbon, and also using the attached XRF unit operated at 30 kV.
Fig. 1:  Photograph of the specimen.  Approximately 45 mm maximum dimension.

Fig.2: Backscattered electron image of an area of the specimen.
Fig. 3: Energy dispersive spectrum of spot 1 in Fig. 2. left  (grossular)
Fig. 4: Energy dispersive spectrum of spot 2 in Fig. 2. left  (grossular)
Fig. 5: Energy dispersive spectrum of spot 3 in Fig. 2. left  (fluorite)
Fig. 6: Energy dispersive spectrum of spot 4 in Fig. 2. left  (potassium feldspar)
Fig. 7: Energy dispersive spectrum of spot 5 in Fig. 2. left  (sodic plagioclase)
Fig. 8: Energy dispersive spectrum of spot 6 in Fig. 2. left  (fluorite)
Fig. 9: Energy dispersive spectrum of spot 7 in Fig. 2. left  (quartz)
Fig. 10: Backscattered electron image of another area of the specimen.
Fig. 11: Energy dispersive spectrum of spot 1 in Fig. 10. left  (allanite)
Fig. 12: Energy dispersive spectrum of spot 2 in Fig. 10. left  (hedenbergite)
Summary of findings:  This specimen (Fig. 1) is interesting! The brown crystals are indeed grossular (Figs. 2 and 3).  The rim appears different with many inclusions but is also grossular (Figs. 2 and 4).  The inclusions in the rim of the grossular are mainly fluorite (Figs. 2 and 5).  The ground mass is composed of potassic feldspar (Figs. 2 and 6), sodic plagioclase, likely albite (Figs. 2 and 7) and quartz (Figs. 2 and 9).  Some grains in the ground mass turned out to be nests of allanite (Figs. 10 and 11)) and hedenbergite, a pyroxene (Figs. 10 and 12).  The material is likely afarily high-tempeprature metamorphic rock, something in the calc silicate or skarn kindred.  Alas, no wollastonie was seen.
Date:    10-17-2024                      Signature
Banded agate whose color and clarity change when wetted, examined in two differently appearing bracelet beads.
Sample: 10671 (#8 bracelet). Completed: August 30, 2024.
Finding: Both beads are quartz. X-ray diffraction confirms crystalline quartz; the material is banded chalcedony, an agate, rather than opal in its present state.
Why water changes its appearance
The researcher attributes the wetting-related color and clarity changes to porosity. The banding suggests a possible original gel or opal phase that later recrystallized; that proposed history is an interpretation, while its present quartz identity is confirmed.
“Color-Changing” here refers to a change when wetted, rather than a lighting-dependent gemstone color-change effect. The report found no strong UV response from the beads, although the elastic string’s strong orange fluorescence could mask weaker bead fluorescence.
Locality: Indonesia, according to Soul Body Gems sourcing notes.
These results are the property of Soul Body Gems, Alexander Falster, and the Maine Mineral & Gem Museum. Any mention requires full acknowledgment.
Understanding the report figures
Use this guide alongside the written findings and the original report transcript. It explains the purpose of each analytical figure and preserves the laboratory’s own figure labels. The interpretations apply to the tested specimen; signals alone do not establish the identity of every similar-looking stone.
Electron microscope image: This view shows small-scale regions selected for analysis. Its brightness contrast helps distinguish regions with different compositions; it is not a photograph of their natural colors. Numbered spots connect this view to the analyses listed in the report.
Laboratory figure caption: Fig.2: Backscattered electron image of an area of the specimen.
Elemental spectrum: The peaks record characteristic X-ray signals from elements in the analyzed spot or area. This is an analysis of that location, not automatically of the entire specimen. Any mineral identification or uncertainty named in the laboratory caption is retained below.
Laboratory figure caption: Fig. 3: Energy dispersive spectrum of spot 1 in Fig. 2 (quartz).
Electron microscope image: This view shows small-scale regions selected for analysis. Its brightness contrast helps distinguish regions with different compositions; it is not a photograph of their natural colors. Numbered spots connect this view to the analyses listed in the report.
Laboratory figure caption: Fig.4: Backscattered electron image of an area of the specimen.
Elemental spectrum: The peaks record characteristic X-ray signals from elements in the analyzed spot or area. This is an analysis of that location, not automatically of the entire specimen. Any mineral identification or uncertainty named in the laboratory caption is retained below.
Laboratory figure caption: Fig. 4: Energy dispersive spectrum of spot 1 in Fig. 3 (quartz).
Diffraction scan: This scan helps identify crystalline minerals by comparing the measured pattern with reference patterns. The laboratory interpretation explains which minerals the comparison supports.
Laboratory figure caption: Fig. 5: X-ray diffraction scan of the material with red stick pattern overlay showing match for quartz.
Read the report as text
Analytical Result Report
Sample id: 10671 (#8 bracelet)
Submitted by: Soul Body Gems
Date completed: 8-30-2024
Operating conditions: An AMRAY 1830 SEM operated at 25 kV acceleration potential, 24 mm working distance, 0 degrees sample tilt, coated with 250 Å carbon, and also using the attached XRF unit operated at 30 kV.
A Bruker D2-Phaser X-ray diffractometer was also used in the study and operated at 30 kV and 10 mA.
Fig. 1:  Photograph of the specimen.  The beads are about 1 cm in maximum dimension.
Fig.2: Backscattered electron image of an area of the specimen.
Fig. 3: Energy dispersive spectrum of spot 1 in Fig. 2 (quartz).
Fig.4: Backscattered electron image of an area of the specimen.
Fig. 4: Energy dispersive spectrum of spot 1 in Fig. 3 (quartz).
Fig. 5: X-ray diffraction scan of the material with red stick pattern overlay showing match for quartz.
Summary of findings:  This specimen (Fig. 1) is made from pretty beads that are composed of quartz.  Two differently looking beads were analyzed (Figs. 2-4) were analyzed and they both are quartz.  It is essentially a banded chalcedony, an agate.  UV-checking did not reveal any strong response, the elastic string though showed very strong orange UV response which would have overpowered weaker response from the beads.
Additionally, an X-ray diffraction was run of the material (Fig. 5).  It is a match for quartz and crystallinity is confirmed, thus, it is not an opal, at least not anymore.  The interesting behavior with water made me suspicious that it might be but this confirms that at least now it is crystalline.  The banded nature suggests an origin that was likely a gel at first, an opal, that then recrystallized.  It evidently is still porous; thus the color change and clarity change when wetted.
Date:    August 30, 2024                      Signature
Indonesian Water Agate · Soul Body Gems, September 2024.
Banded agate whose color and clarity change when wetted, examined in two differently appearing bracelet beads.
Sample: 10671 (#8 bracelet). Completed: August 30, 2024.
Finding: Both beads are quartz. X-ray diffraction confirms crystalline quartz; the material is banded chalcedony, an agate, rather than opal in its present state.
Why water changes its appearance
The researcher attributes the wetting-related color and clarity changes to porosity. The banding suggests a possible original gel or opal phase that later recrystallized; that proposed history is an interpretation, while its present quartz identity is confirmed.
“Color-Changing” here refers to a change when wetted, rather than a lighting-dependent gemstone color-change effect. The report found no strong UV response from the beads, although the elastic string’s strong orange fluorescence could mask weaker bead fluorescence.
Locality: Indonesia, according to Soul Body Gems sourcing notes.
These results are the property of Soul Body Gems, Alexander Falster, and the Maine Mineral & Gem Museum. Any mention requires full acknowledgment.
Understanding the report figures
Use this guide alongside the written findings and the original report transcript. It explains the purpose of each analytical figure and preserves the laboratory’s own figure labels. The interpretations apply to the tested specimen; signals alone do not establish the identity of every similar-looking stone.
Electron microscope image: This view shows small-scale regions selected for analysis. Its brightness contrast helps distinguish regions with different compositions; it is not a photograph of their natural colors. Numbered spots connect this view to the analyses listed in the report.
Laboratory figure caption: Fig.2: Backscattered electron image of an area of the specimen.
Elemental spectrum: The peaks record characteristic X-ray signals from elements in the analyzed spot or area. This is an analysis of that location, not automatically of the entire specimen. Any mineral identification or uncertainty named in the laboratory caption is retained below.
Laboratory figure caption: Fig. 3: Energy dispersive spectrum of spot 1 in Fig. 2 (quartz).
Electron microscope image: This view shows small-scale regions selected for analysis. Its brightness contrast helps distinguish regions with different compositions; it is not a photograph of their natural colors. Numbered spots connect this view to the analyses listed in the report.
Laboratory figure caption: Fig.4: Backscattered electron image of an area of the specimen.
Elemental spectrum: The peaks record characteristic X-ray signals from elements in the analyzed spot or area. This is an analysis of that location, not automatically of the entire specimen. Any mineral identification or uncertainty named in the laboratory caption is retained below.
Laboratory figure caption: Fig. 4: Energy dispersive spectrum of spot 1 in Fig. 3 (quartz).
Diffraction scan: This scan helps identify crystalline minerals by comparing the measured pattern with reference patterns. The laboratory interpretation explains which minerals the comparison supports.
Laboratory figure caption: Fig. 5: X-ray diffraction scan of the material with red stick pattern overlay showing match for quartz.
Read the report as text
Analytical Result Report
Sample id: 10671 (#8 bracelet)
Submitted by: Soul Body Gems
Date completed: 8-30-2024
Operating conditions: An AMRAY 1830 SEM operated at 25 kV acceleration potential, 24 mm working distance, 0 degrees sample tilt, coated with 250 Å carbon, and also using the attached XRF unit operated at 30 kV.
A Bruker D2-Phaser X-ray diffractometer was also used in the study and operated at 30 kV and 10 mA.
Fig. 1:  Photograph of the specimen.  The beads are about 1 cm in maximum dimension.
Fig.2: Backscattered electron image of an area of the specimen.
Fig. 3: Energy dispersive spectrum of spot 1 in Fig. 2 (quartz).
Fig.4: Backscattered electron image of an area of the specimen.
Fig. 4: Energy dispersive spectrum of spot 1 in Fig. 3 (quartz).
Fig. 5: X-ray diffraction scan of the material with red stick pattern overlay showing match for quartz.
Summary of findings:  This specimen (Fig. 1) is made from pretty beads that are composed of quartz.  Two differently looking beads were analyzed (Figs. 2-4) were analyzed and they both are quartz.  It is essentially a banded chalcedony, an agate.  UV-checking did not reveal any strong response, the elastic string though showed very strong orange UV response which would have overpowered weaker response from the beads.
Additionally, an X-ray diffraction was run of the material (Fig. 5).  It is a match for quartz and crystallinity is confirmed, thus, it is not an opal, at least not anymore.  The interesting behavior with water made me suspicious that it might be but this confirms that at least now it is crystalline.  The banded nature suggests an origin that was likely a gel at first, an opal, that then recrystallized.  It evidently is still porous; thus the color change and clarity change when wetted.
Date:    August 30, 2024                      Signature
A clean faceted citrine examined for its composition, crystal structure and internal features.
Sample: 1581 (#8 citrine). Completed: July 1, 2026.
Finding: Quartz colored by small amounts of trivalent iron. Polarized-light examination shows that the stone is monocrystalline.
What clarity can—and cannot—tell us
The researcher scanned the stone extensively and found no notable fluid inclusions. The report explicitly states that inclusions can occur in both natural and man-made stones, and their absence does not establish either origin. It suggests the stone may simply have been cut from exceptionally clean rough, without concluding that this proves natural origin.
No locality or definitive natural-versus-synthetic determination is provided in this report. It also does not give a heat-treatment conclusion.
These results are the property of Soul Body Gems, Alexander Falster, and the Maine Mineral & Gem Museum. Any mention requires full acknowledgment.
Read the report as text
Analytical Result Report
Sample id: 1581 (#8 citrine)
Submitted by: Soul Body Gems
Date completed: 7-1-2026
Operating conditions: A Bruker Titan X-ray  fluorescence spectrometer was used and operated at 10, 25 and 50 kV.

Fig. 1:  Photograph of the specimen.  1.6 cm maximum dimension.
Fig. 2: The stone under polarized light, at extinction and 45 degrees rotated from extinction.
Table 1: Major and minor elemental composition of the material, in wt. %.
Summary of findings:  This is a very clean stone.  Chemically it is quartz (Table 1), the color is due to small amounts of trivalent iron.  The stone is monocrystalline as shown in Fig. 2.  The interior oof the stone is very clean, scanned it extensively and did not find any notable fluid inclusions.  Inclusions are seen in both natural and man-made stones,  and the lack of them does not make a case for either origin.  It may just be by chance a stone that was cut from a very clean piece of rough.
Date:    7-1-2026                      Signature
Table 1: Major and minor elemental composition, wt. %
Element
This specimen
Aluminum
0.2
Calcium
0.01
Iron
0.06
Silicon
46.3
A bracelet identified as sodalite-group material, described in the report as essentially hackmanite.
Soul Body Gems · February 2025 Hackmanite collection
Sample: 10679 (#9 bracelet). Completed: August 30, 2024.
Finding: Sodalite-group beads, essentially hackmanite, containing some very iron-poor phlogopite inclusions.
The researcher notes that sodalite-group species form in silica-undersaturated rock types, such as nepheline syenite. The report does not supply a locality or document a tenebrescence test.
This is a separate specimen from the material listed elsewhere as “Hackmanite (Not).” The results here describe this bracelet.
Our collection: Soul Body Gems confirms that the Hackmanite pendant collection uses the same material as the bracelet tested in the report below.
Hackmanite and the sodalite family
Hackmanite is a variety of sodalite associated with reversible changes in body colour. Sodalite is a sodium aluminium silicate with a cage-like framework, and it typically occurs in silica-undersaturated rocks such as nepheline syenite and phonolite. A material can contain sodalite without showing the particular optical behaviour that makes hackmanite so engaging. This is why mineral identity, the properties observed in a specimen and the name used in commerce all deserve attention.
Tenebrescence: colour that remembers light
Tenebrescence is a reversible change in the colour of a material after exposure to suitable radiation. A pale piece of hackmanite can become pink or purple under ultraviolet light, then gradually return toward its earlier appearance under other lighting conditions. The effect is not simply the colour of light shining on the stone. Researchers at the University of Turku explain how movement of atoms within the mineral's cage structure can accompany these repeatable changes while the overall framework remains intact. The material's internal structure changes how it absorbs visible light.
Colour change and fluorescence
Two observations should be recorded separately: whether a stone emits a visible glow while the UV lamp is on, and whether its body colour has changed when viewed afterward in ordinary light. The first is fluorescence; the second can be tenebrescence. A photograph taken only under UV light cannot document both effects at once. For an informative comparison, photograph the piece in ordinary light before exposure, during UV illumination, and again in ordinary light afterward. Keep camera exposure and white balance consistent where possible, because automatic settings can exaggerate differences.
Why scientists are interested
Hackmanite-inspired materials are being investigated for radiation sensing. The University of Turku's Intelligent Materials Chemistry group studies materials whose colour response can relate to ultraviolet or X-ray exposure. These applications require calibrated materials and controlled measurements; a jewellery stone should not be treated as a ready-made radiation meter. The research is nevertheless a fascinating link between mineral collecting and materials science. A property that first catches the eye as an unusual colour effect can also inspire useful ways of recording light exposure.
Our laboratory evidence
The report retained below identifies the beads of sample 10679 as sodalite-group material, essentially hackmanite, with very iron-poor phlogopite inclusions. It does not record a tenebrescence experiment or supply a locality. That makes the report valuable for composition while leaving the optical behaviour to be documented separately. Another specimen in our library, offered under the hackmanite name, was identified as a sodalite-bearing syenite. The two reports are separate pieces of evidence, not interchangeable descriptions of every item sold under the name.
Care and observation
Sodalite has a Mohs hardness of approximately 5½–6 and is brittle. Protect finished pieces from abrasion by harder gems and from impacts. Use gentle cleaning and avoid chemical dips, abrasives, steam and ultrasonic equipment where mixed minerals or fractures may be present. When exploring the light response, follow the UV lamp manufacturer's instructions and protect eyes from the beam. Record the lamp wavelength, exposure time and lighting used for each photograph. Those details make a colour comparison more useful than a dramatic image alone, and they help preserve the individual story of the specimen.
These results are the property of Soul Body Gems, Alexander Falster, and the Maine Mineral & Gem Museum. Any mention requires full acknowledgment.
Understanding the report figures
Use this guide alongside the written findings and the original report transcript. It explains the purpose of each analytical figure and preserves the laboratory’s own figure labels. The interpretations apply to the tested specimen; signals alone do not establish the identity of every similar-looking stone.
Electron microscope image: This view shows small-scale regions selected for analysis. Its brightness contrast helps distinguish regions with different compositions; it is not a photograph of their natural colors. Numbered spots connect this view to the analyses listed in the report.
Laboratory figure caption: Fig.2: Backscattered electron image of an area of the specimen.
Elemental spectrum: The peaks record characteristic X-ray signals from elements in the analyzed spot or area. This is an analysis of that location, not automatically of the entire specimen. Any mineral identification or uncertainty named in the laboratory caption is retained below.
Laboratory figure caption: Fig. 3: Energy dispersive spectrum of spot 1 in Fig. 2 (sodalite group).
Elemental spectrum: The peaks record characteristic X-ray signals from elements in the analyzed spot or area. This is an analysis of that location, not automatically of the entire specimen. Any mineral identification or uncertainty named in the laboratory caption is retained below.
Laboratory figure caption: Fig. 4: Energy dispersive spectrum of spot 1 in Fig. 3 (phlogopite).
Element map: This map shows where the named elements occur within the analyzed area. Its colors represent the laboratory’s selected element channels, rather than the specimen’s visible colors. The caption below preserves any color key or distribution noted by the laboratory.
Laboratory figure caption: Fig. 5: X-ray map of the area shown in Fig. 2. Sodium: yellow, potassium: purple.
Read the report as text
Analytical Result Report
Sample id: 10679 (#9 bracelet)
Submitted by: Soul Body Gems
Date completed: 8-30-2024
Operating conditions: An AMRAY 1830 SEM operated at 25 kV acceleration potential, 24 mm working distance, 0 degrees sample tilt, coated with 250 Å carbon, and also using the attached XRF unit operated at 30 kV.
Fig. 1:  Photograph of the specimen.  The beads are about 0.6 cm in maximum dimension.
Fig.2: Backscattered electron image of an area of the specimen.
Fig. 3: Energy dispersive spectrum of spot 1 in Fig. 2 (sodalite group).
Fig. 4: Energy dispersive spectrum of spot 1 in Fig. 3 (phlogopite).
Fig. 5: X-ray map of the area shown in Fig. 2.  Sodium: yellow, potassium: purple.
Summary of findings:  This specimen (Fig. 1) is not a common material.  The beads are made from a sodalite group mineral, essentially what is called hackmanite (Figs. 2,3 and 5).  Some inclusions of very iron-poor phlogopite are also present (Figs. 2, 4 and 5). Sodalite group species only occur in silica undersaturated rock types such as nepheline syenite.
Date:    August 30, 2024                      Signature
Zambian Emerald Facets · May 2025 · collection photograph, not the tested specimens
About the photograph and test: Soul Body Gems deliberately submitted lower-grade faceted material to investigate what produces the shimmer sometimes seen in emeralds. The higher-grade Zambian emerald facets photographed here are different collection pieces, not the specimens in this report. The report’s mica and resin-treatment findings apply to the submitted stones and must not be assigned to the photographed facets.
Green beryl sold under the Emerald Shimmer trade names, with mica inclusions and resin treatment identified in the tested specimen.
Sample: Printed ID 1529 (#9 oval cut stones). Completed: October 14, 2025.
Finding: Beryl treated with a resin, containing green mica inclusions in the phlogopite–biotite series.
Color, inclusions and treatment
The report records 1.3 wt. % iron, 2 wt. % magnesium and 400 ppm chromium in the beryl. The researcher attributes the green color primarily to iron, possibly with a small chromium contribution. The resin treatment is a material disclosure and should accompany descriptions of this tested stone.
“Emerald Shimmer” is retained as the supplied trade name; this report calls the stone beryl and does not give a separate gemological emerald classification or determine the extent of resin treatment.
Locality: Zambia, according to Soul Body Gems sourcing notes.
These results are the property of Soul Body Gems, Alexander Falster, and the Maine Mineral & Gem Museum. Any mention requires full acknowledgment.
Page 4 is a blank trailing page retained from the supplied document.
Understanding the report figures
Use this guide alongside the written findings and the original report transcript. It explains the purpose of each analytical figure and preserves the laboratory’s own figure labels. The interpretations apply to the tested specimen; signals alone do not establish the identity of every similar-looking stone.
Electron microscope image: This view shows small-scale regions selected for analysis. Its brightness contrast helps distinguish regions with different compositions; it is not a photograph of their natural colors. Numbered spots connect this view to the analyses listed in the report.
Laboratory figure caption: Fig.2: Backscattered electron images of an area of the specimen in Fig. 1.
Elemental spectrum: The peaks record characteristic X-ray signals from elements in the analyzed spot or area. This is an analysis of that location, not automatically of the entire specimen. Any mineral identification or uncertainty named in the laboratory caption is retained below.
Laboratory figure caption: Fig. 3: Energy dispersive spectrum of spot 1 in Fig. 2. (beryl with some resin)
Electron microscope image: This view shows small-scale regions selected for analysis. Its brightness contrast helps distinguish regions with different compositions; it is not a photograph of their natural colors. Numbered spots connect this view to the analyses listed in the report.
Laboratory figure caption: Fig.4: Backscattered electron images of another area of the specimen in Fig. 1.
Elemental spectrum: The peaks record characteristic X-ray signals from elements in the analyzed spot or area. This is an analysis of that location, not automatically of the entire specimen. Any mineral identification or uncertainty named in the laboratory caption is retained below.
Laboratory figure caption: Fig. 5: Energy dispersive spectrum of spot 1 in Fig. 4. (phlogopite-biotite series)
Read the report as text
Analytical Result Report
Sample id: 1529 (#9 oval cut stones)
Submitted by: Soul Body Gems
Date completed: 10-14-2025
Operating conditions: An AMRAY 1830 SEM operated at 25 kV acceleration potential, 24 mm working distance, 0 degrees sample tilt, coated with 250 Å carbon, and also using the attached XRF unit operated at 30 kV.
Fig. 1:  Photograph of the specimens. 1.4 cm maximum dimension.

Fig.2: Backscattered electron images of an area of the specimen in Fig. 1.
Fig. 3: Energy dispersive spectrum of spot 1 in Fig. 2. (beryl with some resin)
Fig.4: Backscattered electron images of another area of the specimen in Fig. 1.
Fig. 5: Energy dispersive spectrum of spot 1 in Fig. 4. (phlogopite-biotite series)

Summary of findings:  This is an interesting stone (Fig.1).  It is a beryl but has been treated with some sort of resin note the big carbon peak in Fig. 3.  There are some green mica inclusions which fit well into the phlogopite-biotite series (Figs. 4 and 5).  The beryl contains 1.3 wt. % iron, 2 wt. % magnesium but only 400 ppm chromium. The green color stems primarily from the iron, maybe aided a little by the chromium.
Date:    10-14-2025                      Signature
Archive note: printed sample 1529 also appears on a different report. This record is distinguished by its #9 oval-stone designation, date, photograph and findings.
Zambian Emerald · August 2025. Additional collection photograph. The deliberately lower-grade oval stones tested for the shimmer are different; report findings are limited to those submitted stones.
Zambian Emerald Facets · May 2025 · collection photograph, not the tested specimens
About the photograph and test: Soul Body Gems deliberately submitted lower-grade faceted material to investigate what produces the shimmer sometimes seen in emeralds. The higher-grade Zambian emerald facets photographed here are different collection pieces, not the specimens in this report. The report’s mica and resin-treatment findings apply to the submitted stones and must not be assigned to the photographed facets.
Green beryl sold under the Emerald Shimmer trade names, with mica inclusions and resin treatment identified in the tested specimen.
Sample: Printed ID 1529 (#9 oval cut stones). Completed: October 14, 2025.
Finding: Beryl treated with a resin, containing green mica inclusions in the phlogopite–biotite series.
Color, inclusions and treatment
The report records 1.3 wt. % iron, 2 wt. % magnesium and 400 ppm chromium in the beryl. The researcher attributes the green color primarily to iron, possibly with a small chromium contribution. The resin treatment is a material disclosure and should accompany descriptions of this tested stone.
“Emerald Shimmer” is retained as the supplied trade name; this report calls the stone beryl and does not give a separate gemological emerald classification or determine the extent of resin treatment.
Locality: Zambia, according to Soul Body Gems sourcing notes.
These results are the property of Soul Body Gems, Alexander Falster, and the Maine Mineral & Gem Museum. Any mention requires full acknowledgment.
Page 4 is a blank trailing page retained from the supplied document.
Understanding the report figures
Use this guide alongside the written findings and the original report transcript. It explains the purpose of each analytical figure and preserves the laboratory’s own figure labels. The interpretations apply to the tested specimen; signals alone do not establish the identity of every similar-looking stone.
Electron microscope image: This view shows small-scale regions selected for analysis. Its brightness contrast helps distinguish regions with different compositions; it is not a photograph of their natural colors. Numbered spots connect this view to the analyses listed in the report.
Laboratory figure caption: Fig.2: Backscattered electron images of an area of the specimen in Fig. 1.
Elemental spectrum: The peaks record characteristic X-ray signals from elements in the analyzed spot or area. This is an analysis of that location, not automatically of the entire specimen. Any mineral identification or uncertainty named in the laboratory caption is retained below.
Laboratory figure caption: Fig. 3: Energy dispersive spectrum of spot 1 in Fig. 2. (beryl with some resin)
Electron microscope image: This view shows small-scale regions selected for analysis. Its brightness contrast helps distinguish regions with different compositions; it is not a photograph of their natural colors. Numbered spots connect this view to the analyses listed in the report.
Laboratory figure caption: Fig.4: Backscattered electron images of another area of the specimen in Fig. 1.
Elemental spectrum: The peaks record characteristic X-ray signals from elements in the analyzed spot or area. This is an analysis of that location, not automatically of the entire specimen. Any mineral identification or uncertainty named in the laboratory caption is retained below.
Laboratory figure caption: Fig. 5: Energy dispersive spectrum of spot 1 in Fig. 4. (phlogopite-biotite series)
Read the report as text
Analytical Result Report
Sample id: 1529 (#9 oval cut stones)
Submitted by: Soul Body Gems
Date completed: 10-14-2025
Operating conditions: An AMRAY 1830 SEM operated at 25 kV acceleration potential, 24 mm working distance, 0 degrees sample tilt, coated with 250 Å carbon, and also using the attached XRF unit operated at 30 kV.
Fig. 1:  Photograph of the specimens. 1.4 cm maximum dimension.

Fig.2: Backscattered electron images of an area of the specimen in Fig. 1.
Fig. 3: Energy dispersive spectrum of spot 1 in Fig. 2. (beryl with some resin)
Fig.4: Backscattered electron images of another area of the specimen in Fig. 1.
Fig. 5: Energy dispersive spectrum of spot 1 in Fig. 4. (phlogopite-biotite series)

Summary of findings:  This is an interesting stone (Fig.1).  It is a beryl but has been treated with some sort of resin note the big carbon peak in Fig. 3.  There are some green mica inclusions which fit well into the phlogopite-biotite series (Figs. 4 and 5).  The beryl contains 1.3 wt. % iron, 2 wt. % magnesium but only 400 ppm chromium. The green color stems primarily from the iron, maybe aided a little by the chromium.
Date:    10-14-2025                      Signature
Archive note: printed sample 1529 also appears on a different report. This record is distinguished by its #9 oval-stone designation, date, photograph and findings.
Zambian Emerald · August 2025. Additional collection photograph. The deliberately lower-grade oval stones tested for the shimmer are different; report findings are limited to those submitted stones.
Russian Tiffany is a trade name for this Russian material, identified as a combination of fluorite and bertrandite.
Sample: 1577 (#9 Russian Tiffany stone). Completed: June 18, 2026.
Finding: Two main minerals: fluorite and bertrandite. Phenakite was not found.
The report notes that bertrandite is associated with lower formation temperatures and suggests that phenakite could have formed under slightly hotter conditions. That is a formation interpretation, not evidence that phenakite occurs in this specimen.
Locality: Russia, according to Soul Body Gems sourcing notes.
These results are the property of Soul Body Gems, Alexander Falster, and the Maine Mineral & Gem Museum. Any mention requires full acknowledgment.
Understanding the report figures
Use this guide alongside the written findings and the original report transcript. It explains the purpose of each analytical figure and preserves the laboratory’s own figure labels. The interpretations apply to the tested specimen; signals alone do not establish the identity of every similar-looking stone.
Diffraction scan: This scan helps identify crystalline minerals by comparing the measured pattern with reference patterns. The laboratory interpretation explains which minerals the comparison supports.
Laboratory figure caption: Fig. 2: X-ray diffractogram of the material with reference stick patterns for fluorite and bertrandite superimposed.
Read the report as text
Analytical Result Report
Sample id: 1577 (#9 Russian Tiffany stone)
Submitted by: Soul Body Gems
Date completed: 6-18-2026
Operating conditions: A Bruker Titan X-ray  fluorescence spectrometer was used and operated at 10, 25 and 50 kV.
A Bruker D2-Phaser X-ray diffractometer was also used and operated at 30 kV and 10 mA.


Fig. 1:  Photograph of the specimen.  2.5 cm maximum dimension.
Table 1: Major and minor elemental composition of the material, in wt. %.
Fig. 2: X-ray diffractogram of the material with reference stick patterns for fluorite and bertrandite superimposed.
Summary of findings:  This is an interesting specimen (Fig. 1).  Two main minerals make it up: fluorite and bertrandite (Fig. 2 and Table 1).  Phenakite was not found but under slightly higher temperature conditions, it could have formed.  Bertrandite is typical for lower temperatures of formation..
Date:    6-18-2026                      Signature
Table 1: Major and minor elemental composition, wt. %
Element
This specimen
Aluminum
2.5
Calcium
35.7
Iron
0.1
Manganese
0.05
Potassium
1.4
Silicon
12.9
Russian Tiffany is a trade name for this Russian material, identified as a combination of fluorite and bertrandite.
Sample: 1577 (#9 Russian Tiffany stone). Completed: June 18, 2026.
Finding: Two main minerals: fluorite and bertrandite. Phenakite was not found.
The report notes that bertrandite is associated with lower formation temperatures and suggests that phenakite could have formed under slightly hotter conditions. That is a formation interpretation, not evidence that phenakite occurs in this specimen.
Locality: Russia, according to Soul Body Gems sourcing notes.
These results are the property of Soul Body Gems, Alexander Falster, and the Maine Mineral & Gem Museum. Any mention requires full acknowledgment.
Understanding the report figures
Use this guide alongside the written findings and the original report transcript. It explains the purpose of each analytical figure and preserves the laboratory’s own figure labels. The interpretations apply to the tested specimen; signals alone do not establish the identity of every similar-looking stone.
Diffraction scan: This scan helps identify crystalline minerals by comparing the measured pattern with reference patterns. The laboratory interpretation explains which minerals the comparison supports.
Laboratory figure caption: Fig. 2: X-ray diffractogram of the material with reference stick patterns for fluorite and bertrandite superimposed.
Read the report as text
Analytical Result Report
Sample id: 1577 (#9 Russian Tiffany stone)
Submitted by: Soul Body Gems
Date completed: 6-18-2026
Operating conditions: A Bruker Titan X-ray  fluorescence spectrometer was used and operated at 10, 25 and 50 kV.
A Bruker D2-Phaser X-ray diffractometer was also used and operated at 30 kV and 10 mA.


Fig. 1:  Photograph of the specimen.  2.5 cm maximum dimension.
Table 1: Major and minor elemental composition of the material, in wt. %.
Fig. 2: X-ray diffractogram of the material with reference stick patterns for fluorite and bertrandite superimposed.
Summary of findings:  This is an interesting specimen (Fig. 1).  Two main minerals make it up: fluorite and bertrandite (Fig. 2 and Table 1).  Phenakite was not found but under slightly higher temperature conditions, it could have formed.  Bertrandite is typical for lower temperatures of formation..
Date:    6-18-2026                      Signature
Table 1: Major and minor elemental composition, wt. %
Element
This specimen
Aluminum
2.5
Calcium
35.7
Iron
0.1
Manganese
0.05
Potassium
1.4
Silicon
12.9
A Chinese specimen supplied as aquamarine, tested to identify both its mineral component and the material covering its surface.
Sample: 1078 (#14 Chinese beryl). Completed: September 26, 2024.
Finding: Beryl confirmed by X-ray diffraction, with resin or epoxy present on the specimen.
Beryl with a treatment disclosure
Electron images show surfaces obscured by another material. Analyses from both the bluish projecting part and the paler portion indicate beryl together with resin or epoxy; a separate analysis records the resin itself.
The presence of beryl does not mean the whole specimen is untreated. The coating or added resin must be disclosed when discussing this tested piece. The report does not determine the exact resin type or extent, and it does not give a heat-treatment conclusion.
Locality: China, according to Soul Body Gems sourcing information.
These results are the property of Soul Body Gems, Alexander Falster, and the Maine Mineral & Gem Museum. Any mention requires full acknowledgment.
Understanding the report figures
Use this guide alongside the written findings and the original report transcript. It explains the purpose of each analytical figure and preserves the laboratory’s own figure labels. The interpretations apply to the tested specimen; signals alone do not establish the identity of every similar-looking stone.
Electron microscope image: This view shows small-scale regions selected for analysis. Its brightness contrast helps distinguish regions with different compositions; it is not a photograph of their natural colors. Numbered spots connect this view to the analyses listed in the report.
Laboratory figure caption: Fig.2: Backscattered electron image of an area of the specimen. (bluish part sticking up)
Elemental spectrum: The peaks record characteristic X-ray signals from elements in the analyzed spot or area. This is an analysis of that location, not automatically of the entire specimen. Any mineral identification or uncertainty named in the laboratory caption is retained below.
Laboratory figure caption: Fig. 3: Energy dispersive spectrum of spot 1 in Fig. 2. (likely beryl with a resin coating, note tall carbon peak!)
Elemental spectrum: The peaks record characteristic X-ray signals from elements in the analyzed spot or area. This is an analysis of that location, not automatically of the entire specimen. Any mineral identification or uncertainty named in the laboratory caption is retained below.
Laboratory figure caption: Fig. 4: Energy dispersive spectrum of spot 2 in Fig. 2 (resin/epoxy)
Electron microscope image: This view shows small-scale regions selected for analysis. Its brightness contrast helps distinguish regions with different compositions; it is not a photograph of their natural colors. Numbered spots connect this view to the analyses listed in the report.
Laboratory figure caption: Fig.5: Backscattered electron image of another area of the specimen. (paler colored portion)
Elemental spectrum: The peaks record characteristic X-ray signals from elements in the analyzed spot or area. This is an analysis of that location, not automatically of the entire specimen. Any mineral identification or uncertainty named in the laboratory caption is retained below.
Laboratory figure caption: Fig. 6: Energy dispersive spectrum of spot 1 in Fig. 5. (beryl plus resin/epoxy)
Diffraction scan: This scan helps identify crystalline minerals by comparing the measured pattern with reference patterns. The laboratory interpretation explains which minerals the comparison supports.
Laboratory figure caption: Fig. 7: X-ray diffraction scan of the material. Match for beryl.
Read the report as text
Analytical Result Report
Sample id: 1078 (#14, Chinese beryl)
Submitted by: Soul Body Gems
Date completed: 9-26-2024
Operating conditions: An AMRAY 1830 SEM operated at 25 kV acceleration potential, 24 mm working distance, 0 degrees sample tilt, coated with 250 Å carbon, and also using the attached XRF unit operated at 30 kV.
A Bruker D2 Phaser X-ray diffractometer was also used in the study and operated at 30 kV and 10 mA.
Fig. 1:  Photograph of the specimen.  Approximately 45mm maximum dimension.
Fig.2: Backscattered electron image of an area of the specimen. (bluish part sticking up)
Fig. 3: Energy dispersive spectrum of spot 1 in Fig. 2.  (likely beryl with a resin coating, note tall carbon peak!)
Fig. 4: Energy dispersive spectrum of spot 2 in Fig. 2 (resin/epoxy)
Fig.5: Backscattered electron image of another area of the specimen. (paler colored portion)
Fig. 6: Energy dispersive spectrum of spot 1 in Fig. 5.  (beryl plus resin/epoxy)
Fig. 7: X-ray diffraction scan of the material.  Match for beryl.
Summary of findings:  This specimen (Fig. 1) is already looking and feeling odd.  Figs. 2 and 5 show a surface that appears to be drowned out in some material.  The composition looks like beryl plus some resin or epoxy (Figs. 2,3, 5, and 6).  The resin only spectrum is shown in Fig. 4.  The presence of beryl was confirmed by X-ray diffraction (Fig. 7).
Date:    9-26-2024                      Signature
Pyrite crystals in a chlorite-rich matrix from Pakistan, identified as a chlorite schist.
Sample: 1089 (#15 Pakistani pyrite in matrix). Completed: September 30, 2024.
Finding: Pyrite within a chlorite-group matrix, essentially chlorite schist—a low-grade metamorphic rock.
The crystals and their host rock
The pyrite crystals display both cube and pentagonal dodecahedral faces. Electron imaging and energy-dispersive analyses identify pyrite and the chlorite-group matrix. The specimen measures approximately 45 mm at its maximum dimension.
Locality: Pakistan, as recorded in the report and Soul Body Gems sourcing notes.
These results are the property of Soul Body Gems, Alexander Falster, and the Maine Mineral & Gem Museum. Any mention requires full acknowledgment.
Understanding the report figures
Use this guide alongside the written findings and the original report transcript. It explains the purpose of each analytical figure and preserves the laboratory’s own figure labels. The interpretations apply to the tested specimen; signals alone do not establish the identity of every similar-looking stone.
Electron microscope image: This view shows small-scale regions selected for analysis. Its brightness contrast helps distinguish regions with different compositions; it is not a photograph of their natural colors. Numbered spots connect this view to the analyses listed in the report.
Laboratory figure caption: Fig.2: Backscattered electron image of an area of the specimen.
Elemental spectrum: The peaks record characteristic X-ray signals from elements in the analyzed spot or area. This is an analysis of that location, not automatically of the entire specimen. Any mineral identification or uncertainty named in the laboratory caption is retained below.
Laboratory figure caption: Fig. 3: Energy dispersive spectrum of spot 1 in Fig. 2. (pyrite)
Elemental spectrum: The peaks record characteristic X-ray signals from elements in the analyzed spot or area. This is an analysis of that location, not automatically of the entire specimen. Any mineral identification or uncertainty named in the laboratory caption is retained below.
Laboratory figure caption: Fig. 4: Energy dispersive spectrum of spot 2 in Fig. 2 (chlorite group species)
Read the report as text
Analytical Result Report
Sample id: 1089 (#15, Pakistani pyrite in matrix)
Submitted by: Soul Body Gems
Date completed: 9-30-2024
Operating conditions: An AMRAY 1830 SEM operated at 25 kV acceleration potential, 24 mm working distance, 0 degrees sample tilt, coated with 250 Å carbon, and also using the attached XRF unit operated at 30 kV.
Fig. 1:  Photograph of the specimen.  Approximately 45mm maximum dimension.
Fig.2: Backscattered electron image of an area of the specimen.
Fig. 3: Energy dispersive spectrum of spot 1 in Fig. 2.  (pyrite)
Fig. 4: Energy dispersive spectrum of spot 2 in Fig. 2 (chlorite group species)
Summary of findings:  This specimen (Fig. 1) is nice!  Pyrite (Figs. 2 and 3) crystals displaying the cube and pentadodecahedron faces in a chlorite group (Figs. 2 and 4) matrix, essentially in a chlorite schist, a low-grade metamorphic rock.
Date:    9-30-2024                      Signature
Pyrite crystals in a chlorite-rich matrix from Pakistan, identified as a chlorite schist.
Sample: 1089 (#15 Pakistani pyrite in matrix). Completed: September 30, 2024.
Finding: Pyrite within a chlorite-group matrix, essentially chlorite schist—a low-grade metamorphic rock.
The crystals and their host rock
The pyrite crystals display both cube and pentagonal dodecahedral faces. Electron imaging and energy-dispersive analyses identify pyrite and the chlorite-group matrix. The specimen measures approximately 45 mm at its maximum dimension.
Locality: Pakistan, as recorded in the report and Soul Body Gems sourcing notes.
These results are the property of Soul Body Gems, Alexander Falster, and the Maine Mineral & Gem Museum. Any mention requires full acknowledgment.
Understanding the report figures
Use this guide alongside the written findings and the original report transcript. It explains the purpose of each analytical figure and preserves the laboratory’s own figure labels. The interpretations apply to the tested specimen; signals alone do not establish the identity of every similar-looking stone.
Electron microscope image: This view shows small-scale regions selected for analysis. Its brightness contrast helps distinguish regions with different compositions; it is not a photograph of their natural colors. Numbered spots connect this view to the analyses listed in the report.
Laboratory figure caption: Fig.2: Backscattered electron image of an area of the specimen.
Elemental spectrum: The peaks record characteristic X-ray signals from elements in the analyzed spot or area. This is an analysis of that location, not automatically of the entire specimen. Any mineral identification or uncertainty named in the laboratory caption is retained below.
Laboratory figure caption: Fig. 3: Energy dispersive spectrum of spot 1 in Fig. 2. (pyrite)
Elemental spectrum: The peaks record characteristic X-ray signals from elements in the analyzed spot or area. This is an analysis of that location, not automatically of the entire specimen. Any mineral identification or uncertainty named in the laboratory caption is retained below.
Laboratory figure caption: Fig. 4: Energy dispersive spectrum of spot 2 in Fig. 2 (chlorite group species)
Read the report as text
Analytical Result Report
Sample id: 1089 (#15, Pakistani pyrite in matrix)
Submitted by: Soul Body Gems
Date completed: 9-30-2024
Operating conditions: An AMRAY 1830 SEM operated at 25 kV acceleration potential, 24 mm working distance, 0 degrees sample tilt, coated with 250 Å carbon, and also using the attached XRF unit operated at 30 kV.
Fig. 1:  Photograph of the specimen.  Approximately 45mm maximum dimension.
Fig.2: Backscattered electron image of an area of the specimen.
Fig. 3: Energy dispersive spectrum of spot 1 in Fig. 2.  (pyrite)
Fig. 4: Energy dispersive spectrum of spot 2 in Fig. 2 (chlorite group species)
Summary of findings:  This specimen (Fig. 1) is nice!  Pyrite (Figs. 2 and 3) crystals displaying the cube and pentadodecahedron faces in a chlorite group (Figs. 2 and 4) matrix, essentially in a chlorite schist, a low-grade metamorphic rock.
Date:    9-30-2024                      Signature
Indian beryl with platy iron-oxide inclusions, offered under the trade names Moss Aquamarine, Sunstone Aquamarine, and Aquamarine with Sunstone.
Sample: 1245 (#3 beryl with inclusions). Completed: May 13, 2025.
Finding: Beryl containing hematite and/or goethite. The morphology suggests at least some goethite.
What gives this material its included appearance?
Electron imaging and energy-dispersive analysis identified platy iron-oxide inclusions within the beryl. The report retains uncertainty between hematite and goethite, while noting that the inclusion shape suggests some goethite is present.
“Sunstone Aquamarine” and “Aquamarine with Sunstone” are trade names for this material. Sunstone was not identified in this report; the tested inclusions were iron oxides. The specimen photographed in the report weighs 9.62 carats.
Locality: India, according to Soul Body Gems sourcing notes.
These results are the property of Soul Body Gems, Alexander Falster, and the Maine Mineral & Gem Museum. Any mention requires full acknowledgment.
Understanding the report figures
Use this guide alongside the written findings and the original report transcript. It explains the purpose of each analytical figure and preserves the laboratory’s own figure labels. The interpretations apply to the tested specimen; signals alone do not establish the identity of every similar-looking stone.
Electron microscope image: This view shows small-scale regions selected for analysis. Its brightness contrast helps distinguish regions with different compositions; it is not a photograph of their natural colors. Numbered spots connect this view to the analyses listed in the report.
Laboratory figure caption: Fig. 2: Backscattered electron image of an area of the specimen in Fig. 1.
Elemental spectrum: The peaks record characteristic X-ray signals from elements in the analyzed spot or area. This is an analysis of that location, not automatically of the entire specimen. Any mineral identification or uncertainty named in the laboratory caption is retained below.
Laboratory figure caption: Fig. 3: Energy dispersive spectrum of spot 1 in Fig. 2. (hematite/goethite, with some scatter from the beryl)
Elemental spectrum: The peaks record characteristic X-ray signals from elements in the analyzed spot or area. This is an analysis of that location, not automatically of the entire specimen. Any mineral identification or uncertainty named in the laboratory caption is retained below.
Laboratory figure caption: Fig. 4: Energy dispersive spectrum of spot 2 in Fig. 4. (beryl)
Electron microscope image: This view shows small-scale regions selected for analysis. Its brightness contrast helps distinguish regions with different compositions; it is not a photograph of their natural colors. Numbered spots connect this view to the analyses listed in the report.
Laboratory figure caption: Fig.2: Backscattered electron image of an area of the specimen.
Elemental spectrum: The peaks record characteristic X-ray signals from elements in the analyzed spot or area. This is an analysis of that location, not automatically of the entire specimen. Any mineral identification or uncertainty named in the laboratory caption is retained below.
Laboratory figure caption: Fig. 3: Energy dispersive spectrum of spot 1 in Fig. 2. This is the blue part. (beryl)
Elemental spectrum: The peaks record characteristic X-ray signals from elements in the analyzed spot or area. This is an analysis of that location, not automatically of the entire specimen. Any mineral identification or uncertainty named in the laboratory caption is retained below.
Laboratory figure caption: Fig. 4: Energy dispersive spectrum of spot 2 in Fig. 2 (albite)
Read the report as text
Analytical Result Report
Sample id: 1245 (#3 beryl with inclusions)
Submitted by: Soul Body Gems
Date completed: 5-13-2025
Operating conditions: An AMRAY 1830 SEM operated at 25 kV acceleration potential, 24 mm working distance, 0 degrees sample tilt, coated with 250 Å carbon, and also using the attached XRF unit operated at 30 kV.
Fig. 1: Photograph of the specimen. 9.62 cts.
Fig. 2: Backscattered electron image of an area of the specimen in Fig. 1.
Fig. 3: Energy dispersive spectrum of spot 1 in Fig. 2. (hematite/goethite, with some scatter from the beryl)
Fig. 4: Energy dispersive spectrum of spot 2 in Fig. 4. (beryl)
Summary:
This specimen (Fig. 1) is interesting. It has inclusions of a platy iron oxide, hematite and/or goethite (Figs. 2 and 3). The morphology suggests at least some goethite is present. The stone itself is indeed beryl (Figs. 2 and 4).
Date: 5-13-2025
Signature
Transcription note: The figure 4 caption's reference to Fig. 4 is retained as printed. Two overlapping screenshots were supplied, rather than the original document; the graph labels visible include O, Fe, Si and Al.
Report 2 — sample 1111: another included aquamarine variation
An 8.50-carat aquamarine with hollow and mineral-filled tubes, albite and likely iron-oxide coatings.
Sample: 1111 (#5, cut aquamarine). Completed: January 23, 2025.
What the testing found
Testing identified beryl with 0.22 wt. % sodium, 0.09 wt. % cesium and 0.24 wt. % iron. Iron accounts for the blue color. Many tubes run parallel to the c-axis; some are hollow, while others contain minerals. Albite grains were exposed on cut surfaces, and thin brown coatings in some open tubes were likely introduced iron oxides.
This is another variation listed under Moss Aquamarine. “Rainbow” is the name used for this material; the report does not establish the cause of a rainbow optical effect.
These results are the property of Soul Body Gems, Alexander Falster, and the Maine Mineral & Gem Museum. Any mention requires full acknowledgment.
Read the complete report as text
Analytical Result Report
Sample id: 1111 (#5, cut aquamarine)
Submitted by: Soul Body Gems
Date completed: 1-23-2025
Operating conditions: An AMRAY 1830 SEM operated at 25 kV acceleration potential, 24 mm working distance, 0 degrees sample tilt, coated with 250 Å carbon, and also using the attached XRF unit operated at 30 kV.
A Bruker D2 Phaser X-ray diffractometer was also used in the study and operated at 30 kV and 10 mA.
Photograph of the specimen. 8.50 cts. On the right is a close-up of 9 stacked images showing open and filled hollow tubes in the stone.
Fig.2: Backscattered electron image of an area of the specimen.
Fig. 3: Energy dispersive spectrum of spot 1 in Fig. 2. This is the blue part. (beryl)
Fig. 4: Energy dispersive spectrum of spot 2 in Fig. 2 (albite)
Summary of findings: This specimen (Fig. 1) is interesting. The beryl is normal in composition (Figs. 2 and 3), it contains 0.22 wt. % sodium, 0.09 wt. % cesium and 0.24 wt. % iron.
The sodium and cesium contents are low which is typical for aquamarine of lesser evolved pegmatite zones. The iron content is also what is expected in aquamarine, it is the chromophore for this color.
The stone has lots of tubes, these run usually parallel to the c-axis. Many of them are hollow (Fig. 1 close-up photo) but some are filled with other minerals. Several grains of albite were found exposed on the cut surfaces (Figs. 2 and 4) and in some hollow tubes, thin brownish coatings were noted which is likely to the fact that these hollow tubes were exposed to the surface and some iron oxides migrated into them.
Indian beryl with platy iron-oxide inclusions, offered under the trade names Moss Aquamarine, Sunstone Aquamarine, and Aquamarine with Sunstone.
Sample: 1245 (#3 beryl with inclusions). Completed: May 13, 2025.
Finding: Beryl containing hematite and/or goethite. The morphology suggests at least some goethite.
What gives this material its included appearance?
Electron imaging and energy-dispersive analysis identified platy iron-oxide inclusions within the beryl. The report retains uncertainty between hematite and goethite, while noting that the inclusion shape suggests some goethite is present.
“Sunstone Aquamarine” and “Aquamarine with Sunstone” are trade names for this material. Sunstone was not identified in this report; the tested inclusions were iron oxides. The specimen photographed in the report weighs 9.62 carats.
Locality: India, according to Soul Body Gems sourcing notes.
These results are the property of Soul Body Gems, Alexander Falster, and the Maine Mineral & Gem Museum. Any mention requires full acknowledgment.
Understanding the report figures
Use this guide alongside the written findings and the original report transcript. It explains the purpose of each analytical figure and preserves the laboratory’s own figure labels. The interpretations apply to the tested specimen; signals alone do not establish the identity of every similar-looking stone.
Electron microscope image: This view shows small-scale regions selected for analysis. Its brightness contrast helps distinguish regions with different compositions; it is not a photograph of their natural colors. Numbered spots connect this view to the analyses listed in the report.
Laboratory figure caption: Fig. 2: Backscattered electron image of an area of the specimen in Fig. 1.
Elemental spectrum: The peaks record characteristic X-ray signals from elements in the analyzed spot or area. This is an analysis of that location, not automatically of the entire specimen. Any mineral identification or uncertainty named in the laboratory caption is retained below.
Laboratory figure caption: Fig. 3: Energy dispersive spectrum of spot 1 in Fig. 2. (hematite/goethite, with some scatter from the beryl)
Elemental spectrum: The peaks record characteristic X-ray signals from elements in the analyzed spot or area. This is an analysis of that location, not automatically of the entire specimen. Any mineral identification or uncertainty named in the laboratory caption is retained below.
Laboratory figure caption: Fig. 4: Energy dispersive spectrum of spot 2 in Fig. 4. (beryl)
Electron microscope image: This view shows small-scale regions selected for analysis. Its brightness contrast helps distinguish regions with different compositions; it is not a photograph of their natural colors. Numbered spots connect this view to the analyses listed in the report.
Laboratory figure caption: Fig.2: Backscattered electron image of an area of the specimen.
Elemental spectrum: The peaks record characteristic X-ray signals from elements in the analyzed spot or area. This is an analysis of that location, not automatically of the entire specimen. Any mineral identification or uncertainty named in the laboratory caption is retained below.
Laboratory figure caption: Fig. 3: Energy dispersive spectrum of spot 1 in Fig. 2. This is the blue part. (beryl)
Elemental spectrum: The peaks record characteristic X-ray signals from elements in the analyzed spot or area. This is an analysis of that location, not automatically of the entire specimen. Any mineral identification or uncertainty named in the laboratory caption is retained below.
Laboratory figure caption: Fig. 4: Energy dispersive spectrum of spot 2 in Fig. 2 (albite)
Read the report as text
Analytical Result Report
Sample id: 1245 (#3 beryl with inclusions)
Submitted by: Soul Body Gems
Date completed: 5-13-2025
Operating conditions: An AMRAY 1830 SEM operated at 25 kV acceleration potential, 24 mm working distance, 0 degrees sample tilt, coated with 250 Å carbon, and also using the attached XRF unit operated at 30 kV.
Fig. 1: Photograph of the specimen. 9.62 cts.
Fig. 2: Backscattered electron image of an area of the specimen in Fig. 1.
Fig. 3: Energy dispersive spectrum of spot 1 in Fig. 2. (hematite/goethite, with some scatter from the beryl)
Fig. 4: Energy dispersive spectrum of spot 2 in Fig. 4. (beryl)
Summary:
This specimen (Fig. 1) is interesting. It has inclusions of a platy iron oxide, hematite and/or goethite (Figs. 2 and 3). The morphology suggests at least some goethite is present. The stone itself is indeed beryl (Figs. 2 and 4).
Date: 5-13-2025
Signature
Transcription note: The figure 4 caption's reference to Fig. 4 is retained as printed. Two overlapping screenshots were supplied, rather than the original document; the graph labels visible include O, Fe, Si and Al.
Report 2 — sample 1111: another included aquamarine variation
An 8.50-carat aquamarine with hollow and mineral-filled tubes, albite and likely iron-oxide coatings.
Sample: 1111 (#5, cut aquamarine). Completed: January 23, 2025.
What the testing found
Testing identified beryl with 0.22 wt. % sodium, 0.09 wt. % cesium and 0.24 wt. % iron. Iron accounts for the blue color. Many tubes run parallel to the c-axis; some are hollow, while others contain minerals. Albite grains were exposed on cut surfaces, and thin brown coatings in some open tubes were likely introduced iron oxides.
This is another variation listed under Moss Aquamarine. “Rainbow” is the name used for this material; the report does not establish the cause of a rainbow optical effect.
These results are the property of Soul Body Gems, Alexander Falster, and the Maine Mineral & Gem Museum. Any mention requires full acknowledgment.
Read the complete report as text
Analytical Result Report
Sample id: 1111 (#5, cut aquamarine)
Submitted by: Soul Body Gems
Date completed: 1-23-2025
Operating conditions: An AMRAY 1830 SEM operated at 25 kV acceleration potential, 24 mm working distance, 0 degrees sample tilt, coated with 250 Å carbon, and also using the attached XRF unit operated at 30 kV.
A Bruker D2 Phaser X-ray diffractometer was also used in the study and operated at 30 kV and 10 mA.
Photograph of the specimen. 8.50 cts. On the right is a close-up of 9 stacked images showing open and filled hollow tubes in the stone.
Fig.2: Backscattered electron image of an area of the specimen.
Fig. 3: Energy dispersive spectrum of spot 1 in Fig. 2. This is the blue part. (beryl)
Fig. 4: Energy dispersive spectrum of spot 2 in Fig. 2 (albite)
Summary of findings: This specimen (Fig. 1) is interesting. The beryl is normal in composition (Figs. 2 and 3), it contains 0.22 wt. % sodium, 0.09 wt. % cesium and 0.24 wt. % iron.
The sodium and cesium contents are low which is typical for aquamarine of lesser evolved pegmatite zones. The iron content is also what is expected in aquamarine, it is the chromophore for this color.
The stone has lots of tubes, these run usually parallel to the c-axis. Many of them are hollow (Fig. 1 close-up photo) but some are filled with other minerals. Several grains of albite were found exposed on the cut surfaces (Figs. 2 and 4) and in some hollow tubes, thin brownish coatings were noted which is likely to the fact that these hollow tubes were exposed to the surface and some iron oxides migrated into them.
Indian beryl with platy iron-oxide inclusions, offered under the trade names Moss Aquamarine, Sunstone Aquamarine, and Aquamarine with Sunstone.
Sample: 1245 (#3 beryl with inclusions). Completed: May 13, 2025.
Finding: Beryl containing hematite and/or goethite. The morphology suggests at least some goethite.
What gives this material its included appearance?
Electron imaging and energy-dispersive analysis identified platy iron-oxide inclusions within the beryl. The report retains uncertainty between hematite and goethite, while noting that the inclusion shape suggests some goethite is present.
“Sunstone Aquamarine” and “Aquamarine with Sunstone” are trade names for this material. Sunstone was not identified in this report; the tested inclusions were iron oxides. The specimen photographed in the report weighs 9.62 carats.
Locality: India, according to Soul Body Gems sourcing notes.
These results are the property of Soul Body Gems, Alexander Falster, and the Maine Mineral & Gem Museum. Any mention requires full acknowledgment.
Understanding the report figures
Use this guide alongside the written findings and the original report transcript. It explains the purpose of each analytical figure and preserves the laboratory’s own figure labels. The interpretations apply to the tested specimen; signals alone do not establish the identity of every similar-looking stone.
Electron microscope image: This view shows small-scale regions selected for analysis. Its brightness contrast helps distinguish regions with different compositions; it is not a photograph of their natural colors. Numbered spots connect this view to the analyses listed in the report.
Laboratory figure caption: Fig. 2: Backscattered electron image of an area of the specimen in Fig. 1.
Elemental spectrum: The peaks record characteristic X-ray signals from elements in the analyzed spot or area. This is an analysis of that location, not automatically of the entire specimen. Any mineral identification or uncertainty named in the laboratory caption is retained below.
Laboratory figure caption: Fig. 3: Energy dispersive spectrum of spot 1 in Fig. 2. (hematite/goethite, with some scatter from the beryl)
Elemental spectrum: The peaks record characteristic X-ray signals from elements in the analyzed spot or area. This is an analysis of that location, not automatically of the entire specimen. Any mineral identification or uncertainty named in the laboratory caption is retained below.
Laboratory figure caption: Fig. 4: Energy dispersive spectrum of spot 2 in Fig. 4. (beryl)
Electron microscope image: This view shows small-scale regions selected for analysis. Its brightness contrast helps distinguish regions with different compositions; it is not a photograph of their natural colors. Numbered spots connect this view to the analyses listed in the report.
Laboratory figure caption: Fig.2: Backscattered electron image of an area of the specimen.
Elemental spectrum: The peaks record characteristic X-ray signals from elements in the analyzed spot or area. This is an analysis of that location, not automatically of the entire specimen. Any mineral identification or uncertainty named in the laboratory caption is retained below.
Laboratory figure caption: Fig. 3: Energy dispersive spectrum of spot 1 in Fig. 2. This is the blue part. (beryl)
Elemental spectrum: The peaks record characteristic X-ray signals from elements in the analyzed spot or area. This is an analysis of that location, not automatically of the entire specimen. Any mineral identification or uncertainty named in the laboratory caption is retained below.
Laboratory figure caption: Fig. 4: Energy dispersive spectrum of spot 2 in Fig. 2 (albite)
Read the report as text
Analytical Result Report
Sample id: 1245 (#3 beryl with inclusions)
Submitted by: Soul Body Gems
Date completed: 5-13-2025
Operating conditions: An AMRAY 1830 SEM operated at 25 kV acceleration potential, 24 mm working distance, 0 degrees sample tilt, coated with 250 Å carbon, and also using the attached XRF unit operated at 30 kV.
Fig. 1: Photograph of the specimen. 9.62 cts.
Fig. 2: Backscattered electron image of an area of the specimen in Fig. 1.
Fig. 3: Energy dispersive spectrum of spot 1 in Fig. 2. (hematite/goethite, with some scatter from the beryl)
Fig. 4: Energy dispersive spectrum of spot 2 in Fig. 4. (beryl)
Summary:
This specimen (Fig. 1) is interesting. It has inclusions of a platy iron oxide, hematite and/or goethite (Figs. 2 and 3). The morphology suggests at least some goethite is present. The stone itself is indeed beryl (Figs. 2 and 4).
Date: 5-13-2025
Signature
Transcription note: The figure 4 caption's reference to Fig. 4 is retained as printed. Two overlapping screenshots were supplied, rather than the original document; the graph labels visible include O, Fe, Si and Al.
Report 2 — sample 1111: another included aquamarine variation
An 8.50-carat aquamarine with hollow and mineral-filled tubes, albite and likely iron-oxide coatings.
Sample: 1111 (#5, cut aquamarine). Completed: January 23, 2025.
What the testing found
Testing identified beryl with 0.22 wt. % sodium, 0.09 wt. % cesium and 0.24 wt. % iron. Iron accounts for the blue color. Many tubes run parallel to the c-axis; some are hollow, while others contain minerals. Albite grains were exposed on cut surfaces, and thin brown coatings in some open tubes were likely introduced iron oxides.
This is another variation listed under Moss Aquamarine. “Rainbow” is the name used for this material; the report does not establish the cause of a rainbow optical effect.
These results are the property of Soul Body Gems, Alexander Falster, and the Maine Mineral & Gem Museum. Any mention requires full acknowledgment.
Read the complete report as text
Analytical Result Report
Sample id: 1111 (#5, cut aquamarine)
Submitted by: Soul Body Gems
Date completed: 1-23-2025
Operating conditions: An AMRAY 1830 SEM operated at 25 kV acceleration potential, 24 mm working distance, 0 degrees sample tilt, coated with 250 Å carbon, and also using the attached XRF unit operated at 30 kV.
A Bruker D2 Phaser X-ray diffractometer was also used in the study and operated at 30 kV and 10 mA.
Photograph of the specimen. 8.50 cts. On the right is a close-up of 9 stacked images showing open and filled hollow tubes in the stone.
Fig.2: Backscattered electron image of an area of the specimen.
Fig. 3: Energy dispersive spectrum of spot 1 in Fig. 2. This is the blue part. (beryl)
Fig. 4: Energy dispersive spectrum of spot 2 in Fig. 2 (albite)
Summary of findings: This specimen (Fig. 1) is interesting. The beryl is normal in composition (Figs. 2 and 3), it contains 0.22 wt. % sodium, 0.09 wt. % cesium and 0.24 wt. % iron.
The sodium and cesium contents are low which is typical for aquamarine of lesser evolved pegmatite zones. The iron content is also what is expected in aquamarine, it is the chromophore for this color.
The stone has lots of tubes, these run usually parallel to the c-axis. Many of them are hollow (Fig. 1 close-up photo) but some are filled with other minerals. Several grains of albite were found exposed on the cut surfaces (Figs. 2 and 4) and in some hollow tubes, thin brownish coatings were noted which is likely to the fact that these hollow tubes were exposed to the surface and some iron oxides migrated into them.
Date: 1-23-2025 Signature
Sold as “Sunstone in Aquamarine,” this Tanzanian material tested as albite-peristerite with hematite inclusions. No beryl was present.
Sample: 1254 (#5 ‘sunstone in aqua’). Completed: May 30, 2025.
Identification: Sodic plagioclase, essentially albite with a small anorthite component, showing peristerite schiller and hematite inclusions.
No aquamarine in the tested material
Aquamarine is a variety of beryl. This report explicitly states that no beryl was present, so “Sunstone in Aquamarine” is a misleading market name for the tested beads.
The schiller comes from exsolutions within the plagioclase. The red-to-black inclusions are hematite. The author notes that tiny hematite or mica flakes can produce the appearance associated with sunstone, but considers these particular inclusions rather large for that description and prefers “hematite inclusions.”
Locality: Tanzania, according to Soul Body Gems sourcing notes. The photographed beads measure 7 mm.
These results are the property of Soul Body Gems, Alexander Falster, and the Maine Mineral & Gem Museum. Any mention requires full acknowledgment.
Understanding the report figures
Use this guide alongside the written findings and the original report transcript. It explains the purpose of each analytical figure and preserves the laboratory’s own figure labels. The interpretations apply to the tested specimen; signals alone do not establish the identity of every similar-looking stone.
Electron microscope image: This view shows small-scale regions selected for analysis. Its brightness contrast helps distinguish regions with different compositions; it is not a photograph of their natural colors. Numbered spots connect this view to the analyses listed in the report.
Laboratory figure caption: Fig. 2: Backscattered electron image of an area of the specimen in Fig. 1.
Elemental spectrum: The peaks record characteristic X-ray signals from elements in the analyzed spot or area. This is an analysis of that location, not automatically of the entire specimen. Any mineral identification or uncertainty named in the laboratory caption is retained below.
Laboratory figure caption: Fig. 3: Energy dispersive spectrum of spot 1 in Fig. 2. (sodic plagioclase)
Electron microscope image: This view shows small-scale regions selected for analysis. Its brightness contrast helps distinguish regions with different compositions; it is not a photograph of their natural colors. Numbered spots connect this view to the analyses listed in the report.
Laboratory figure caption: Fig. 4: Backscattered electron image of another area of the specimen in Fig. 1.
Elemental spectrum: The peaks record characteristic X-ray signals from elements in the analyzed spot or area. This is an analysis of that location, not automatically of the entire specimen. Any mineral identification or uncertainty named in the laboratory caption is retained below.
Laboratory figure caption: Fig. 5: Energy dispersive spectrum of spot 1 in Fig. 4. (hematite)
Read the report as text
Analytical Result Report
Sample id: 1254 (#5 ‘sunstone in aqua’)
Submitted by: Soul Body Gems
Date completed: 5-30-2025
Operating conditions: An AMRAY 1830 SEM operated at 25 kV acceleration potential, 24 mm working distance, 0 degrees sample tilt, coated with 250 Å carbon, and also using the attached XRF unit operated at 30 kV.
Fig. 1: Photograph of the specimen. 7 mm bead dimension.
Fig. 2: Backscattered electron image of an area of the specimen in Fig. 1.
Fig. 3: Energy dispersive spectrum of spot 1 in Fig. 2. (sodic plagioclase)
Fig. 4: Backscattered electron image of another area of the specimen in Fig. 1.
Fig. 5: Energy dispersive spectrum of spot 1 in Fig. 4. (hematite)
Summary:
These specimens (Fig. 1) are very interesting. The bulk is a sodic plagioclase, (Figs. 2 and 3) essentially an albite with a small anorthite component. The schiller is caused by exsolutions in the plagioclase. This is what is referred to as an albite peristerite. The red to black inclusions (Figs. 1, 4 and 5) are hematite. In sunstones, inclusions of tiny flakes of hematite or mica species give the stone an aventurine-like appearance. I would just say the beads have hematite inclusions, to me they are a bit large to call it sunstone but that is a matter of opinion. There is no beryl present.
Date: 5-30-2025
Signature
Sold as “Sunstone in Aquamarine,” this Tanzanian material tested as albite-peristerite with hematite inclusions. No beryl was present.
Sample: 1254 (#5 ‘sunstone in aqua’). Completed: May 30, 2025.
Identification: Sodic plagioclase, essentially albite with a small anorthite component, showing peristerite schiller and hematite inclusions.
No aquamarine in the tested material
Aquamarine is a variety of beryl. This report explicitly states that no beryl was present, so “Sunstone in Aquamarine” is a misleading market name for the tested beads.
The schiller comes from exsolutions within the plagioclase. The red-to-black inclusions are hematite. The author notes that tiny hematite or mica flakes can produce the appearance associated with sunstone, but considers these particular inclusions rather large for that description and prefers “hematite inclusions.”
Locality: Tanzania, according to Soul Body Gems sourcing notes. The photographed beads measure 7 mm.
These results are the property of Soul Body Gems, Alexander Falster, and the Maine Mineral & Gem Museum. Any mention requires full acknowledgment.
Understanding the report figures
Use this guide alongside the written findings and the original report transcript. It explains the purpose of each analytical figure and preserves the laboratory’s own figure labels. The interpretations apply to the tested specimen; signals alone do not establish the identity of every similar-looking stone.
Electron microscope image: This view shows small-scale regions selected for analysis. Its brightness contrast helps distinguish regions with different compositions; it is not a photograph of their natural colors. Numbered spots connect this view to the analyses listed in the report.
Laboratory figure caption: Fig. 2: Backscattered electron image of an area of the specimen in Fig. 1.
Elemental spectrum: The peaks record characteristic X-ray signals from elements in the analyzed spot or area. This is an analysis of that location, not automatically of the entire specimen. Any mineral identification or uncertainty named in the laboratory caption is retained below.
Laboratory figure caption: Fig. 3: Energy dispersive spectrum of spot 1 in Fig. 2. (sodic plagioclase)
Electron microscope image: This view shows small-scale regions selected for analysis. Its brightness contrast helps distinguish regions with different compositions; it is not a photograph of their natural colors. Numbered spots connect this view to the analyses listed in the report.
Laboratory figure caption: Fig. 4: Backscattered electron image of another area of the specimen in Fig. 1.
Elemental spectrum: The peaks record characteristic X-ray signals from elements in the analyzed spot or area. This is an analysis of that location, not automatically of the entire specimen. Any mineral identification or uncertainty named in the laboratory caption is retained below.
Laboratory figure caption: Fig. 5: Energy dispersive spectrum of spot 1 in Fig. 4. (hematite)
Read the report as text
Analytical Result Report
Sample id: 1254 (#5 ‘sunstone in aqua’)
Submitted by: Soul Body Gems
Date completed: 5-30-2025
Operating conditions: An AMRAY 1830 SEM operated at 25 kV acceleration potential, 24 mm working distance, 0 degrees sample tilt, coated with 250 Å carbon, and also using the attached XRF unit operated at 30 kV.
Fig. 1: Photograph of the specimen. 7 mm bead dimension.
Fig. 2: Backscattered electron image of an area of the specimen in Fig. 1.
Fig. 3: Energy dispersive spectrum of spot 1 in Fig. 2. (sodic plagioclase)
Fig. 4: Backscattered electron image of another area of the specimen in Fig. 1.
Fig. 5: Energy dispersive spectrum of spot 1 in Fig. 4. (hematite)
Summary:
These specimens (Fig. 1) are very interesting. The bulk is a sodic plagioclase, (Figs. 2 and 3) essentially an albite with a small anorthite component. The schiller is caused by exsolutions in the plagioclase. This is what is referred to as an albite peristerite. The red to black inclusions (Figs. 1, 4 and 5) are hematite. In sunstones, inclusions of tiny flakes of hematite or mica species give the stone an aventurine-like appearance. I would just say the beads have hematite inclusions, to me they are a bit large to call it sunstone but that is a matter of opinion. There is no beryl present.
Date: 5-30-2025
Signature
A hematite-included feldspar carving identified as microperthitic intermediate microcline with elevated barium.
Sample: 9251 (sample 20, Buddha sunstone). Completed: May 8, 2021.
Finding: Exsolved feldspar with plagioclase lamellae, incomplete structural ordering, and hematite inclusions.
Feldspar texture and inclusions
The report describes potassium feldspar intergrown with sodic plagioclase (albite). Its remaining translucency suggests incomplete structural ordering, as in intermediate microcline or orthoclase. The final identification is essentially microperthitic intermediate microcline. Hematite inclusions give the appearance associated with sunstone.
These results are the property of Soul Body Gems, Alexander Falster, and the Maine Mineral & Gem Museum. Any mention requires full acknowledgment.
Understanding the report figures
Use this guide alongside the written findings and the original report transcript. It explains the purpose of each analytical figure and preserves the laboratory’s own figure labels. The interpretations apply to the tested specimen; signals alone do not establish the identity of every similar-looking stone.
Electron microscope image: This view shows small-scale regions selected for analysis. Its brightness contrast helps distinguish regions with different compositions; it is not a photograph of their natural colors. Numbered spots connect this view to the analyses listed in the report.
Laboratory figure caption: Fig. 2: Backscattered electron image of sample 20.
Elemental spectrum: The peaks record characteristic X-ray signals from elements in the analyzed spot or area. This is an analysis of that location, not automatically of the entire specimen. Any mineral identification or uncertainty named in the laboratory caption is retained below.
Laboratory figure caption: Fig. 3: Energy dispersive spectral analysis of spot 1 in Fig. 2. (potassium feldspar)
Elemental spectrum: The peaks record characteristic X-ray signals from elements in the analyzed spot or area. This is an analysis of that location, not automatically of the entire specimen. Any mineral identification or uncertainty named in the laboratory caption is retained below.
Laboratory figure caption: Fig. 4: Energy dispersive spectral analysis of spot 2 in Fig. 2. (sodic plagioclase, albite)
Element map: This map shows where the named elements occur within the analyzed area. Its colors represent the laboratory’s selected element channels, rather than the specimen’s visible colors. The caption below preserves any color key or distribution noted by the laboratory.
Laboratory figure caption: Fig. 5: X-ray map. Sodium-red, potassium green
Read the report as text
Analytical Result Report
Sample id: 9251 (sample 20, Buddha sunstone)
Submitted by: K. Bitner
Date submitted: March 27, 2021.
Date completed: May 8, 2021.
Operating conditions: An AMRAY 1830 SEM operated at 25 kV acceleration potential, 26 mm working distance, 15 degrees sample tilt, coated with 250 Å carbon. Using the X-ray fluorescence attachment with 35 kV potential in conjunction with the EDS system.
Fig. 1: Photograph of the specimens #20, 2.1 cm maximum dimension.
Fig. 2: Backscattered electron image of sample 20.
Fig. 3: Energy dispersive spectral analysis of spot 1 in Fig. 2. (potassium feldspar)
Fig. 4: Energy dispersive spectral analysis of spot 2 in Fig. 2. (sodic plagioclase, albite)
Fig. 5: X-ray map. Sodium-red, potassium green
Fig. 6: Photomicrograph of specimen 19 showing hematite inclusions.
Summary of findings: This specimen (Fig. 1) is an exsolved feldspar (Figs. 2-6). It clearly shows the plagioclase lamellae (Figs. 2 and 5). The fact that it is still translucent suggests that it has not achieved full structural order as in microcline. It appears that it is only incompletely ordered such as in an intermediate microcline or orthoclase. Fig. 6 shows the hematite inclusions which are so typical in ‘sunstone’. The material is essentially a microperthitic intermediate microcline with elevated barium content (Table 1).
Date: May 8, 2021. Signature.
Transcription note: Figure 6 references specimen 19 as printed, while this report's sample designation is sample 20.
Table 1: Trace and minor elements in sample 20 (wt. %)
Polished material sold as Smithsonite or Hemimorphite · May 2025 collection photograph. The report identifies its submitted specimen as man-made glass.
Polished Not Smithsonite · May 2025 collection photograph.
A polished blue material marketed as smithsonite or hemimorphite, identified in this specimen as man-made sodium-calcium glass.
Sample: 10624 (number 3). Completed: August 8, 2024.
Finding: Sodium-calcium glass with copper and minor chromium and iron as coloring agents. The mounting is copper-rich, not identified as silver.
The tested stone and mounting
The report finds chemically different high-calcium and low-calcium portions in the glass. Neither genuine smithsonite nor hemimorphite was identified in this tested specimen. These entry names preserve the market labels so visitors can find the correction.
The mounting contains 95–96 wt. % copper. Silver is not reported in the analysis; Soul Body Gems records that it had been sold as silver. The report's remaining-alloy wording repeats copper and mentions zinc, so the exact balance is not clarified here.
These results are the property of Soul Body Gems, Alexander Falster, and the Maine Mineral & Gem Museum. Any mention requires full acknowledgment.
Understanding the report figures
Use this guide alongside the written findings and the original report transcript. It explains the purpose of each analytical figure and preserves the laboratory’s own figure labels. The interpretations apply to the tested specimen; signals alone do not establish the identity of every similar-looking stone.
Electron microscope image: This view shows small-scale regions selected for analysis. Its brightness contrast helps distinguish regions with different compositions; it is not a photograph of their natural colors. Numbered spots connect this view to the analyses listed in the report.
Laboratory figure caption: Fig. 2: Backscattered electron image of an area of the specimen.
Elemental spectrum: The peaks record characteristic X-ray signals from elements in the analyzed spot or area. This is an analysis of that location, not automatically of the entire specimen. Any mineral identification or uncertainty named in the laboratory caption is retained below.
Laboratory figure caption: Fig. 3: Energy dispersive spectrum of spot 1 in Fig. 2.
Elemental spectrum: The peaks record characteristic X-ray signals from elements in the analyzed spot or area. This is an analysis of that location, not automatically of the entire specimen. Any mineral identification or uncertainty named in the laboratory caption is retained below.
Laboratory figure caption: Fig. 4: Energy dispersive spectrum of spot 2 in Fig. 2.
Element map: This map shows where the named elements occur within the analyzed area. Its colors represent the laboratory’s selected element channels, rather than the specimen’s visible colors. The caption below preserves any color key or distribution noted by the laboratory.
Laboratory figure caption: Fig. 5: X-ray maps of the area shown in Fig. 2: left: Sodium: yellow, calcium: red. Right: aluminum: blue.
Read the report as text
Analytical Result Report
Sample id: 10624 (number 3)
Submitted by: Soul Body Gems
Date completed: 8-8-2024
Operating conditions: An AMRAY 1830 SEM operated at 25 kV acceleration potential, 24 mm working distance, 0 degrees sample tilt, coated with 250 Å carbon, and also using the attached XRF unit operated at 30 kV.
Fig. 1: Photograph of the specimen. The stone is about 2.5 cm in maximum dimension.
Fig. 2: Backscattered electron image of an area of the specimen.
Fig. 3: Energy dispersive spectrum of spot 1 in Fig. 2.
Fig. 4: Energy dispersive spectrum of spot 2 in Fig. 2.
Fig. 5: X-ray maps of the area shown in Fig. 2: left: Sodium: yellow, calcium: red. Right: aluminum: blue.
Summary of findings: This specimen (Fig. 1) is evidently a man-made product, likely a glass with noticeable heterogeneity (Fig. 2 and 5 and Table 1). The material is composed of a high-calcium portion (spot 2) (Figs. 2 and 4) and a low calcium portion (spot 1) (Figs. 2 and 3). It is essentially a sodium calcium glass with copper and minor chromium and iron as coloring agents. The mounting consists of 95-96 wt. % copper with the rest made up of copper and zinc.
Date: August 8, 2024. Signature.
Transcription note: The repeated copper wording in the mounting description is retained from the original report.
Table 1: Minor and trace elements in the stone (wt. %)
Polished material sold as Smithsonite or Hemimorphite · May 2025 collection photograph. The report identifies its submitted specimen as man-made glass.
Polished Not Smithsonite · May 2025 collection photograph.
A polished blue material marketed as smithsonite or hemimorphite, identified in this specimen as man-made sodium-calcium glass.
Sample: 10624 (number 3). Completed: August 8, 2024.
Finding: Sodium-calcium glass with copper and minor chromium and iron as coloring agents. The mounting is copper-rich, not identified as silver.
The tested stone and mounting
The report finds chemically different high-calcium and low-calcium portions in the glass. Neither genuine smithsonite nor hemimorphite was identified in this tested specimen. These entry names preserve the market labels so visitors can find the correction.
The mounting contains 95–96 wt. % copper. Silver is not reported in the analysis; Soul Body Gems records that it had been sold as silver. The report's remaining-alloy wording repeats copper and mentions zinc, so the exact balance is not clarified here.
These results are the property of Soul Body Gems, Alexander Falster, and the Maine Mineral & Gem Museum. Any mention requires full acknowledgment.
Understanding the report figures
Use this guide alongside the written findings and the original report transcript. It explains the purpose of each analytical figure and preserves the laboratory’s own figure labels. The interpretations apply to the tested specimen; signals alone do not establish the identity of every similar-looking stone.
Electron microscope image: This view shows small-scale regions selected for analysis. Its brightness contrast helps distinguish regions with different compositions; it is not a photograph of their natural colors. Numbered spots connect this view to the analyses listed in the report.
Laboratory figure caption: Fig. 2: Backscattered electron image of an area of the specimen.
Elemental spectrum: The peaks record characteristic X-ray signals from elements in the analyzed spot or area. This is an analysis of that location, not automatically of the entire specimen. Any mineral identification or uncertainty named in the laboratory caption is retained below.
Laboratory figure caption: Fig. 3: Energy dispersive spectrum of spot 1 in Fig. 2.
Elemental spectrum: The peaks record characteristic X-ray signals from elements in the analyzed spot or area. This is an analysis of that location, not automatically of the entire specimen. Any mineral identification or uncertainty named in the laboratory caption is retained below.
Laboratory figure caption: Fig. 4: Energy dispersive spectrum of spot 2 in Fig. 2.
Element map: This map shows where the named elements occur within the analyzed area. Its colors represent the laboratory’s selected element channels, rather than the specimen’s visible colors. The caption below preserves any color key or distribution noted by the laboratory.
Laboratory figure caption: Fig. 5: X-ray maps of the area shown in Fig. 2: left: Sodium: yellow, calcium: red. Right: aluminum: blue.
Read the report as text
Analytical Result Report
Sample id: 10624 (number 3)
Submitted by: Soul Body Gems
Date completed: 8-8-2024
Operating conditions: An AMRAY 1830 SEM operated at 25 kV acceleration potential, 24 mm working distance, 0 degrees sample tilt, coated with 250 Å carbon, and also using the attached XRF unit operated at 30 kV.
Fig. 1: Photograph of the specimen. The stone is about 2.5 cm in maximum dimension.
Fig. 2: Backscattered electron image of an area of the specimen.
Fig. 3: Energy dispersive spectrum of spot 1 in Fig. 2.
Fig. 4: Energy dispersive spectrum of spot 2 in Fig. 2.
Fig. 5: X-ray maps of the area shown in Fig. 2: left: Sodium: yellow, calcium: red. Right: aluminum: blue.
Summary of findings: This specimen (Fig. 1) is evidently a man-made product, likely a glass with noticeable heterogeneity (Fig. 2 and 5 and Table 1). The material is composed of a high-calcium portion (spot 2) (Figs. 2 and 4) and a low calcium portion (spot 1) (Figs. 2 and 3). It is essentially a sodium calcium glass with copper and minor chromium and iron as coloring agents. The mounting consists of 95-96 wt. % copper with the rest made up of copper and zinc.
Date: August 8, 2024. Signature.
Transcription note: The repeated copper wording in the mounting description is retained from the original report.
Table 1: Minor and trace elements in the stone (wt. %)
A sodalite-group specimen whose combined microscopy, elemental analysis, and X-ray diffraction indicate a likely mixture including haüyne.
Sample: 1504 (#2 cut sodalite). Completed: June 20, 2025.
Finding: Essentially a sodalite-group material, likely a mixed composition with haüyne, sodalite, and lazurite, plus intergrown gonnardite.
A mixed mineral composition
The analysis distinguishes two chemically different portions: one with little appreciable chlorine and another that is sulfur-rich. X-ray diffraction supports a sodalite-group identification. The report describes haüyne, sodalite, and lazurite as a likely mixed composition, rather than confirming a pure haüyne specimen.
Intergrown gonnardite, a zeolite, is considered likely to be the white material. The report includes a comparison photograph under UV-A, UV-B, and UV-C. The specimen measures approximately 1 cm at its maximum dimension.
These results are the property of Soul Body Gems, Alexander Falster, and the Maine Mineral & Gem Museum. Any mention requires full acknowledgment.
Understanding the report figures
Use this guide alongside the written findings and the original report transcript. It explains the purpose of each analytical figure and preserves the laboratory’s own figure labels. The interpretations apply to the tested specimen; signals alone do not establish the identity of every similar-looking stone.
Electron microscope image: This view shows small-scale regions selected for analysis. Its brightness contrast helps distinguish regions with different compositions; it is not a photograph of their natural colors. Numbered spots connect this view to the analyses listed in the report.
Laboratory figure caption: Fig. 2: Backscattered electron image of an area of the specimen in Fig. 1.
Elemental spectrum: The peaks record characteristic X-ray signals from elements in the analyzed spot or area. This is an analysis of that location, not automatically of the entire specimen. Any mineral identification or uncertainty named in the laboratory caption is retained below.
Laboratory figure caption: Fig. 3: Energy dispersive spectrum of spot 1 in Fig. 2. (sodalite group possibly)
Elemental spectrum: The peaks record characteristic X-ray signals from elements in the analyzed spot or area. This is an analysis of that location, not automatically of the entire specimen. Any mineral identification or uncertainty named in the laboratory caption is retained below.
Laboratory figure caption: Fig. 4: Energy dispersive spectrum of spot 2 in Fig. 2. (sodalite group member)
Diffraction scan: This scan helps identify crystalline minerals by comparing the measured pattern with reference patterns. The laboratory interpretation explains which minerals the comparison supports.
Laboratory figure caption: Fig. 5: X-ray diffraction scan of the material with potential matching pattern overlays.
Read the report as text
Analytical Result Report
Sample id: 1504 (#2 cut sodalite)
Submitted by: Soul Body Gems
Date completed: 6-20-2025
Operating conditions: An AMRAY 1830 SEM operated at 25 kV acceleration potential, 24 mm working distance, 0 degrees sample tilt, coated with 250 Å carbon, and also using the attached XRF unit operated at 30 kV.
A Broker D2 Phaser was also used in the study and operated at 30 kV and 10 mA.
Fig. 1: Photograph of the specimens. 1 cm maximum dimension. Right image under UV-A,B,C.
Fig. 2: Backscattered electron image of an area of the specimen in Fig. 1.
Fig. 3: Energy dispersive spectrum of spot 1 in Fig. 2. (sodalite group possibly)
Fig. 4: Energy dispersive spectrum of spot 2 in Fig. 2. (sodalite group member)
Fig. 5: X-ray diffraction scan of the material with potential matching pattern overlays.
Summary of findings: This is an interesting specimen (Fig. 1). It is composed of two distinct species. One is likely a member of the sodalite group (Figs. 2 and 3) but does not contain an appreciable amount of chlorine. The other portion is sulfur-rich and shows a composition compatible with sodalite group members. The X-ray diffraction scan confirms that it is essentially a sodalite group member, likely a mixed composition with haüyne, sodalite, lazurite plus intergrown gonnardite, a zeolite, that is likely the white material.
Date: 6-20-2025. Signature.
Pyrite crystals with a clay-bearing matrix, tested to examine their composition and whether the specimen had been manipulated.
Sample: 1229 (#2 pyrite, Pakistan or Afghanistan). Completed: April 4, 2025.
Finding: Typical pyrite with kaolinite and fine-grained pyrite. The researcher saw no effects of manipulation.
The matrix and natural appearance
“Pyrite on Limonite Clay” is the supplied name for this material. The analytical report identifies kaolinite with fine-grained pyrite in the tested matrix; it does not identify limonite as a separate component.
The researcher describes the specimen as looking just as it was found, with no observed evidence of manipulation. Its maximum dimension is approximately 5 cm.
Locality: Recorded as Pakistan or Afghanistan in the sample designation; the precise country remains unresolved.
These results are the property of Soul Body Gems, Alexander Falster, and the Maine Mineral & Gem Museum. Any mention requires full acknowledgment.
Understanding the report figures
Use this guide alongside the written findings and the original report transcript. It explains the purpose of each analytical figure and preserves the laboratory’s own figure labels. The interpretations apply to the tested specimen; signals alone do not establish the identity of every similar-looking stone.
Electron microscope image: This view shows small-scale regions selected for analysis. Its brightness contrast helps distinguish regions with different compositions; it is not a photograph of their natural colors. Numbered spots connect this view to the analyses listed in the report.
Laboratory figure caption: Fig. 2: Backscattered electron image of an area of the specimen in Fig. 1.
Elemental spectrum: The peaks record characteristic X-ray signals from elements in the analyzed spot or area. This is an analysis of that location, not automatically of the entire specimen. Any mineral identification or uncertainty named in the laboratory caption is retained below.
Laboratory figure caption: Fig. 3: Energy dispersive spectrum of spot 1 in Fig. 2. (pyrite)
Elemental spectrum: The peaks record characteristic X-ray signals from elements in the analyzed spot or area. This is an analysis of that location, not automatically of the entire specimen. Any mineral identification or uncertainty named in the laboratory caption is retained below.
Laboratory figure caption: Fig. 4: Energy dispersive spectrum of spot 2 in Fig. 2. (likely kaolinite plus pyrite).
Read the report as text
Analytical Result Report
Sample id: 1229 (#2 pyrite, Pakistan or Afghanistan)
Submitted by: Soul Body Gems
Date completed: 4-4-2025
Operating conditions: An AMRAY 1830 SEM operated at 25 kV acceleration potential, 24 mm working distance, 0 degrees sample tilt, coated with 250 Å carbon, and also using the attached XRF unit operated at 30 kV.
Fig. 1: Photograph of the specimens. 5 cm maximum dimension.
Fig. 2: Backscattered electron image of an area of the specimen in Fig. 1.
Fig. 3: Energy dispersive spectrum of spot 1 in Fig. 2. (pyrite)
Fig. 4: Energy dispersive spectrum of spot 2 in Fig. 2. (likely kaolinite plus pyrite).
Summary of findings: This is a pretty one! (Fig. 1). It is typical pyrite with some kaolinite with fine-grained pyrite (Figs 2 and 4). It looks just as it was found, I see no effects of any manipulation.
Date: 4-4-2025. Signature.
Pyrite crystals with a clay-bearing matrix, tested to examine their composition and whether the specimen had been manipulated.
Sample: 1229 (#2 pyrite, Pakistan or Afghanistan). Completed: April 4, 2025.
Finding: Typical pyrite with kaolinite and fine-grained pyrite. The researcher saw no effects of manipulation.
The matrix and natural appearance
“Pyrite on Limonite Clay” is the supplied name for this material. The analytical report identifies kaolinite with fine-grained pyrite in the tested matrix; it does not identify limonite as a separate component.
The researcher describes the specimen as looking just as it was found, with no observed evidence of manipulation. Its maximum dimension is approximately 5 cm.
Locality: Recorded as Pakistan or Afghanistan in the sample designation; the precise country remains unresolved.
These results are the property of Soul Body Gems, Alexander Falster, and the Maine Mineral & Gem Museum. Any mention requires full acknowledgment.
Understanding the report figures
Use this guide alongside the written findings and the original report transcript. It explains the purpose of each analytical figure and preserves the laboratory’s own figure labels. The interpretations apply to the tested specimen; signals alone do not establish the identity of every similar-looking stone.
Electron microscope image: This view shows small-scale regions selected for analysis. Its brightness contrast helps distinguish regions with different compositions; it is not a photograph of their natural colors. Numbered spots connect this view to the analyses listed in the report.
Laboratory figure caption: Fig. 2: Backscattered electron image of an area of the specimen in Fig. 1.
Elemental spectrum: The peaks record characteristic X-ray signals from elements in the analyzed spot or area. This is an analysis of that location, not automatically of the entire specimen. Any mineral identification or uncertainty named in the laboratory caption is retained below.
Laboratory figure caption: Fig. 3: Energy dispersive spectrum of spot 1 in Fig. 2. (pyrite)
Elemental spectrum: The peaks record characteristic X-ray signals from elements in the analyzed spot or area. This is an analysis of that location, not automatically of the entire specimen. Any mineral identification or uncertainty named in the laboratory caption is retained below.
Laboratory figure caption: Fig. 4: Energy dispersive spectrum of spot 2 in Fig. 2. (likely kaolinite plus pyrite).
Read the report as text
Analytical Result Report
Sample id: 1229 (#2 pyrite, Pakistan or Afghanistan)
Submitted by: Soul Body Gems
Date completed: 4-4-2025
Operating conditions: An AMRAY 1830 SEM operated at 25 kV acceleration potential, 24 mm working distance, 0 degrees sample tilt, coated with 250 Å carbon, and also using the attached XRF unit operated at 30 kV.
Fig. 1: Photograph of the specimens. 5 cm maximum dimension.
Fig. 2: Backscattered electron image of an area of the specimen in Fig. 1.
Fig. 3: Energy dispersive spectrum of spot 1 in Fig. 2. (pyrite)
Fig. 4: Energy dispersive spectrum of spot 2 in Fig. 2. (likely kaolinite plus pyrite).
Summary of findings: This is a pretty one! (Fig. 1). It is typical pyrite with some kaolinite with fine-grained pyrite (Figs 2 and 4). It looks just as it was found, I see no effects of any manipulation.
Date: 4-4-2025. Signature.
Amethyst Velvet Spheres · Soul Body Gems, December 2024.
An amethyst sphere sourced from Africa, with hollow tubes containing white material at exposed surfaces.
Sample: 1200 (amethyst sphere). Completed: December 21, 2024.
Finding: Quartz, variety amethyst. The white material in exposed tubes is a rare-earth oxide mixture interpreted as polishing residue.
Amethyst and the white material
The quartz contains typical iron and aluminum levels: 0.045 wt. % iron and 0.29 wt. % aluminum. Analysis of the white material found mainly cerium with smaller amounts of lanthanum, neodymium, and other light rare-earth elements.
The report interprets this as technical-grade cerium-oxide polishing material trapped in or caked over exposed hollow tubes. Another dozen filled tubes gave identical results. This interpretation concerns the exposed white filling, rather than identifying it as a natural inclusion.
Locality: Africa, according to Soul Body Gems sourcing notes; no specific country is supplied. The sphere measures approximately 7 cm.
These results are the property of Soul Body Gems, Alexander Falster, and the Maine Mineral & Gem Museum. Any mention requires full acknowledgment.
Understanding the report figures
Use this guide alongside the written findings and the original report transcript. It explains the purpose of each analytical figure and preserves the laboratory’s own figure labels. The interpretations apply to the tested specimen; signals alone do not establish the identity of every similar-looking stone.
Electron microscope image: This view shows small-scale regions selected for analysis. Its brightness contrast helps distinguish regions with different compositions; it is not a photograph of their natural colors. Numbered spots connect this view to the analyses listed in the report.
Laboratory figure caption: Fig. 2: Backscattered electron image of an area of the specimen.
Elemental spectrum: The peaks record characteristic X-ray signals from elements in the analyzed spot or area. This is an analysis of that location, not automatically of the entire specimen. Any mineral identification or uncertainty named in the laboratory caption is retained below.
Laboratory figure caption: Fig. 3: Energy dispersive spectrum of spot 1 in Fig. 2. (quartz)
Elemental spectrum: The peaks record characteristic X-ray signals from elements in the analyzed spot or area. This is an analysis of that location, not automatically of the entire specimen. Any mineral identification or uncertainty named in the laboratory caption is retained below.
Laboratory figure caption: Fig. 4: Energy dispersive spectrum of spot 2 in Fig. 2. (rare earth oxide mix)
Electron microscope image: This view shows small-scale regions selected for analysis. Its brightness contrast helps distinguish regions with different compositions; it is not a photograph of their natural colors. Numbered spots connect this view to the analyses listed in the report.
Laboratory figure caption: Fig. 5: Backscattered electron image of another area of the specimen.
Elemental spectrum: The peaks record characteristic X-ray signals from elements in the analyzed spot or area. This is an analysis of that location, not automatically of the entire specimen. Any mineral identification or uncertainty named in the laboratory caption is retained below.
Laboratory figure caption: Fig. 6: Energy dispersive spectrum of spot 1 in Fig. 2. (rare earth oxide mix)
Read the report as text
Analytical Result Report
Sample id: 1200 (amethyst sphere)
Submitted by: Soul Body Gems
Date completed: 12-21-2024
Operating conditions: An AMRAY 1830 SEM operated at 25 kV acceleration potential, 24 mm working distance, 0 degrees sample tilt, coated with 250 Å carbon, and also using the attached XRF unit operated at 30 kV.
Fig. 1: Photograph of the specimens. 7 cm maximum dimensions. Smaller images show the hollow tubes filled with white material.
Fig. 2: Backscattered electron image of an area of the specimen.
Fig. 3: Energy dispersive spectrum of spot 1 in Fig. 2. (quartz)
Fig. 4: Energy dispersive spectrum of spot 2 in Fig. 2. (rare earth oxide mix)
Fig. 5: Backscattered electron image of another area of the specimen.
Fig. 6: Energy dispersive spectrum of spot 1 in Fig. 2. (rare earth oxide mix)
Summary of findings: This specimen (Fig. 1) is an interesting one! The quartz, var. amethyst is pretty normal (Figs. 2 and 3) and it contains the typical amount of iron and aluminum (0.045 wt. % iron, 0.29 wt. % aluminum). Hollow tubes run through part of the specimen (Fig. 1) and some are filled with white material. Where exposed at the surface (Figs. 2, 4, 5 and 6), the white material was shown to be an oxide of rare earth elements, especially cerium and lesser amounts of lanthanum, neodymium and other light rare earth elements. The exposed hollow tubes appear to have been filled with polishing material, technical grade cerium oxide with some of the other rare earth oxides is commonly used for this. Some calcium is also present (Figs. 2, 4, 5, and 6). Fig. 5 shows another one of these hollow tubes but here it is caked over the opening. In the spectra, silicon also shows up since the beam was scattered or penetrated through the white material. Another dozen of these filled tubes were checked with identical results.
Date: 12-21-2024. Signature.
Transcription note: Figure 6's reference to Fig. 2 is retained as printed.
Gem Scapolite (Tanzania) · Soul Body Gems, November 2024.
A 7.88-carat faceted gemstone identified as marialite, a member of the scapolite group.
Sample: 10623 (number 2). Completed: August 8, 2024.
Finding: Marialite of the scapolite group, supported by elemental analysis, measured density, and refractive index.
Identifying the faceted stone
The measured density was 2.58 g/cm³, and the refractive index measured on the table facet was approximately 1.54. The report states that both agree with marialite.
This is a different tested specimen from the meionite-rich material in our Scapolite Meionite entry. These results describe the faceted marialite gemstone shown in this report.
These results are the property of Soul Body Gems, Alexander Falster, and the Maine Mineral & Gem Museum. Any mention requires full acknowledgment.
Understanding the report figures
Use this guide alongside the written findings and the original report transcript. It explains the purpose of each analytical figure and preserves the laboratory’s own figure labels. The interpretations apply to the tested specimen; signals alone do not establish the identity of every similar-looking stone.
Electron microscope image: This view shows small-scale regions selected for analysis. Its brightness contrast helps distinguish regions with different compositions; it is not a photograph of their natural colors. Numbered spots connect this view to the analyses listed in the report.
Laboratory figure caption: Fig. 2: Backscattered electron image of an area of the specimen.
Elemental spectrum: The peaks record characteristic X-ray signals from elements in the analyzed spot or area. This is an analysis of that location, not automatically of the entire specimen. Any mineral identification or uncertainty named in the laboratory caption is retained below.
Laboratory figure caption: Fig. 3: Energy dispersive spectrum of spot 1 in Fig. 2. (scapolite group)
Read the report as text
Analytical Result Report
Sample id: 10623 (number 2)
Submitted by: Soul Body Gems
Date completed: 8-8-2024
Operating conditions: An AMRAY 1830 SEM operated at 25 kV acceleration potential, 24 mm working distance, 0 degrees sample tilt, coated with 250 Å carbon, and also using the attached XRF unit operated at 30 kV.
Fig. 1: Photograph of the specimen. 7.88 ct.
Fig. 2: Backscattered electron image of an area of the specimen.
Fig. 3: Energy dispersive spectrum of spot 1 in Fig. 2. (scapolite group)
Summary of findings: This specimen (Fig. 1) is a beautiful cut stone. It is a marialite of the scapolite group (Figs. 2 and 3). The density was measured as 2.58 g/cm3 and the refractive index measured on the table is around 1.54, both are in agreement with marialite.
Date: August 8, 2024. Signature.
These are August 2025 collection views. The laboratory findings below apply to the specific specimens analyzed for samples 1501 and 1526; these photographs do not establish that either pictured specimen was tested.
Brazilian fluorescent quartz examined for a claimed powellite identification.
Sample: 1501 (#1 powellite in quartz?). Completed: June 20, 2025; supplied document includes later additions.
Key finding: No detectable molybdenum or powellite. MicroRaman and X-ray diffraction showed quartz only.
No detectable powellite
“Powellite in Amethyst” is retained as a searchable market name. It is not an identification supported by this report. Trace-element analysis of the crushed, pulverized sample detected no molybdenum, and the author concludes that powellite is not present in the tested specimen.
The report gives an X-ray fluorescence detection limit in the 5 ppm range and a separate quantification limit of approximately 50–60 ppm. It explains that MicroRaman and X-ray diffraction may not resolve inclusions too small to distinguish.
A small carbon peak was observed. The researcher considers small amounts of a hydrocarbon compound the likely cause of the yellow fluorescent bands; this is an interpretation rather than identification of a specific compound.
Locality: Brazil, according to Soul Body Gems sourcing notes. Maximum dimension approximately 5.5 cm.
These results are the property of Soul Body Gems, Alexander Falster, and the Maine Mineral & Gem Museum. Any mention requires full acknowledgment.
Understanding the report figures
Use this guide alongside the written findings and the original report transcript. It explains the purpose of each analytical figure and preserves the laboratory’s own figure labels. The interpretations apply to the tested specimen; signals alone do not establish the identity of every similar-looking stone.
Electron microscope image: This view shows small-scale regions selected for analysis. Its brightness contrast helps distinguish regions with different compositions; it is not a photograph of their natural colors. Numbered spots connect this view to the analyses listed in the report.
Laboratory figure caption: Fig.2: Backscattered electron image of an area of the specimen in Fig. 1.
Elemental spectrum: The peaks record characteristic X-ray signals from elements in the analyzed spot or area. This is an analysis of that location, not automatically of the entire specimen. Any mineral identification or uncertainty named in the laboratory caption is retained below.
Laboratory figure caption: Fig. 3: Energy dispersive spectrum of spot 1 in Fig. 2. (quartz)
Elemental spectrum: The peaks record characteristic X-ray signals from elements in the analyzed spot or area. This is an analysis of that location, not automatically of the entire specimen. Any mineral identification or uncertainty named in the laboratory caption is retained below.
Laboratory figure caption: Fig. 4: Energy dispersive spectrum of spot 2 in Fig. 2. (quartz)
Electron microscope image: This view shows small-scale regions selected for analysis. Its brightness contrast helps distinguish regions with different compositions; it is not a photograph of their natural colors. Numbered spots connect this view to the analyses listed in the report.
Laboratory figure caption: Fig.3: Backscattered electron images of fluorescent areas of the specimens in Fig. 1.
Elemental spectrum: The peaks record characteristic X-ray signals from elements in the analyzed spot or area. This is an analysis of that location, not automatically of the entire specimen. Any mineral identification or uncertainty named in the laboratory caption is retained below.
Laboratory figure caption: Fig. 4: Energy dispersive spectra of spots of the 10 specimens in Figs. 3. Fig. 5: Fig. 4: Example of an energy dispersive spectrum collected at 10 kV to show a small carbon ppeak. Table 1: Minor and trace elements in the specimens (in wt. %) Element 1 2 3 4 5 6 7 8 9 10 Aluminum 0.44 0.38 0.48 0.42 0.51 0..45 0.46 0.37 0.40 0.42 Calcium 0.01 nd 0.02 0.01 nd nd 0.04 0.01 0.04 0.06 Iron 0.34 0.23 0.27 0.36 0.11 0.27 0.44 0.46 0.23 0.38 Manganese nd nd nd 0.02 nd 0.03 nd nd nd nd Molybdenum nd nd nd nd nd nd 0.05 0.04 nd nd Titanium 0.04 0.05 0.03 0.04 0.06 0.03 0.05 0.03 0.02 0.02
Read the report as text
Analytical Result Report
Sample id: 1501 (#1 powellite in quartz?)
Submitted by: Soul Body Gems
Date completed: 6-20-2025
Operating conditions: An AMRAY 1830 SEM operated at 25 kV acceleration potential, 24 mm working distance, 0 degrees sample tilt, coated with 250 Å carbon, and also using the attached XRF unit operated at 30 kV.
Fig. 1:  Photograph of the specimens.  5.5 cm maximum dimension. On the right, under UV-A,B,C.
Fig.2: Backscattered electron image of an area of the specimen in Fig. 1.
Fig. 3: Energy dispersive spectrum of spot 1 in Fig. 2. (quartz)
Fig. 4: Energy dispersive spectrum of spot 2 in Fig. 2. (quartz)
Table 1: Trace and minor elements in the specimen, in wt. %.
Summary of findings:  This is an interesting specimen (Fig. 1). The yellow, fluorescent bands are very striking (Fig. 1).
Chemically, the specimen is quartz (Fig. 2-4).
A small carbon peak was noted (Figs. 3 and 4), the fluorescence is likely caused by small amounts of a hydrocarbon compound.
The sample was crushed and pulverized for trace element analysis (Table 1). No molybdenum (Table 1) was discovered and thus powellite is not present.  MicroRaman only showed quartz and X-ray diffraction only shows quartz lines. If under high magnification, inclusions are not discernable, then the MicroRaman can’t help, either and X-ray diffraction is also of no help.  That leaves X-ray fluorescence with detection limits in the 5 ppm range.  Detection limit is NOT quantification limit.  50-60 ppm would be in the quantification limit but we could not detect molybdenum.  And it all hinges on that element.  it is not detectable.
Date:    6-20-2025                      Signature
Table 1: Trace and minor elements (wt. %)
Element
Result
Aluminum
0.35
Calcium
0.04
Iron
0.08
Molybdenum
nd
Titanium
0.02
Tungsten
nd
nd = not detected.
Additional testing: ten fluorescent amethyst specimens
Sample 1526, completed October 7, 2025, examined a batch of ten quartz specimens. The fluorescence occurs along small fractures and partially healed fractures near the crystal bases; the liquid in the visible fluid inclusions does not fluoresce.
The analyst considers trapped organic material, likely a hydrocarbon, the most likely explanation for this batch. Calcium and molybdenum were both detected in only a few specimens; those trace-element findings alone do not identify powellite as the fluorescent mineral.
These results are the property of Soul Body Gems, Alexander Falster, and the Maine Mineral & Gem Museum. Any mention requires full acknowledgment.
Read the complete report as text
Analytical Result Report Sample id: 1526 (10 amethyst specimens w fluorescence) Submitted by: Soul Body Gems Date completed: 10-7-2025 Operating conditions: An AMRAY 1830 SEM operated at 25 kV acceleration potential, 24 mm working distance, 0 degrees sample tilt, coated with 250 Å carbon, and also using the attached XRF unit operated at 30 kV.
Fig. 1: Photograph of the specimens. 9 cm maximum dimension.
Fig. 2: Photograph of the specimens under UV-A,B,C radiation.
Fig.3: Backscattered electron images of fluorescent areas of the specimens in Fig. 1.
Fig. 4: Energy dispersive spectra of spots of the 10 specimens in Figs. 3.
Fig. 5: Fig. 4: Example of an energy dispersive spectrum collected at 10 kV to show a small carbon ppeak.
Fig. 6: Photomicrographs taken with UV-A, B, C and visible light on (left image) and just UV (right image). Some fluid inclusions are marked with a red arrow, note that the liquid in the inclusions does not fluoresce.
Summary of findings: These are interesting specimens (Fig. 1) with unusual fluorescence (Figs 2 and 6). They are of course all quartz (Figs. 3 and 4). Table 1 shows minor and trace elements and only in a few were both calcium and molybdenum present. However, carbon was noted in small amounts (Fig. 5) where 10 kV were used to enhance its detection and only where it was essentially at the surface was it detected, that is on a freshly broken surface where UV fluorescence was detected. Fig. 6 shows several photomicrographs under 2 types of illumination: UV-A, B, C and visible light on (left iamge) and just UV (right image). What is striking is that the liquid in the fluid inclusions does not cause fluorescence but there are small fractures and partially healed fractures from which the fluorescence emanates. But they also appear to be like growth phantoms and they all are near the bases of the crystals. There must have been a different time during crystal growth when micro fractures formed, then rehealed and some time around this process, the fluorescent material was trapped and growth continued llargely undisturbed. In these specimens it appears some organic material, likely a hydrocarbon where the fluorescence is present. A hydrocarbon is the most likelly explanatyion for this batch of crystals and this has been observed in other locations as well. Date: 10-7-2025 Signature
Brazilian fluorescent quartz examined for a claimed powellite identification.
Sample: 1501 (#1 powellite in quartz?). Completed: June 20, 2025; supplied document includes later additions.
Key finding: No detectable molybdenum or powellite. MicroRaman and X-ray diffraction showed quartz only.
No detectable powellite
“Powellite in Amethyst” is retained as a searchable market name. It is not an identification supported by this report. Trace-element analysis of the crushed, pulverized sample detected no molybdenum, and the author concludes that powellite is not present in the tested specimen.
The report gives an X-ray fluorescence detection limit in the 5 ppm range and a separate quantification limit of approximately 50–60 ppm. It explains that MicroRaman and X-ray diffraction may not resolve inclusions too small to distinguish.
A small carbon peak was observed. The researcher considers small amounts of a hydrocarbon compound the likely cause of the yellow fluorescent bands; this is an interpretation rather than identification of a specific compound.
Locality: Brazil, according to Soul Body Gems sourcing notes. Maximum dimension approximately 5.5 cm.
These results are the property of Soul Body Gems, Alexander Falster, and the Maine Mineral & Gem Museum. Any mention requires full acknowledgment.
Understanding the report figures
Use this guide alongside the written findings and the original report transcript. It explains the purpose of each analytical figure and preserves the laboratory’s own figure labels. The interpretations apply to the tested specimen; signals alone do not establish the identity of every similar-looking stone.
Electron microscope image: This view shows small-scale regions selected for analysis. Its brightness contrast helps distinguish regions with different compositions; it is not a photograph of their natural colors. Numbered spots connect this view to the analyses listed in the report.
Laboratory figure caption: Fig.2: Backscattered electron image of an area of the specimen in Fig. 1.
Elemental spectrum: The peaks record characteristic X-ray signals from elements in the analyzed spot or area. This is an analysis of that location, not automatically of the entire specimen. Any mineral identification or uncertainty named in the laboratory caption is retained below.
Laboratory figure caption: Fig. 3: Energy dispersive spectrum of spot 1 in Fig. 2. (quartz)
Elemental spectrum: The peaks record characteristic X-ray signals from elements in the analyzed spot or area. This is an analysis of that location, not automatically of the entire specimen. Any mineral identification or uncertainty named in the laboratory caption is retained below.
Laboratory figure caption: Fig. 4: Energy dispersive spectrum of spot 2 in Fig. 2. (quartz)
Electron microscope image: This view shows small-scale regions selected for analysis. Its brightness contrast helps distinguish regions with different compositions; it is not a photograph of their natural colors. Numbered spots connect this view to the analyses listed in the report.
Laboratory figure caption: Fig.3: Backscattered electron images of fluorescent areas of the specimens in Fig. 1.
Elemental spectrum: The peaks record characteristic X-ray signals from elements in the analyzed spot or area. This is an analysis of that location, not automatically of the entire specimen. Any mineral identification or uncertainty named in the laboratory caption is retained below.
Laboratory figure caption: Fig. 4: Energy dispersive spectra of spots of the 10 specimens in Figs. 3. Fig. 5: Fig. 4: Example of an energy dispersive spectrum collected at 10 kV to show a small carbon ppeak. Table 1: Minor and trace elements in the specimens (in wt. %) Element 1 2 3 4 5 6 7 8 9 10 Aluminum 0.44 0.38 0.48 0.42 0.51 0..45 0.46 0.37 0.40 0.42 Calcium 0.01 nd 0.02 0.01 nd nd 0.04 0.01 0.04 0.06 Iron 0.34 0.23 0.27 0.36 0.11 0.27 0.44 0.46 0.23 0.38 Manganese nd nd nd 0.02 nd 0.03 nd nd nd nd Molybdenum nd nd nd nd nd nd 0.05 0.04 nd nd Titanium 0.04 0.05 0.03 0.04 0.06 0.03 0.05 0.03 0.02 0.02
Read the report as text
Analytical Result Report
Sample id: 1501 (#1 powellite in quartz?)
Submitted by: Soul Body Gems
Date completed: 6-20-2025
Operating conditions: An AMRAY 1830 SEM operated at 25 kV acceleration potential, 24 mm working distance, 0 degrees sample tilt, coated with 250 Å carbon, and also using the attached XRF unit operated at 30 kV.
Fig. 1:  Photograph of the specimens.  5.5 cm maximum dimension. On the right, under UV-A,B,C.
Fig.2: Backscattered electron image of an area of the specimen in Fig. 1.
Fig. 3: Energy dispersive spectrum of spot 1 in Fig. 2. (quartz)
Fig. 4: Energy dispersive spectrum of spot 2 in Fig. 2. (quartz)
Table 1: Trace and minor elements in the specimen, in wt. %.
Summary of findings:  This is an interesting specimen (Fig. 1). The yellow, fluorescent bands are very striking (Fig. 1).
Chemically, the specimen is quartz (Fig. 2-4).
A small carbon peak was noted (Figs. 3 and 4), the fluorescence is likely caused by small amounts of a hydrocarbon compound.
The sample was crushed and pulverized for trace element analysis (Table 1). No molybdenum (Table 1) was discovered and thus powellite is not present.  MicroRaman only showed quartz and X-ray diffraction only shows quartz lines. If under high magnification, inclusions are not discernable, then the MicroRaman can’t help, either and X-ray diffraction is also of no help.  That leaves X-ray fluorescence with detection limits in the 5 ppm range.  Detection limit is NOT quantification limit.  50-60 ppm would be in the quantification limit but we could not detect molybdenum.  And it all hinges on that element.  it is not detectable.
Date:    6-20-2025                      Signature
Table 1: Trace and minor elements (wt. %)
Element
Result
Aluminum
0.35
Calcium
0.04
Iron
0.08
Molybdenum
nd
Titanium
0.02
Tungsten
nd
nd = not detected.
Additional testing: ten fluorescent amethyst specimens
Sample 1526, completed October 7, 2025, examined a batch of ten quartz specimens. The fluorescence occurs along small fractures and partially healed fractures near the crystal bases; the liquid in the visible fluid inclusions does not fluoresce.
The analyst considers trapped organic material, likely a hydrocarbon, the most likely explanation for this batch. Calcium and molybdenum were both detected in only a few specimens; those trace-element findings alone do not identify powellite as the fluorescent mineral.
These results are the property of Soul Body Gems, Alexander Falster, and the Maine Mineral & Gem Museum. Any mention requires full acknowledgment.
Read the complete report as text
Analytical Result Report Sample id: 1526 (10 amethyst specimens w fluorescence) Submitted by: Soul Body Gems Date completed: 10-7-2025 Operating conditions: An AMRAY 1830 SEM operated at 25 kV acceleration potential, 24 mm working distance, 0 degrees sample tilt, coated with 250 Å carbon, and also using the attached XRF unit operated at 30 kV.
Fig. 1: Photograph of the specimens. 9 cm maximum dimension.
Fig. 2: Photograph of the specimens under UV-A,B,C radiation.
Fig.3: Backscattered electron images of fluorescent areas of the specimens in Fig. 1.
Fig. 4: Energy dispersive spectra of spots of the 10 specimens in Figs. 3.
Fig. 5: Fig. 4: Example of an energy dispersive spectrum collected at 10 kV to show a small carbon ppeak.
Fig. 6: Photomicrographs taken with UV-A, B, C and visible light on (left image) and just UV (right image). Some fluid inclusions are marked with a red arrow, note that the liquid in the inclusions does not fluoresce.
Summary of findings: These are interesting specimens (Fig. 1) with unusual fluorescence (Figs 2 and 6). They are of course all quartz (Figs. 3 and 4). Table 1 shows minor and trace elements and only in a few were both calcium and molybdenum present. However, carbon was noted in small amounts (Fig. 5) where 10 kV were used to enhance its detection and only where it was essentially at the surface was it detected, that is on a freshly broken surface where UV fluorescence was detected. Fig. 6 shows several photomicrographs under 2 types of illumination: UV-A, B, C and visible light on (left iamge) and just UV (right image). What is striking is that the liquid in the fluid inclusions does not cause fluorescence but there are small fractures and partially healed fractures from which the fluorescence emanates. But they also appear to be like growth phantoms and they all are near the bases of the crystals. There must have been a different time during crystal growth when micro fractures formed, then rehealed and some time around this process, the fluorescent material was trapped and growth continued llargely undisturbed. In these specimens it appears some organic material, likely a hydrocarbon where the fluorescence is present. A hydrocarbon is the most likelly explanatyion for this batch of crystals and this has been observed in other locations as well. Date: 10-7-2025 Signature
Brazilian quartz beads examined for unusual rounded areas and their mineral content.
Sample: 1228 (#1 bracelet). Completed: April 4, 2025.
Finding: Quartz beads with filled areas containing what appears to be dumortierite, organic resin, and muscovite.
Quartz with mineral and resin filling
The rounded areas were slightly depressed and appeared softer than the surrounding quartz. The researcher describes a filling mixture of likely dumortierite, organic resin, and muscovite. Some white crystals inside the beads also resemble dumortierite, but that observation is not presented as a separate definitive identification.
The resin finding matters when describing the tested beads: the report does not describe every visible feature as an untreated natural inclusion.
Locality: Brazil, according to Soul Body Gems sourcing notes. Beads measure approximately 7–8 mm.
These results are the property of Soul Body Gems, Alexander Falster, and the Maine Mineral & Gem Museum. Any mention requires full acknowledgment.
Understanding the report figures
Use this guide alongside the written findings and the original report transcript. It explains the purpose of each analytical figure and preserves the laboratory’s own figure labels. The interpretations apply to the tested specimen; signals alone do not establish the identity of every similar-looking stone.
Electron microscope image: This view shows small-scale regions selected for analysis. Its brightness contrast helps distinguish regions with different compositions; it is not a photograph of their natural colors. Numbered spots connect this view to the analyses listed in the report.
Laboratory figure caption: Fig.2: Backscattered electron image of an area of the specimen in Fig. 1.
Elemental spectrum: The peaks record characteristic X-ray signals from elements in the analyzed spot or area. This is an analysis of that location, not automatically of the entire specimen. Any mineral identification or uncertainty named in the laboratory caption is retained below.
Laboratory figure caption: Fig. 3: Energy dispersive spectrum of spot 1 in Fig. 2. (quartz)
Electron microscope image: This view shows small-scale regions selected for analysis. Its brightness contrast helps distinguish regions with different compositions; it is not a photograph of their natural colors. Numbered spots connect this view to the analyses listed in the report.
Laboratory figure caption: Fig.4: Backscattered electron image of another area of the specimen in Fig. 1.
Elemental spectrum: The peaks record characteristic X-ray signals from elements in the analyzed spot or area. This is an analysis of that location, not automatically of the entire specimen. Any mineral identification or uncertainty named in the laboratory caption is retained below.
Laboratory figure caption: Fig. 5: Energy dispersive spectrum of spot 1 in Fig. 4 (likely dumortierite).
Elemental spectrum: The peaks record characteristic X-ray signals from elements in the analyzed spot or area. This is an analysis of that location, not automatically of the entire specimen. Any mineral identification or uncertainty named in the laboratory caption is retained below.
Laboratory figure caption: Fig. 6: Energy dispersive spectrum of spot 2 in Fig. 4 (resin or such).
Elemental spectrum: The peaks record characteristic X-ray signals from elements in the analyzed spot or area. This is an analysis of that location, not automatically of the entire specimen. Any mineral identification or uncertainty named in the laboratory caption is retained below.
Laboratory figure caption: Fig. 7: Energy dispersive spectrum of spot 3 in Fig. 4 (muscovite).
Read the report as text
Analytical Result Report
Sample id: 1228 (#1 bracelet)
Submitted by: Soul Body Gems
Date completed: 4-4-2025
Operating conditions: An AMRAY 1830 SEM operated at 25 kV acceleration potential, 24 mm working distance, 0 degrees sample tilt, coated with 250 Å carbon, and also using the attached XRF unit operated at 30 kV.
Fig. 1:  Photograph of the specimens.  7-8 mm maximum dimension of the beads.  To the right is a close-up of the odd round areas (red arrow), usually slight depressed and soft.
Fig.2: Backscattered electron image of an area of the specimen in Fig. 1.
Fig. 3: Energy dispersive spectrum of spot 1 in Fig. 2. (quartz)
Fig.4: Backscattered electron image of another area of the specimen in Fig. 1.
Fig. 5: Energy dispersive spectrum of spot 1 in Fig. 4 (likely dumortierite).
Fig. 6: Energy dispersive spectrum of spot 2 in Fig. 4 (resin or such).
Fig. 7: Energy dispersive spectrum of spot 3 in Fig. 4 (muscovite).
Summary of findings:  This is a weird one! (Fig. 1).  In many beads are odd round areas, slightly depressed as if they are softer.  The beads are quartz (Figs. 2 and 3) but the round areas are filled in with a mix of what appears to be dumortierite (Figs. 2 and 5) among a some organic resin (Figs. 4 and 6) and there is also muscovite present (Figs. 4 and 7).  In the beads are also some white crystals that look a lot like dumortierite,
Date:    4-4-2025                      Signature
Malagasy Moonstone Spheres · Soul Body Gems, October 2024.
Sold as Malagasy Moonstone or Rainbow Moonstone, this Madagascar gemstone tested as labradorite. Malagasy Rainbow Labradorite is the corrected name used here.
Sample: 10622 (number 1). Completed: August 8, 2024.
Finding: Intermediate plagioclase in the labradorite compositional range.
Labradorite behind the market name
The report identifies the faceted stone as labradorite. Its measured density of 2.71 g/cm³ and refractive index of approximately 1.57 agree with that identification. The trade-name moonstone entries lead to the same results so visitors can find the distinction.
Locality: Madagascar, according to Soul Body Gems sourcing notes. The tested gemstone weighs 0.94 carats.
These results are the property of Soul Body Gems, Alexander Falster, and the Maine Mineral & Gem Museum. Any mention requires full acknowledgment.
Understanding the report figures
Use this guide alongside the written findings and the original report transcript. It explains the purpose of each analytical figure and preserves the laboratory’s own figure labels. The interpretations apply to the tested specimen; signals alone do not establish the identity of every similar-looking stone.
Electron microscope image: This view shows small-scale regions selected for analysis. Its brightness contrast helps distinguish regions with different compositions; it is not a photograph of their natural colors. Numbered spots connect this view to the analyses listed in the report.
Laboratory figure caption: Fig. 2: Backscattered electron image of an area of the specimen.
Elemental spectrum: The peaks record characteristic X-ray signals from elements in the analyzed spot or area. This is an analysis of that location, not automatically of the entire specimen. Any mineral identification or uncertainty named in the laboratory caption is retained below.
Laboratory figure caption: Fig. 3: Energy dispersive spectrum of spot 1 in Fig. 2. (plagioclase, labradorite compositional range)
Electron microscope image: This view shows small-scale regions selected for analysis. Its brightness contrast helps distinguish regions with different compositions; it is not a photograph of their natural colors. Numbered spots connect this view to the analyses listed in the report.
Laboratory figure caption: Fig.2: Backscattered electron image of an area of the specimen.
Elemental spectrum: The peaks record characteristic X-ray signals from elements in the analyzed spot or area. This is an analysis of that location, not automatically of the entire specimen. Any mineral identification or uncertainty named in the laboratory caption is retained below.
Laboratory figure caption: Fig. 3: Energy dispersive spectrum of spot 1 in Fig. 2. (plagioclase)
Read the report as text
Analytical Result Report
Sample id: 10622 (number 1)
Submitted by: Soul Body Gems
Date completed: 8-8-2024
Operating conditions: An AMRAY 1830 SEM operated at 25 kV acceleration potential, 24 mm working distance, 0 degrees sample tilt, coated with 250 Å carbon, and also using the attached XRF unit operated at 30 kV.
Fig. 1: Photograph of the specimen. 0.94 ct.
Fig. 2: Backscattered electron image of an area of the specimen.
Fig. 3: Energy dispersive spectrum of spot 1 in Fig. 2. (plagioclase, labradorite compositional range)
Summary of findings: This specimen (Fig. 1) is a beautiful cut stone. Compositionally, it is an intermediate plagioclase, a labradorite (Figs. 2 and 3). The density was measured as 2.71 g/cm3 and the refractive index measured on the table is around 1.57, both are in agreement with labradorite.
Date: August 8, 2024. Signature.
Additional variation: tested bracelet beads
Sample 1104, completed November 1, 2024, examined approximately 4.5 mm beads from a bracelet. These beads are plagioclase rather than potassium feldspar. Unlike the earlier faceted labradorite specimen, the analyst places these beads likely in the andesine–oligoclase compositional range because they contain less calcium.
The report attributes the schiller to a thin, sodium-rich albite film formed through exsolution. The two reports therefore document different plagioclase compositions sold under related moonstone trade names; they should not be treated as identical mineral identifications.
These results are the property of Soul Body Gems, Alexander Falster, and the Maine Mineral & Gem Museum. Any mention requires full acknowledgment.
Read the complete report as text
Analytical Result Report
Sample id: 1104 (blue bead bracelet #6)
Submitted by: Soul Body Gems
Date completed: 11-1-2024
Operating conditions: An AMRAY 1830 SEM operated at 25 kV acceleration potential, 24 mm working distance, 0 degrees sample tilt, coated with 250 Å carbon, and also using the attached XRF unit operated at 30 kV.
A Bruker D2 Phaser X-ray diffractometer was also used and operated under 30kV and 10 mA.
Fig. 1: Photograph of the specimen. Approximately 4.5 mm maximum dimension of the beads.
X 1X 1
X 1
X 1
Fig.2: Backscattered electron image of an area of the specimen.
Fig. 3: Energy dispersive spectrum of spot 1 in Fig. 2. (plagioclase)
Summary of findings: This specimen (Fig. 1) is pretty. The bads are not a potassium feldspar, thus it is not a moonstone but a plagioclase (Figs. 2 and 3). This plagioclase is not that calcium-rich to make it a labradorite, it is likely in the range of andesine-oligoclase, thus it is more sodium-rich. The schiller is due to exsolution of a thin, albite-rich (sodium-rich)film which causes this pretty optical effect.
Malagasy Rainbow Moonstone Gem Facet · Soul Body Gems, August 2024.
Sold as Malagasy Moonstone or Rainbow Moonstone, this Madagascar gemstone tested as labradorite. Malagasy Rainbow Labradorite is the corrected name used here.
Sample: 10622 (number 1). Completed: August 8, 2024.
Finding: Intermediate plagioclase in the labradorite compositional range.
Labradorite behind the market name
The report identifies the faceted stone as labradorite. Its measured density of 2.71 g/cm³ and refractive index of approximately 1.57 agree with that identification. The trade-name moonstone entries lead to the same results so visitors can find the distinction.
Locality: Madagascar, according to Soul Body Gems sourcing notes. The tested gemstone weighs 0.94 carats.
These results are the property of Soul Body Gems, Alexander Falster, and the Maine Mineral & Gem Museum. Any mention requires full acknowledgment.
Understanding the report figures
Use this guide alongside the written findings and the original report transcript. It explains the purpose of each analytical figure and preserves the laboratory’s own figure labels. The interpretations apply to the tested specimen; signals alone do not establish the identity of every similar-looking stone.
Electron microscope image: This view shows small-scale regions selected for analysis. Its brightness contrast helps distinguish regions with different compositions; it is not a photograph of their natural colors. Numbered spots connect this view to the analyses listed in the report.
Laboratory figure caption: Fig. 2: Backscattered electron image of an area of the specimen.
Elemental spectrum: The peaks record characteristic X-ray signals from elements in the analyzed spot or area. This is an analysis of that location, not automatically of the entire specimen. Any mineral identification or uncertainty named in the laboratory caption is retained below.
Laboratory figure caption: Fig. 3: Energy dispersive spectrum of spot 1 in Fig. 2. (plagioclase, labradorite compositional range)
Electron microscope image: This view shows small-scale regions selected for analysis. Its brightness contrast helps distinguish regions with different compositions; it is not a photograph of their natural colors. Numbered spots connect this view to the analyses listed in the report.
Laboratory figure caption: Fig.2: Backscattered electron image of an area of the specimen.
Elemental spectrum: The peaks record characteristic X-ray signals from elements in the analyzed spot or area. This is an analysis of that location, not automatically of the entire specimen. Any mineral identification or uncertainty named in the laboratory caption is retained below.
Laboratory figure caption: Fig. 3: Energy dispersive spectrum of spot 1 in Fig. 2. (plagioclase)
Read the report as text
Analytical Result Report
Sample id: 10622 (number 1)
Submitted by: Soul Body Gems
Date completed: 8-8-2024
Operating conditions: An AMRAY 1830 SEM operated at 25 kV acceleration potential, 24 mm working distance, 0 degrees sample tilt, coated with 250 Å carbon, and also using the attached XRF unit operated at 30 kV.
Fig. 1: Photograph of the specimen. 0.94 ct.
Fig. 2: Backscattered electron image of an area of the specimen.
Fig. 3: Energy dispersive spectrum of spot 1 in Fig. 2. (plagioclase, labradorite compositional range)
Summary of findings: This specimen (Fig. 1) is a beautiful cut stone. Compositionally, it is an intermediate plagioclase, a labradorite (Figs. 2 and 3). The density was measured as 2.71 g/cm3 and the refractive index measured on the table is around 1.57, both are in agreement with labradorite.
Date: August 8, 2024. Signature.
Additional variation: tested bracelet beads
Sample 1104, completed November 1, 2024, examined approximately 4.5 mm beads from a bracelet. These beads are plagioclase rather than potassium feldspar. Unlike the earlier faceted labradorite specimen, the analyst places these beads likely in the andesine–oligoclase compositional range because they contain less calcium.
The report attributes the schiller to a thin, sodium-rich albite film formed through exsolution. The two reports therefore document different plagioclase compositions sold under related moonstone trade names; they should not be treated as identical mineral identifications.
These results are the property of Soul Body Gems, Alexander Falster, and the Maine Mineral & Gem Museum. Any mention requires full acknowledgment.
Read the complete report as text
Analytical Result Report
Sample id: 1104 (blue bead bracelet #6)
Submitted by: Soul Body Gems
Date completed: 11-1-2024
Operating conditions: An AMRAY 1830 SEM operated at 25 kV acceleration potential, 24 mm working distance, 0 degrees sample tilt, coated with 250 Å carbon, and also using the attached XRF unit operated at 30 kV.
A Bruker D2 Phaser X-ray diffractometer was also used and operated under 30kV and 10 mA.
Fig. 1: Photograph of the specimen. Approximately 4.5 mm maximum dimension of the beads.
X 1X 1
X 1
X 1
Fig.2: Backscattered electron image of an area of the specimen.
Fig. 3: Energy dispersive spectrum of spot 1 in Fig. 2. (plagioclase)
Summary of findings: This specimen (Fig. 1) is pretty. The bads are not a potassium feldspar, thus it is not a moonstone but a plagioclase (Figs. 2 and 3). This plagioclase is not that calcium-rich to make it a labradorite, it is likely in the range of andesine-oligoclase, thus it is more sodium-rich. The schiller is due to exsolution of a thin, albite-rich (sodium-rich)film which causes this pretty optical effect.
Malagasy Moonstone · Soul Body Gems, November 2024.
Sold as Malagasy Moonstone or Rainbow Moonstone, this Madagascar gemstone tested as labradorite. Malagasy Rainbow Labradorite is the corrected name used here.
Sample: 10622 (number 1). Completed: August 8, 2024.
Finding: Intermediate plagioclase in the labradorite compositional range.
Labradorite behind the market name
The report identifies the faceted stone as labradorite. Its measured density of 2.71 g/cm³ and refractive index of approximately 1.57 agree with that identification. The trade-name moonstone entries lead to the same results so visitors can find the distinction.
Locality: Madagascar, according to Soul Body Gems sourcing notes. The tested gemstone weighs 0.94 carats.
These results are the property of Soul Body Gems, Alexander Falster, and the Maine Mineral & Gem Museum. Any mention requires full acknowledgment.
Understanding the report figures
Use this guide alongside the written findings and the original report transcript. It explains the purpose of each analytical figure and preserves the laboratory’s own figure labels. The interpretations apply to the tested specimen; signals alone do not establish the identity of every similar-looking stone.
Electron microscope image: This view shows small-scale regions selected for analysis. Its brightness contrast helps distinguish regions with different compositions; it is not a photograph of their natural colors. Numbered spots connect this view to the analyses listed in the report.
Laboratory figure caption: Fig. 2: Backscattered electron image of an area of the specimen.
Elemental spectrum: The peaks record characteristic X-ray signals from elements in the analyzed spot or area. This is an analysis of that location, not automatically of the entire specimen. Any mineral identification or uncertainty named in the laboratory caption is retained below.
Laboratory figure caption: Fig. 3: Energy dispersive spectrum of spot 1 in Fig. 2. (plagioclase, labradorite compositional range)
Electron microscope image: This view shows small-scale regions selected for analysis. Its brightness contrast helps distinguish regions with different compositions; it is not a photograph of their natural colors. Numbered spots connect this view to the analyses listed in the report.
Laboratory figure caption: Fig.2: Backscattered electron image of an area of the specimen.
Elemental spectrum: The peaks record characteristic X-ray signals from elements in the analyzed spot or area. This is an analysis of that location, not automatically of the entire specimen. Any mineral identification or uncertainty named in the laboratory caption is retained below.
Laboratory figure caption: Fig. 3: Energy dispersive spectrum of spot 1 in Fig. 2. (plagioclase)
Read the report as text
Analytical Result Report
Sample id: 10622 (number 1)
Submitted by: Soul Body Gems
Date completed: 8-8-2024
Operating conditions: An AMRAY 1830 SEM operated at 25 kV acceleration potential, 24 mm working distance, 0 degrees sample tilt, coated with 250 Å carbon, and also using the attached XRF unit operated at 30 kV.
Fig. 1: Photograph of the specimen. 0.94 ct.
Fig. 2: Backscattered electron image of an area of the specimen.
Fig. 3: Energy dispersive spectrum of spot 1 in Fig. 2. (plagioclase, labradorite compositional range)
Summary of findings: This specimen (Fig. 1) is a beautiful cut stone. Compositionally, it is an intermediate plagioclase, a labradorite (Figs. 2 and 3). The density was measured as 2.71 g/cm3 and the refractive index measured on the table is around 1.57, both are in agreement with labradorite.
Date: August 8, 2024. Signature.
Additional variation: tested bracelet beads
Sample 1104, completed November 1, 2024, examined approximately 4.5 mm beads from a bracelet. These beads are plagioclase rather than potassium feldspar. Unlike the earlier faceted labradorite specimen, the analyst places these beads likely in the andesine–oligoclase compositional range because they contain less calcium.
The report attributes the schiller to a thin, sodium-rich albite film formed through exsolution. The two reports therefore document different plagioclase compositions sold under related moonstone trade names; they should not be treated as identical mineral identifications.
These results are the property of Soul Body Gems, Alexander Falster, and the Maine Mineral & Gem Museum. Any mention requires full acknowledgment.
Read the complete report as text
Analytical Result Report
Sample id: 1104 (blue bead bracelet #6)
Submitted by: Soul Body Gems
Date completed: 11-1-2024
Operating conditions: An AMRAY 1830 SEM operated at 25 kV acceleration potential, 24 mm working distance, 0 degrees sample tilt, coated with 250 Å carbon, and also using the attached XRF unit operated at 30 kV.
A Bruker D2 Phaser X-ray diffractometer was also used and operated under 30kV and 10 mA.
Fig. 1: Photograph of the specimen. Approximately 4.5 mm maximum dimension of the beads.
X 1X 1
X 1
X 1
Fig.2: Backscattered electron image of an area of the specimen.
Fig. 3: Energy dispersive spectrum of spot 1 in Fig. 2. (plagioclase)
Summary of findings: This specimen (Fig. 1) is pretty. The bads are not a potassium feldspar, thus it is not a moonstone but a plagioclase (Figs. 2 and 3). This plagioclase is not that calcium-rich to make it a labradorite, it is likely in the range of andesine-oligoclase, thus it is more sodium-rich. The schiller is due to exsolution of a thin, albite-rich (sodium-rich)film which causes this pretty optical effect.
Himalayan Quartz with Hematite Roses · Soul Body Gems, January 2024.
A distinctive small batch of Himalayan quartz with dark crystal rosettes, shared by Soul Body Gems for its striking inclusions.
Sample: 10470 (#1). Completed: January 16, 2024.
Finding: Hematite rosettes in quartz. The visually similar mineral ilmenite was excluded by the chemistry.
Hematite rosettes in quartz
The inclusion symmetry and growth hillocks are rhombohedral (trigonal), and close-up photographs show their deep-red color. Chemistry supports hematite rather than ilmenite. Minor manganese, titanium, and vanadium were detected.
The report compares this assemblage with hydrothermal and Alpine-type veins found in mountain ranges including the Himalayas; that geological comparison does not establish a precise mine. “Himalayan Quartz” and the small-batch background come from Soul Body Gems sourcing notes.
These results are the property of Soul Body Gems, Alexander Falster, and the Maine Mineral & Gem Museum. Any mention requires full acknowledgment.
Understanding the report figures
Use this guide alongside the written findings and the original report transcript. It explains the purpose of each analytical figure and preserves the laboratory’s own figure labels. The interpretations apply to the tested specimen; signals alone do not establish the identity of every similar-looking stone.
Electron microscope image: This view shows small-scale regions selected for analysis. Its brightness contrast helps distinguish regions with different compositions; it is not a photograph of their natural colors. Numbered spots connect this view to the analyses listed in the report.
Laboratory figure caption: Fig.2: Backscattered electron image of an area of the specimen.
Elemental spectrum: The peaks record characteristic X-ray signals from elements in the analyzed spot or area. This is an analysis of that location, not automatically of the entire specimen. Any mineral identification or uncertainty named in the laboratory caption is retained below.
Laboratory figure caption: Fig. 3: Energy dispersive spectrum of spot 1 in Fig. 2 (iron oxide)
Elemental spectrum: The peaks record characteristic X-ray signals from elements in the analyzed spot or area. This is an analysis of that location, not automatically of the entire specimen. Any mineral identification or uncertainty named in the laboratory caption is retained below.
Laboratory figure caption: Fig. 4: Energy dispersive spectrum of spot 2 in Fig. 2 (quartz
Read the report as text
Analytical Result Report
Sample id: 10470 (#1)
Submitted by: Soul Body Gems
Date completed: 1-16-2024
Operating conditions: An AMRAY 1830 SEM operated at 25 kV acceleration potential, 24 mm working distance, 0 degrees sample tilt, coated with 250 Å carbon, and also using the attached XRF unit operated at 30 kV.
A BRUKER Titan X-ray fluorescence spectrometer was also used and operated for 30 seconds at 50, 25, and 10 kV.
Fig. 1:  Photograph of the specimen.  30 mm across.With 2 close-up photographs showing black crystal rosettes.
Fig.2: Backscattered electron image of an area of the specimen.
Fig. 3: Energy dispersive spectrum of spot 1 in Fig. 2 (iron oxide)
Fig. 4: Energy dispersive spectrum of spot 2 in Fig. 2 (quartz
Table 1: Trace and minor elements in the iron oxide.
Summary of findings:  This specimen (Fig. 1) is very interesting!  The inclusions are rosettes of hematite, the symmetry as is evident by growth hillocks is rhombohedral (trigonal), the color in this piece is deep red as soon in the close-up photos in Fig. 1, the crystals are thus hematite.  The chemistry is clear about this, (Figs 2 and 3), they are not ilmenite which can look visually identical.  Trace elements (Table 1) are also typical for hematite with only minor amounts oof manganese, titanium and vanadium being detectable.  Material like this is characteristic of some hydrothermal veins and Alpine vein assemblages seen in the Alpes and in other mountain ranges such as the Himalayas.  They also occur in some ore deposits.
Date:    January 16. 2024                      Signature
Table 1: Trace and minor elements in the iron oxide (wt. %)
Sonora Sunrise is a colorful copper-bearing material sourced from Mexico. Laboratory testing documents the minerals in the submitted green-and-reddish tower.
Sample: 1199 (green and reddish tower). Completed: December 21, 2024.
Finding: Brochantite, cuprite, a copper-iron sulfate, alum, and quartz.
Report 1: a copper-rich mineral assemblage
The report identifies brochantite and cuprite, with a copper-iron sulfate tentatively compared with guildite or phillipite, plus alum and quartz. These species suggest oxidizing conditions near a copper-bearing sulfide vein or deposit. The specific copper-iron sulfate is not conclusively assigned to one species.
Locality: Mexico, according to Soul Body Gems sourcing notes. The tested tower measures approximately 4.5 cm.
These results are the property of Soul Body Gems, Alexander Falster, and the Maine Mineral & Gem Museum. Any mention requires full acknowledgment.
Understanding the report figures
Use this guide alongside the written findings and the original report transcript. It explains the purpose of each analytical figure and preserves the laboratory’s own figure labels. The interpretations apply to the tested specimen; signals alone do not establish the identity of every similar-looking stone.
Electron microscope image: This view shows small-scale regions selected for analysis. Its brightness contrast helps distinguish regions with different compositions; it is not a photograph of their natural colors. Numbered spots connect this view to the analyses listed in the report.
Laboratory figure caption: Fig.2: Backscattered electron image of an area of the specimen.
Elemental spectrum: The peaks record characteristic X-ray signals from elements in the analyzed spot or area. This is an analysis of that location, not automatically of the entire specimen. Any mineral identification or uncertainty named in the laboratory caption is retained below.
Laboratory figure caption: Fig. 3: Energy dispersive spectrum of spot 1 in Fig. 2. (copper sulfate species)
Elemental spectrum: The peaks record characteristic X-ray signals from elements in the analyzed spot or area. This is an analysis of that location, not automatically of the entire specimen. Any mineral identification or uncertainty named in the laboratory caption is retained below.
Laboratory figure caption: Fig. 4: Energy dispersive spectrum of spot 2 in Fig. 2 (copper oxide, likely cuprite).
Elemental spectrum: The peaks record characteristic X-ray signals from elements in the analyzed spot or area. This is an analysis of that location, not automatically of the entire specimen. Any mineral identification or uncertainty named in the laboratory caption is retained below.
Laboratory figure caption: Fig. 5: Energy dispersive spectrum of spot 5 in Fig. 2 (copper iron sulfate species).
Elemental spectrum: The peaks record characteristic X-ray signals from elements in the analyzed spot or area. This is an analysis of that location, not automatically of the entire specimen. Any mineral identification or uncertainty named in the laboratory caption is retained below.
Laboratory figure caption: Fig. 6: Energy dispersive spectrum of spot 6 in Fig. 2 (alum).
Elemental spectrum: The peaks record characteristic X-ray signals from elements in the analyzed spot or area. This is an analysis of that location, not automatically of the entire specimen. Any mineral identification or uncertainty named in the laboratory caption is retained below.
Laboratory figure caption: Fig. 7: Energy dispersive spectrum of spot 7 in Fig. 2 (quartz).
Element map: This map shows where the named elements occur within the analyzed area. Its colors represent the laboratory’s selected element channels, rather than the specimen’s visible colors. The caption below preserves any color key or distribution noted by the laboratory.
Laboratory figure caption: Fig. 8: X-ray map of the area shown in Fig. 2. Iron: green, copper: blue, silicon: red.
Elemental spectrum: The peaks record characteristic X-ray signals from elements in the analyzed spot or area. This is an analysis of that location, not automatically of the entire specimen. Any mineral identification or uncertainty named in the laboratory caption is retained below.
Laboratory figure caption: Fig. 3: Energy dispersive spectrum of spot 1 in Fig. 2. (kaolinite plus copper mineraliization)
Elemental spectrum: The peaks record characteristic X-ray signals from elements in the analyzed spot or area. This is an analysis of that location, not automatically of the entire specimen. Any mineral identification or uncertainty named in the laboratory caption is retained below.
Laboratory figure caption: Fig. 5: Energy dispersive spectrum of spot 3 in Fig. 2 (quartz).
Elemental spectrum: The peaks record characteristic X-ray signals from elements in the analyzed spot or area. This is an analysis of that location, not automatically of the entire specimen. Any mineral identification or uncertainty named in the laboratory caption is retained below.
Laboratory figure caption: Fig. 6: Energy dispersive spectrum of spot 4 in Fig. 2 (iron copper oxide mix).
Elemental spectrum: The peaks record characteristic X-ray signals from elements in the analyzed spot or area. This is an analysis of that location, not automatically of the entire specimen. Any mineral identification or uncertainty named in the laboratory caption is retained below.
Laboratory figure caption: Fig. 7: Energy dispersive spectrum of spot 5 in Fig. 2 (possible iron-bearing chrysocolla).
Electron microscope image: This view shows small-scale regions selected for analysis. Its brightness contrast helps distinguish regions with different compositions; it is not a photograph of their natural colors. Numbered spots connect this view to the analyses listed in the report.
Laboratory figure caption: Fig.8: Backscattered electron image of another area of the specimen.
Elemental spectrum: The peaks record characteristic X-ray signals from elements in the analyzed spot or area. This is an analysis of that location, not automatically of the entire specimen. Any mineral identification or uncertainty named in the laboratory caption is retained below.
Laboratory figure caption: Fig. 9: Energy dispersive spectrum of spot 1 in Fig. 8 (copper oxide possible with some atacamite).
Elemental spectrum: The peaks record characteristic X-ray signals from elements in the analyzed spot or area. This is an analysis of that location, not automatically of the entire specimen. Any mineral identification or uncertainty named in the laboratory caption is retained below.
Laboratory figure caption: Fig. 10: Energy dispersive spectrum of spot 3 in Fig. 8 (iron oxide such as goethite/hematite with minor copper content).
Elemental spectrum: The peaks record characteristic X-ray signals from elements in the analyzed spot or area. This is an analysis of that location, not automatically of the entire specimen. Any mineral identification or uncertainty named in the laboratory caption is retained below.
Laboratory figure caption: Fig. 11: Energy dispersive spectrum of spot 4 in Fig. 8 (copper oxide-cuprite, possible with some native copper).
Electron microscope image: This view shows small-scale regions selected for analysis. Its brightness contrast helps distinguish regions with different compositions; it is not a photograph of their natural colors. Numbered spots connect this view to the analyses listed in the report.
Laboratory figure caption: Fig.12: Backscattered electron image of another area of the specimen.
Elemental spectrum: The peaks record characteristic X-ray signals from elements in the analyzed spot or area. This is an analysis of that location, not automatically of the entire specimen. Any mineral identification or uncertainty named in the laboratory caption is retained below.
Laboratory figure caption: Fig. 13: Energy dispersive spectrum of spot 2 in Fig. 12 (copper iron sulphate species).
Electron microscope image: This view shows small-scale regions selected for analysis. Its brightness contrast helps distinguish regions with different compositions; it is not a photograph of their natural colors. Numbered spots connect this view to the analyses listed in the report.
Laboratory figure caption: Fig.14: Backscattered electron image of another area of the specimen.
Elemental spectrum: The peaks record characteristic X-ray signals from elements in the analyzed spot or area. This is an analysis of that location, not automatically of the entire specimen. Any mineral identification or uncertainty named in the laboratory caption is retained below.
Laboratory figure caption: Fig. 15: Energy dispersive spectrum of spot 3 in Fig. 14 (alum).
Read the December report as text
Analytical Result Report
Sample id: 1199 (green and reddish tower)
Submitted by: Soul Body Gems
Date completed: 12-21-2024
Operating conditions: An AMRAY 1830 SEM operated at 25 kV acceleration potential, 24 mm working distance, 0 degrees sample tilt, coated with 250 Å carbon, and also using the attached XRF unit operated at 30 kV.
Fig. 1:  Photograph of the specimens.  4.5 cm maximum dimensions
Fig.2: Backscattered electron image of an area of the specimen.

Fig. 3: Energy dispersive spectrum of spot 1 in Fig. 2. (copper sulfate species)
Fig. 4: Energy dispersive spectrum of spot 2 in Fig. 2 (copper oxide, likely cuprite).
Fig. 5: Energy dispersive spectrum of spot 5 in Fig. 2 (copper iron sulfate species).
Fig. 6: Energy dispersive spectrum of spot 6 in Fig. 2 (alum).
Fig. 7: Energy dispersive spectrum of spot 7 in Fig. 2 (quartz).
Fig. 8: X-ray map of the area shown in Fig. 2.  Iron: green, copper: blue, silicon: red.
Summary of findings:  This specimen (Fig. 1) is colorful with brochantite (Figs. 2 and 3), cuprite (Figs. 2 and 4), a copper-iron sulfate for example guildite or phillipite (Figs. 2 and 5), alum (Figs, 2 and 6), and quartz (Figs. 2 and 7).  The presence of alum is interesting.  All species indicate oxidizing conditions in proximity to a copper-bearing sulfide vein or deposit. Fig. 8 shows the distribution of the major elements in the area of the sample investigated.
Date:    12-21-2024                      Signature
Report 2: a second Sonora Sunrise tower
Sample: 1205 (#1 green and reddish tower). Completed: January 10, 2025.
Finding: A related but more complex copper-bearing assemblage, with several mineral assignments retained as tentative.
This second report describes copper-bearing kaolinite, possibly with malachite; copper oxide likely cuprite; quartz; iron-rich copper silicate likely chrysocolla; iron oxides such as hematite or goethite; and possible atacamite and native copper. It also notes iron-copper sulfate, possibly iron-rich brochantite, and alum.
The names preceded by “likely,” “possibly,” or “such as” reflect the report's uncertainty and are not presented here as definitive identifications. Both Sonora Sunrise specimens are recorded by Soul Body Gems as Mexican material.
These results are the property of Soul Body Gems, Alexander Falster, and the Maine Mineral & Gem Museum. Any mention requires full acknowledgment.
Read the January report as text
Analytical Result Report
Sample id: 1205 (#1green and reddish tower)
Submitted by: Soul Body Gems
Date completed: 1-10-2025
Operating conditions: An AMRAY 1830 SEM operated at 25 kV acceleration potential, 24 mm working distance, 0 degrees sample tilt, coated with 250 Å carbon, and also using the attached XRF unit operated at 30 kV.
Fig. 1:  Photograph of the specimens.  4.5 cm maximum dimensions
Fig.2: Backscattered electron image of an area of the specimen.

Fig. 3: Energy dispersive spectrum of spot 1 in Fig. 2. (kaolinite plus copper mineraliization)
Fig. 4: Energy dispersive spectrum of spot 2 in Fig. 2 (copper oxide, likely cuprite).
Fig. 5: Energy dispersive spectrum of spot 3 in Fig. 2 (quartz).
Fig. 6: Energy dispersive spectrum of spot 4 in Fig. 2 (iron copper oxide mix).
Fig. 7: Energy dispersive spectrum of spot 5 in Fig. 2 (possible iron-bearing chrysocolla).
Fig.8: Backscattered electron image of another area of the specimen.
Fig. 9: Energy dispersive spectrum of spot 1 in Fig. 8 (copper oxide possible with some atacamite).
Fig. 10: Energy dispersive spectrum of spot 3 in Fig. 8 (iron oxide such as goethite/hematite with minor copper content).
Fig. 11: Energy dispersive spectrum of spot 4 in Fig. 8 (copper oxide-cuprite, possible with some native copper).
Fig.12: Backscattered electron image of another area of the specimen.
Fig. 13: Energy dispersive spectrum of spot 2 in Fig. 12 (copper iron sulphate species).
Fig.14: Backscattered electron image of another area of the specimen.
Fig. 15: Energy dispersive spectrum of spot 3 in Fig. 14 (alum).
Summary of findings:  This specimen (Fig. 1) is similar to the earlier specimen investigated.  Kaolinite with copper content, possibly present as malachite (Figs. 2 and 3), a copper oxide, likely cuprite (Figs. 2 and 4), quartz (Figs. 2 and 5), and iron-rich copper silicate, likely chrysocolla, more copper oxide, likely cuprite possibly associated with atacamite (Figs. 8 and 9) , then a more iron oxides, such as hematite/goethite (Figs. 8 and 10) , cuprite possibly associated with a little native copper (Figs. 8 and 11), more iron copper sulfate, possibly an iron-rich brochantite (Figs. 12 and 13) and alum (Figs. 14 and 15.
Date:    1-10-2025                      Signature
Sonora Sunrise SS Pendants · Soul Body Gems, December 2024.
Sold as “Red Amazonite,” this specimen tested as microcline perthite. The report recommends the name perthitic microcline.
Sample: 10612 (‘red amazonite’). Header date: July 2, 2024. Signature date: July 21, 2024.
Finding: Bulk microcline with exsolution lamellae of albite.
Perthitic microcline rather than red amazonite
The report identifies the characteristic intergrowth of potassium feldspar (microcline) and albite. It recommends “perthitic microcline,” rather than “red amazonite.”
Amazonite is the green-to-blue-green variety of pegmatitic microcline. The report explains that lead and structural water are both involved in developing that color. This specimen contains approximately 400 ppm lead, but lead alone does not make a non-green microcline amazonite.
These results are the property of Soul Body Gems, Alexander Falster, and the Maine Mineral & Gem Museum. Any mention requires full acknowledgment.
Understanding the report figures
Use this guide alongside the written findings and the original report transcript. It explains the purpose of each analytical figure and preserves the laboratory’s own figure labels. The interpretations apply to the tested specimen; signals alone do not establish the identity of every similar-looking stone.
Electron microscope image: This view shows small-scale regions selected for analysis. Its brightness contrast helps distinguish regions with different compositions; it is not a photograph of their natural colors. Numbered spots connect this view to the analyses listed in the report.
Laboratory figure caption: Fig. 2: Backscattered electron image of an area of one of the broken beads.
Elemental spectrum: The peaks record characteristic X-ray signals from elements in the analyzed spot or area. This is an analysis of that location, not automatically of the entire specimen. Any mineral identification or uncertainty named in the laboratory caption is retained below.
Laboratory figure caption: Fig. 3: Energy dispersive spectrum of spot 1 in Fig. 2. (potassium feldspar, microcline)
Elemental spectrum: The peaks record characteristic X-ray signals from elements in the analyzed spot or area. This is an analysis of that location, not automatically of the entire specimen. Any mineral identification or uncertainty named in the laboratory caption is retained below.
Laboratory figure caption: Fig. 3: Energy dispersive spectrum of spot 2 in Fig. 2. (albite)
Element map: This map shows where the named elements occur within the analyzed area. Its colors represent the laboratory’s selected element channels, rather than the specimen’s visible colors. The caption below preserves any color key or distribution noted by the laboratory.
Laboratory figure caption: Fig. 4: X-ray maps of the area shown in Fig. 2. potassium: purple, sodium: golden.
Read the report as text
Analytical Result Report
Sample id: 10612 (‘red amazonite’)
Submitted by: Soul Body Gems
Date completed: 7-2-2024
Operating conditions: An AMRAY 1830 SEM operated at 25 kV acceleration potential, 24 mm working distance, 0 degrees sample tilt, coated with 250 Å carbon, and also using the attached XRF unit operated at 30 kV.
Fig. 1: Photograph of the specimen. 60 mm diameter.
Fig. 2: Backscattered electron image of an area of one of the broken beads.
Fig. 3: Energy dispersive spectrum of spot 1 in Fig. 2. (potassium feldspar, microcline)
Fig. 3: Energy dispersive spectrum of spot 2 in Fig. 2. (albite)
Fig. 4: X-ray maps of the area shown in Fig. 2. potassium: purple, sodium: golden.
Summary of findings: This specimen (Fig. 1) is a typical microcline perthite. Microcline is the bulk (Figs. 2 and 3) with exsolution lamellae of albite (Figs. 2 and 4). This is typical for plutonic potassium feldspars, especially in pegmatites. This should be called perthitic microcline and not red amazonite. Amazonite is the green to blue-green variant of pegmatitic microcline that owes its color to the effects of lead and water. Many non-green/green-blue microclines have quantifiable lead but the corresponding amount of structural water is also needed for green to blue-green color to develop. Incidentally, this specimen does contain about 400 ppm lead.
Date: July 21, 2024. Signature.
Transcription note: The duplicate Figure 3 numbering and differing header and signature dates are retained from the report.
Further reading: what gives amazonite its color?
A 2004 research abstract in Rocks & Minerals, “The Cooperative Effects of Lead and Structural Water on Color Intensity of Microcline, Var. Amazonite,” by P. E. Rein, W. B. Simmons, A. U. Falster, M. A. Wise, and J. W. Nizamoff, investigates why lead content alone does not explain amazonite’s green-to-blue color. The authors examined microcline from nineteen localities and considered structural water alongside trace elements. Their discussion also connects color development with radiation-related changes in lead.
Why this matters here: Detecting lead in feldspar does not, by itself, establish that it is amazonite. This research provides background for the distinction between green-to-blue amazonite and the perthitic microcline sold as “Red Amazonite.” It is supporting literature, not an additional test of our specimen.
Reference: Rein and colleagues (2004), Rocks & Minerals, September/October, pp. 342–343.
Sold as “Red Amazonite,” this specimen tested as microcline perthite. The report recommends the name perthitic microcline.
Sample: 10612 (‘red amazonite’). Header date: July 2, 2024. Signature date: July 21, 2024.
Finding: Bulk microcline with exsolution lamellae of albite.
Perthitic microcline rather than red amazonite
The report identifies the characteristic intergrowth of potassium feldspar (microcline) and albite. It recommends “perthitic microcline,” rather than “red amazonite.”
Amazonite is the green-to-blue-green variety of pegmatitic microcline. The report explains that lead and structural water are both involved in developing that color. This specimen contains approximately 400 ppm lead, but lead alone does not make a non-green microcline amazonite.
These results are the property of Soul Body Gems, Alexander Falster, and the Maine Mineral & Gem Museum. Any mention requires full acknowledgment.
Understanding the report figures
Use this guide alongside the written findings and the original report transcript. It explains the purpose of each analytical figure and preserves the laboratory’s own figure labels. The interpretations apply to the tested specimen; signals alone do not establish the identity of every similar-looking stone.
Electron microscope image: This view shows small-scale regions selected for analysis. Its brightness contrast helps distinguish regions with different compositions; it is not a photograph of their natural colors. Numbered spots connect this view to the analyses listed in the report.
Laboratory figure caption: Fig. 2: Backscattered electron image of an area of one of the broken beads.
Elemental spectrum: The peaks record characteristic X-ray signals from elements in the analyzed spot or area. This is an analysis of that location, not automatically of the entire specimen. Any mineral identification or uncertainty named in the laboratory caption is retained below.
Laboratory figure caption: Fig. 3: Energy dispersive spectrum of spot 1 in Fig. 2. (potassium feldspar, microcline)
Elemental spectrum: The peaks record characteristic X-ray signals from elements in the analyzed spot or area. This is an analysis of that location, not automatically of the entire specimen. Any mineral identification or uncertainty named in the laboratory caption is retained below.
Laboratory figure caption: Fig. 3: Energy dispersive spectrum of spot 2 in Fig. 2. (albite)
Element map: This map shows where the named elements occur within the analyzed area. Its colors represent the laboratory’s selected element channels, rather than the specimen’s visible colors. The caption below preserves any color key or distribution noted by the laboratory.
Laboratory figure caption: Fig. 4: X-ray maps of the area shown in Fig. 2. potassium: purple, sodium: golden.
Read the report as text
Analytical Result Report
Sample id: 10612 (‘red amazonite’)
Submitted by: Soul Body Gems
Date completed: 7-2-2024
Operating conditions: An AMRAY 1830 SEM operated at 25 kV acceleration potential, 24 mm working distance, 0 degrees sample tilt, coated with 250 Å carbon, and also using the attached XRF unit operated at 30 kV.
Fig. 1: Photograph of the specimen. 60 mm diameter.
Fig. 2: Backscattered electron image of an area of one of the broken beads.
Fig. 3: Energy dispersive spectrum of spot 1 in Fig. 2. (potassium feldspar, microcline)
Fig. 3: Energy dispersive spectrum of spot 2 in Fig. 2. (albite)
Fig. 4: X-ray maps of the area shown in Fig. 2. potassium: purple, sodium: golden.
Summary of findings: This specimen (Fig. 1) is a typical microcline perthite. Microcline is the bulk (Figs. 2 and 3) with exsolution lamellae of albite (Figs. 2 and 4). This is typical for plutonic potassium feldspars, especially in pegmatites. This should be called perthitic microcline and not red amazonite. Amazonite is the green to blue-green variant of pegmatitic microcline that owes its color to the effects of lead and water. Many non-green/green-blue microclines have quantifiable lead but the corresponding amount of structural water is also needed for green to blue-green color to develop. Incidentally, this specimen does contain about 400 ppm lead.
Date: July 21, 2024. Signature.
Transcription note: The duplicate Figure 3 numbering and differing header and signature dates are retained from the report.
Further reading: what gives amazonite its color?
A 2004 research abstract in Rocks & Minerals, “The Cooperative Effects of Lead and Structural Water on Color Intensity of Microcline, Var. Amazonite,” by P. E. Rein, W. B. Simmons, A. U. Falster, M. A. Wise, and J. W. Nizamoff, investigates why lead content alone does not explain amazonite’s green-to-blue color. The authors examined microcline from nineteen localities and considered structural water alongside trace elements. Their discussion also connects color development with radiation-related changes in lead.
Why this matters here: Detecting lead in feldspar does not, by itself, establish that it is amazonite. This research provides background for the distinction between green-to-blue amazonite and the perthitic microcline sold as “Red Amazonite.” It is supporting literature, not an additional test of our specimen.
Reference: Rein and colleagues (2004), Rocks & Minerals, September/October, pp. 342–343.
Bright blue color alone does not make a tourmaline Paraíba. None of the tourmalines in this tested lot qualified as Paraíba-type cuprian elbaite.
Sample 1107 (Paraiba lot) · November 8, 2024.
Color is not enough
Paraíba-type tourmaline requires the appropriate color and chemistry, with copper contributing to its color. A blue tourmaline without copper cannot qualify. Small traces of copper alone also do not establish the classification.
The report found high iron and an essential lack of copper in the tested tourmalines. A few specimens yielded low copper concentrations, but their accompanying iron was anomalously high for cuprian elbaite. The laboratory identified the tourmaline portion as common blue elbaite of the elbaite–schorl series.
A mixed lot
The report lists 51% elbaite–schorl, 39% magnesium aluminum silicate, 9% calcium aluminum silicate, and 1% apatite among the investigated specimens. These are the reported proportions of species in the lot, not the composition of a single tourmaline. The two unresolved silicate groups would require further X-ray diffraction work for specific identification.
These results are the property of Soul Body Gems, Alexander Falster, and the Maine Mineral & Gem Museum. Any mention requires full acknowledgment.
Understanding the report figures
Use this guide alongside the written findings and the original report transcript. It explains the purpose of each analytical figure and preserves the laboratory’s own figure labels. The interpretations apply to the tested specimen; signals alone do not establish the identity of every similar-looking stone.
Electron microscope image: This view shows small-scale regions selected for analysis. Its brightness contrast helps distinguish regions with different compositions; it is not a photograph of their natural colors. Numbered spots connect this view to the analyses listed in the report.
Laboratory figure caption: Fig.2: Backscattered electron image of an example of each set of stones.
Elemental spectrum: The peaks record characteristic X-ray signals from elements in the analyzed spot or area. This is an analysis of that location, not automatically of the entire specimen. Any mineral identification or uncertainty named in the laboratory caption is retained below.
Laboratory figure caption: Fig. 3: Energy dispersive spectra the four minerals found during the investigation. Top row left: tourmaline of the schorl-elbaite series, top row right: a high-alumnum magnesium silicate, appears to be something like cordierite, sapphrine, kornerupine or grandidierite from the composition. Bottom row left: a calcium aluminum silicate, possible in the zoisite group. Bottom row right: apatite. Percentages for the species:
Read the report as text
Analytical Result Report
Sample id: 1107 (Paraiba lot)
Submitted by: Soul Body Gems
Date completed: 11-8-2024
Operating conditions: An AMRAY 1830 SEM operated at 25 kV acceleration potential, 24 mm working distance, 0 degrees sample tilt, coated with 250 Å carbon, and also using the attached XRF unit operated at 30 kV.
Fig. 1:  Photograph of the specimen lot.  Reference numbers were given to each box.  Hose stones analyzed are marked with an ‘x’ on the outside.
Fig.2: Backscattered electron image of an example of each set of stones.
Fig. 3: Energy dispersive spectra the four minerals found during the investigation.  Top row left: tourmaline of the schorl-elbaite series, top row right: a high-alumnum magnesium silicate, appears to be something like cordierite, sapphrine, kornerupine or grandidierite from the composition.
Bottom row left: a calcium aluminum silicate, possible in the zoisite group.  Bottom row right: apatite.
Percentages for the species:
Elbaite-schorl: 51 %
Magnesium aluminum silicate: 39 %
Calcium aluminum silicate: 9 %
Apatite: 1 %
Summary of findings:  These specimens are 51 % elbaite-schorl series, 39 % Magnesium aluminum silicate, 9 % Calcium aluminum silicate and 1 % Apatite.  Additional data are in the Excel speadsheet.  None of the tourmalines are what is considered to be Paraiba-type cuprian elbaite.  Cuprian elbaites are notably very low in iron content, from nondetectable to a few thousand ppm.  The copper content is usually above 0.26 wt. % and can go over 3 wt. % in terms of cupper oxide.  Manganese is typically present in similar amounts.  The high concentration of iron in these stones and  essential lack of copper makes these common blue elbaite (elbaite-schorl).  A few specimens yielded some low copper concentrations but the accompanying iron content was anomalously high for cuprian elbaite.
The calcium aluminum silicate and the magnesium aluminum silicates would require sacrificing a small stone to be used in X-ray diffraction study.
Date:    11-8-2024                      Signature
Papaya Quartz is a trade name for this material, which tested as natural chalcedony with hematite—essentially carnelian.
Sample 1525 · September 29, 2025. Origin: Brazil; a distinctive find from 2006, according to our sourcing history.
What the testing found
The laboratory identified natural chalcedony with hematite content reported as 0.15–0.9 wt. %. Its summary describes the specimen as essentially carnelian. The commercial name Papaya Quartz does not identify a separate mineral species.
This page concerns the Brazilian material from the 2006 find in our collection. The analytical report establishes the tested specimen’s composition; its locality and discovery history come from our sourcing records.
These results are the property of Soul Body Gems, Alexander Falster, and the Maine Mineral & Gem Museum. Any mention requires full acknowledgment.
Understanding the report figures
Use this guide alongside the written findings and the original report transcript. It explains the purpose of each analytical figure and preserves the laboratory’s own figure labels. The interpretations apply to the tested specimen; signals alone do not establish the identity of every similar-looking stone.
Electron microscope image: This view shows small-scale regions selected for analysis. Its brightness contrast helps distinguish regions with different compositions; it is not a photograph of their natural colors. Numbered spots connect this view to the analyses listed in the report.
Laboratory figure caption: Fig.2: Backscattered electron image of an area of the specimen in Fig. 1.
Elemental spectrum: The peaks record characteristic X-ray signals from elements in the analyzed spot or area. This is an analysis of that location, not automatically of the entire specimen. Any mineral identification or uncertainty named in the laboratory caption is retained below.
Laboratory figure caption: Fig. 3: Energy dispersive spectrum of spot 1 in Fig. 2. (quartz, minor iron content, hematite)
Elemental spectrum: The peaks record characteristic X-ray signals from elements in the analyzed spot or area. This is an analysis of that location, not automatically of the entire specimen. Any mineral identification or uncertainty named in the laboratory caption is retained below.
Laboratory figure caption: Fig. 4: Energy dispersive spectrum of spot 2 in Fig. 2. (quartz with minor iron content, hematite)
Read the report as text
Analytical Result Report
Sample id: 1525 (# papaya quartz)
Submitted by: Soul Body Gems
Date completed: 9-29-2025
Operating conditions: An AMRAY 1830 SEM operated at 25 kV acceleration potential, 24 mm working distance, 0 degrees sample tilt, coated with 250 Å carbon, and also using the attached XRF unit operated at 30 kV.

Fig. 1:  Photograph of the specimens.  6 cm maximum dimension.

Fig.2: Backscattered electron image of an area of the specimen in Fig. 1.
Fig. 3: Energy dispersive spectrum of spot 1 in Fig. 2. (quartz, minor iron content, hematite)
Fig. 4: Energy dispersive spectrum of spot 2 in Fig. 2. (quartz with minor iron content, hematite)
Summary of findings:  This is a natural sample, chalcedony with some hematite content from 0.15-0.9 wt. % , essentially a carnelian.
Date:    9-29-2025                      Signature
This sphere sold as Garnet in Diopside showed epoxy with visible bubbles. The laboratory concluded that it appears assembled, or at least heavily reinforced with epoxy.
Sample 10670 (other sphere) · August 21, 2024. Sphere approximately 4.5 cm.
Evidence of epoxy and assembly
Microscopy revealed bubbles in epoxy between mineral grains. Elemental maps also showed carbon-rich material in these spaces. The fragmented appearance of the grains was considered abnormal for an intact natural rock.
The report identifies a garnet-group species, a magnesium-rich pyribole possibly enstatite, another pyribole with a more diopsidic composition, and possibly a serpentine-group species. These tentative identifications are retained rather than treating every component as confirmed diopside.
The garnet also contains quartz inclusions that may indicate a different geological environment from the magnesium-rich minerals. This tested sphere should not be represented as an untouched natural rock: the report supports assembly or substantial epoxy reinforcement.
These results are the property of Soul Body Gems, Alexander Falster, and the Maine Mineral & Gem Museum. Any mention requires full acknowledgment.
Understanding the report figures
Use this guide alongside the written findings and the original report transcript. It explains the purpose of each analytical figure and preserves the laboratory’s own figure labels. The interpretations apply to the tested specimen; signals alone do not establish the identity of every similar-looking stone.
Electron microscope image: This view shows small-scale regions selected for analysis. Its brightness contrast helps distinguish regions with different compositions; it is not a photograph of their natural colors. Numbered spots connect this view to the analyses listed in the report.
Laboratory figure caption: Fig.2: Backscattered electron image of an area of the specimen.
Elemental spectrum: The peaks record characteristic X-ray signals from elements in the analyzed spot or area. This is an analysis of that location, not automatically of the entire specimen. Any mineral identification or uncertainty named in the laboratory caption is retained below.
Laboratory figure caption: Fig. 3: Energy dispersive spectrum of spot 1 in Fig. 2 (garnet group).
Elemental spectrum: The peaks record characteristic X-ray signals from elements in the analyzed spot or area. This is an analysis of that location, not automatically of the entire specimen. Any mineral identification or uncertainty named in the laboratory caption is retained below.
Laboratory figure caption: Fig. 4: Energy dispersive spectrum of spot 2 in Fig. 2 (likely a magnesium-dominant pyribole)
Elemental spectrum: The peaks record characteristic X-ray signals from elements in the analyzed spot or area. This is an analysis of that location, not automatically of the entire specimen. Any mineral identification or uncertainty named in the laboratory caption is retained below.
Laboratory figure caption: Fig. 5: Energy dispersive spectrum of spot 3 in Fig. 2 (pyribole, poss. diopside)
Elemental spectrum: The peaks record characteristic X-ray signals from elements in the analyzed spot or area. This is an analysis of that location, not automatically of the entire specimen. Any mineral identification or uncertainty named in the laboratory caption is retained below.
Laboratory figure caption: Fig. 6: Energy dispersive spectrum of spot 3 in Fig. 2 (poss. Serpentine group)
Elemental spectrum: The peaks record characteristic X-ray signals from elements in the analyzed spot or area. This is an analysis of that location, not automatically of the entire specimen. Any mineral identification or uncertainty named in the laboratory caption is retained below.
Laboratory figure caption: Fig. 7: Energy dispersive spectrum of spot 3 in Fig. 2 (poss. epoxy)
Element map: This map shows where the named elements occur within the analyzed area. Its colors represent the laboratory’s selected element channels, rather than the specimen’s visible colors. The caption below preserves any color key or distribution noted by the laboratory.
Laboratory figure caption: Fig. 9: X-ray map of the area shown in Fig. 2: left: magnesium: red,calcium light blue, iron: green. Right: carbon: yellow.
Read the report as text
Analytical Result Report
Sample id: 10670 (other sphere)
Submitted by: Soul Body Gems
Date completed: 8-21-2024
Operating conditions: An AMRAY 1830 SEM operated at 25 kV acceleration potential, 24 mm working distance, 0 degrees sample tilt, coated with 250 Å carbon, and also using the attached XRF unit operated at 30 kV.
 Fig. 1:  Photograph of the specimen.  The sphere is about 4.5 cm in maximum dimension.
Fig.2: Backscattered electron image of an area of the specimen.
Fig. 3: Energy dispersive spectrum of spot 1 in Fig. 2 (garnet group).
Fig. 4: Energy dispersive spectrum of spot 2 in Fig. 2 (likely a magnesium-dominant pyribole)
Fig. 5: Energy dispersive spectrum of spot 3 in Fig. 2 (pyribole, poss. diopside)
Fig. 6: Energy dispersive spectrum of spot 3 in Fig. 2 (poss. Serpentine group)
Fig. 7: Energy dispersive spectrum of spot 3 in Fig. 2 (poss. epoxy)
Fig. 8: Cllose-up of the area shown in Fig. 2.  Note bubbles in epoxy.
Fig. 9: X-ray map of the area shown in Fig. 2: left: magnesium: red,calcium light blue, iron: green.  Right: carbon: yellow.
Summary of findings:  This specimen (Fig. 1) is peculiar.  The components consist of a garnet group species (Figs. 2 and 3), a high magnesium pyribole, possible enstatite (Figs. 2 and 4), a pyribole with a more diopsidic composition (Figs. 2 and 5), possibly a serpentine group species (Figs. 2 and 6), and some high carbon material between the grains (Figs. 2 and 7.  A close-up image (Fig. 8) shows clearly bubbles in an epoxy material.  X-ray maps shown in Fig 9 show the distribution of the common elements magnesium, calcium and iron as well as a carbon map.  It appears the material is assembled or  at least heavily reinforced with  an epoxy material.  The fractured appearance of the mineral grains also does not look normal for a natural rock, it appears all fragmental.  The garnet contains some inclusions of quartz, the jagged patches in the upper part, it could indicate a different environment than the other magnesium-rich minerals.
Date:    August 21, 2024                      Signature
This quartz specimen contains an unusual subsurface layer of cerium-rich bastnäsite, with iron-bearing kaolinite and/or a chlorite-group mineral.
Sample 10514 (recent package #2) · March 23, 2024. Specimen approximately 38 mm.
An unexpected inclusion assemblage
The laboratory found quartz with a layer of bastnäsite beneath its surface. High cerium supports the identification bastnäsite-(Ce). X-ray mapping showed a correlation between carbon and cerium.
The accompanying material was interpreted as iron-bearing kaolinite or a chlorite-group species; the researcher leaned toward both being present. The report suggests a possible Alpine-type hydrothermal vein origin, rather than confirming that geological setting.
Himalayan Quartz is the supplied provenance name for this piece. The report identifies its mineral constituents but does not independently establish geographic origin.
These results are the property of Soul Body Gems, Alexander Falster, and the Maine Mineral & Gem Museum. Any mention requires full acknowledgment.
Understanding the report figures
Use this guide alongside the written findings and the original report transcript. It explains the purpose of each analytical figure and preserves the laboratory’s own figure labels. The interpretations apply to the tested specimen; signals alone do not establish the identity of every similar-looking stone.
Electron microscope image: This view shows small-scale regions selected for analysis. Its brightness contrast helps distinguish regions with different compositions; it is not a photograph of their natural colors. Numbered spots connect this view to the analyses listed in the report.
Laboratory figure caption: Fig.2: Backscattered electron image of an area of the specimen.
Elemental spectrum: The peaks record characteristic X-ray signals from elements in the analyzed spot or area. This is an analysis of that location, not automatically of the entire specimen. Any mineral identification or uncertainty named in the laboratory caption is retained below.
Laboratory figure caption: Fig. 3: Energy dispersive spectrum of spot 1 in Fig. 2 (bastnäsite group with some quartz interference)
Elemental spectrum: The peaks record characteristic X-ray signals from elements in the analyzed spot or area. This is an analysis of that location, not automatically of the entire specimen. Any mineral identification or uncertainty named in the laboratory caption is retained below.
Laboratory figure caption: Fig. 4: Energy dispersive spectrum of spot 2 in Fig. 2 (likely an iron-bearing kaolinite or a chlorite group species,see overlay)
Elemental spectrum: The peaks record characteristic X-ray signals from elements in the analyzed spot or area. This is an analysis of that location, not automatically of the entire specimen. Any mineral identification or uncertainty named in the laboratory caption is retained below.
Laboratory figure caption: Fig. 5: Energy dispersive spectrum of spot 3 in Fig. 2 (quartz)
Element map: This map shows where the named elements occur within the analyzed area. Its colors represent the laboratory’s selected element channels, rather than the specimen’s visible colors. The caption below preserves any color key or distribution noted by the laboratory.
Laboratory figure caption: Fig. 6: X-ray map of the area shown in Fig. 2. Silicon: yellow, cerium: blue, carbon: red.
Read the report as text
Analytical Result Report
Sample id: 10514 (recent package #2)
Submitted by: Soul Body Gems
Date completed: 3-23-2024
Operating conditions: An AMRAY 1830 SEM operated at 25 kV acceleration potential, 24 mm working distance, 0 degrees sample tilt, coated with 250 Å carbon, and also using the attached XRF unit operated at 30 kV.
A BRUKER Titan X-ray fluorescence spectrometer was also used and operated for 30 seconds at 50, 25, and 10 kV.
Fig. 1:  Photograph of the specimen.  Approximately 38 mm maximum dimension.
Fig.2: Backscattered electron image of an area of the specimen.
Fig. 3: Energy dispersive spectrum of spot 1 in Fig. 2 (bastnäsite group with some quartz interference)
Fig. 4: Energy dispersive spectrum of spot 2 in Fig. 2 (likely an iron-bearing kaolinite or a chlorite group species,see overlay)
Fig. 5: Energy dispersive spectrum of spot 3 in Fig. 2 (quartz)
Fig. 6: X-ray map of the area shown in Fig. 2.  Silicon: yellow, cerium: blue, carbon: red.
Summary of findings:  This specimen (Fig. 1) is surprising!  Below the surface of the quartz (Figs. 2 and 5) is a layer with bastnäsite (Figs. 2 and 3) and either iron-bearing kaolinite or a chlorite-group species (Figs. 2 and 4).  I am leaning toward both minerals.  The X-ray map (Fig. 6) clearly shows the correlation between carbon and cerium.  With the high cerium, this would be bastnäsite-(Ce).  This could have come from an Alpine-type hydrothermal vein.  Not a common thing!
Date:    March 23, 2024                      Signature
Stardust Obsidian from Mexico tested as natural volcanic glass with white spherulites of sanidine and a silica variety.
Sample 1560 (obsidian palm stone) · January 4, 2026. Mexican material; a relatively recent market find.
Natural spherulitic obsidian
The laboratory identified a silica-rich natural glass that is largely non-crystalline. Its white spherulites consist of sanidine and a silica variety and represent the beginning of crystallization within the obsidian.
The report explains that more branching masses of these minerals produce the familiar snowflake appearance. It recommends spherulitic obsidian or snowflake obsidian as suitable mineralogical descriptions for this specimen.
Stardust is the trade name for this Mexican variety. The report notes that, over geological time, obsidian can transform into a fine-grained rhyolite-like rock while retaining the same bulk composition.
These results are the property of Soul Body Gems, Alexander Falster, and the Maine Mineral & Gem Museum. Any mention requires full acknowledgment.
Read the report as text
Analytical Result Report
Sample id: 1560 (obsidian palm stone)
Submitted by: Soul Body Gems
Date completed: 1-4-2026
Operating conditions: A Bruker Titan X-ray  fluorescence spectrometer was used and operated at 10, 25 and 50 kV.
Fig. 1:  Photograph of the specimens.  7 cm maximum dimension
Table 1: Major and minor eleental composition of the material, in wt. %.
Fig.  2: View of small thin pieces under the petrographic microscope.  Left:  plane polarized view, right: crossed Nichols view.:
Summary of findings:  This is a pretty specimen!  The bulk composition is essentially that of a silica-rich material, an obsidian.  It is a natural glass and is non-crystalline except for the white spherulites of sanidine and a silica variety.  Those spherulites are the beginning oof crystallization of obsidian.  More dendritic masses of these minerals have a snow-flake like appearance and that type of obsidian is commonly referred to as ‘snowflake’ obsidian.  This material could be  called this as well, or spherulitic obsidian.  Natural glasses are not long lasting geologically speaking.  Obsidian will eventually convert into what looks like a fine-grainned rhyolite. The bulk composition is the same.
Date:    1-4-2026                      Signature

Aluminum | 8.1
Calcium | 0.2
Iron | 2.0
Potassium | 3.7
Manganese | 0.1
Silicon | 33.3
Titanium | 0.1
Two bracelets tested as sodic albite with a small anorthite component. Some fractures contain resin.
Sample 1107 · Two bracelets, #6 · 5 mm and 7 mm beads · December 6, 2024 · Submitted by Soul Body Gems.
What the report identified
The analysis identifies albite in both bracelets. The electron images and spectra document the mineral and resin present in some fractures; the report does not establish a country of origin or a trade name.
The peristerite name
The analyst notes that albite showing iridescence is sometimes called peristerite or albite peristerite. That is the report’s explanation of the name, rather than a separate mineral identification for every bead.
What these findings cover
These findings describe the two submitted bracelets. The report records resin in some fractures without giving a percentage or establishing that every bead has the same treatment.
Analytical Result Report
Sample id: 1107 (2 bracelets #6)
Submitted by: Soul Body Gems
Date completed: 12-6-2024
Operating conditions: An AMRAY 1830 SEM operated at 25 kV acceleration potential, 24 mm working distance, 0 degrees sample tilt, coated with 250 Å carbon, and also using the attached XRF unit operated at 30 kV.
Fig. 1:  Photograph of the specimen.  5 and 7 mm bead dimensions.

Fig.2: Backscattered electron images of an area of the specimens.  Left: 7 mm bead, right: 5 mm bead.
Fig. 3: Energy dispersive spectrum of spot 1 in Fig. 2 left. (sodic plagioclase)
Fig. 4: Energy dispersive spectrum of spot 2 in Fig. 2. (resin).
Fig. 5: Energy dispersive spectrum of spot  in Fig. 2 right. (sodic plagioclase).
Summary of findings:  These specimens (Fig. 1) are pretty. Both are sodic albites, with a small anorthite content (Figs. 2, 3 and 5).  Some fractures contain some resin (Figs. 2 and 3).  Albite showing iridescence is sometimes called peristerite or albite peristerite.
Date:    12-6-2024                      Signature
Purple fluorite coats quartz from Inner Mongolia. Laboratory testing confirms the fluorite, while the question of natural formation is discussed with the analyst’s remaining uncertainty intact.
Also known as Inner Mongolia Purple Fluorite · Sample 1565 · 11 cm maximum dimension · February 10, 2026 · Report submitted by Malama Hatzissavas.
The material and its two names
Fluorite coated Quartz (Inner Mongolia) and Inner Mongolia Purple Fluorite refer to the material discussed here. The word coated describes fluorite covering the quartz surface; the report separately considers whether that growth occurred naturally. Both directory names lead to this same entry.
What the laboratory found
The laboratory used X-ray diffraction and X-ray fluorescence spectroscopy. These confirmed fluorite in the purple surface layer. The sparse, elongated white crystals were identified as calcite and a zeolite, with laumontite given as an example in the report’s diffraction discussion.
The photographs show fluorite across fractured areas as well as intact surfaces. A view inside the quartz shows that fluorite occurs on the exterior rather than throughout the crystal. The analyst interprets the coated fractures as evidence of crystals breaking within a fluid-containing cavity, followed by renewed mineral growth.
Natural formation or human modification?
The analyst considers the fluorite’s minor elements consistent with those commonly encountered in fluorite. Calcite and the zeolite also fit a natural mineral association, although the report acknowledges that these minerals can form under artificial conditions.
The report further reasons that growing such coatings would require costly hydrothermal equipment and questions whether doing so would be economical. Taken together, the observations lean toward a natural process in the analyst’s opinion. The report still expresses doubt; it does not give an unconditional certification that every specimen circulating under these names is natural or untreated.
Why the crystal community debated it
Rolf Egberink’s article at Stapel van Stenen documents the controversy surrounding purple fluorite on quartz from Inner Mongolia. Concerns included the uniform purple appearance and videos showing material loosening in acid. The article explains that a calcite interlayer could account for that reaction without requiring glue.
Egberink also discusses Raman evidence identifying fluorite in another specimen, while acknowledging limits in the publicly available documentation. That account provides useful context for the debate; it concerns separate testing and is not the source of this report’s X-ray results.
Further reading and attribution
We work collaboratively with Rolf Egberink of Stapel van Stenen. His article is credited here as background to the community discussion: Controversy surrounding purple fluorite on quartz from China, first published January 6, 2026, updated January 8, 2026. This entry summarizes selected points and links to his full article.
Original analytical report credited to its named submitter, Malama Hatzissavas, and the Maine Mineral & Gem Museum laboratory. The original wording, figures and composition table are retained below.
Read the report as text
Analytical Result Report
Sample id: 1565 (fluorite-coated quartz from inner Mongolia)
Submitted by: Malama Hatzissavas
Date completed: 2-10-2026
Operating conditions: A Bruker Titan X-ray  fluorescence spectrometer was used and operated at 10, 25 and 50 kV.
A Bruker D2-Phaser X-ray diffractometer was also used in the study and operated at 30 kV and 10 mA.
Fig. 1:  Photograph of the specimen. 11 cm maximum dimension.  Note fractured parts middle and right completely coated by fluorite.
Fig. 2:  Photograph of a view of the interior of the specimen, fluorite is only on the outside.
Fig. 3: X-ray diffraction scan of the specimen with matching reference stick pattern for fluorite in red.
Fig. 4: X-ray diffraction scan of the specimen with matching reference stick pattern for the white crystals calcite and a zeolite in red.
Table 1: Chemical composition of the specimen, in wt. %
Summary of findings:  This is a very peculiar specimen (Fig. 1). The quartz is entirely coated by mainly purple fluorite, this includes areas that are fractured and were also equally coated.  This indicates that an existing miarolitic cavity had experienced some catastrophic event that broke crystals off the walls, followed by resumed crystallization, thus not all fluids were evacuated and the cavity contained fluid phases from which crystallization continued.  A view of the interior of the quartz revealed that the fluorite is grown only on the surface of the quartz crystal.  This can happen, the fluid composition may have changed, and not enough fluorine and calcium were being deposited when the quartz grew.  Fluorite was confirmed by X0-ray diffraction (Fig. 3) and X-ray fluorescence spectroscopy (Table 1).  The sparse little white elongated crystals on the fluorite were also checked by X-ray diffraction, they are calcite and zeolite, for example laumontite (Fig. 4 shows matches).  The big question is are these specimens of natural origin or are they modified by human activity?  The fluorite looks natural; it contains common minor elements such are yttrium and rare earth elements and others commonly seen in fluorite.  The minor accessory minerals calcite and a zeolite are also indicative of natural but they also can form under man-made conditions.  However to grow coatings like this on another mineral requires costly hydrothermal equipment.  It does not appear to me to be economic to do this.  This is in my opinion somewhat more supportive of a natural process, though there are still  doubts.
Date:    2-10-2026                      Signature
 | This specimen
Aluminum | 0.4
Calcium | 50.1
Iron | 0.1
Manganese | nd
Phosphorus | 0.1
Potassium | 0.1
Silicon | 1.4
Yttrium and other REE | 0.1
This necklace was identified as glass, and the analyst concludes that it appears to be man-made. It is not garnet.
Sample 1517 · Necklace beads, mostly under 1 cm · August 15, 2025 · Submitted by Soul Body Gems.
Why it is listed as Man Made Jewelry
The laboratory found a sodium-rich composition and an X-ray diffraction pattern showing non-crystalline material. Optical examination also found isotropic behavior. Together, the findings identify glass, with the analyst describing the material as apparently man-made.
The report records approximately 9 wt. % sodium, 3 wt. % aluminum, 8 wt. % manganese and 4.5 wt. % iron. Its sample label mentions possible nuummite, but the analyzed material was identified as glass. The conclusion explicitly states that it is not garnet.
Scope of the finding
This entry documents the tested necklace. It does not assign a manufacturing method or imply that all jewelry sold under a similar name has the same composition.
Original analytical report submitted by Soul Body Gems, credited to the Maine Mineral & Gem Museum laboratory. Original wording and figures are retained.
Read the report as text
Analytical Result Report
Sample id: 1517 (poss nuummite)
Submitted by: Soul Body Gems
Date completed: 8-15-2025
Operating conditions: An AMRAY 1830 scanning electron microscope was used in the study and operated at 25 kV acceleration potential
  In addition, a Bruker D2-Phaser X-ray diffractometer was used and operatedat 30 kV and 10 mA.

Fig. 1:  Photograph of the specimens.  Beads  are mostly lless than 1 cm maximum dimension.

Fig. 2: Backscattered electron photomicrograph of a sample of the specimen.
Fig. 3: Energy dispersive spectrum of spot 1 in Fig. 2.  (glass?)
Fig. 4: X-ray diffraction scan showing the amorphous natur of the beads.
Summary of findings:  This is a very interesting specimen!  Compositionally, it looks like a sodium-rich (9 wt. % sodium!) glass.  Aluminum is also not very high, about 3 wt. %.  Manganese is high, 8 wt. % and iron is 4.5 wt. %.  X-ray diffraction showed that the material is not crystalline, it is a glass (Fig. 4)  Optically, it is also isotropic.  This mmaterial is not garnet and iit appears to be man-made.
Date:    8-15-2025                      Signature
Sage Moonstone Spheres · Soul Body Gems, February 2024.
Sage Moonstone from our Tanzanian collection is natural moonstone. The tested beads have a composition consistent with potassium-rich feldspar, such as orthoclase, and show the internal structure responsible for moonstone’s sheen.
Sample 10491 · New batch #3 · Beads approximately 6.5 mm · January 31, 2024 · Tanzania is the supplied collection locality.
A natural moonstone
The analyst identifies a potassium-rich feldspar composition with minor and trace elements typical of that mineral. The report explains the sheen, or adularescence, as the result of incipient exsolution of a plagioclase-rich phase. These fine lamellae create the optical effect commonly associated with moonstone.
The report therefore supports the moonstone identification through composition and its internal feldspar structure. Sage is our descriptive collection name; the laboratory does not propose a separate mineral species called Sage Moonstone.
Reading the report
The report’s elemental table records barium, iron and sodium, and its figure captions are reproduced below. Tanzania is the collection provenance supplied by Soul Body Gems; the analysis itself does not independently establish geographic origin. The report does not provide a separate determination of every possible treatment.
Original analytical report submitted by Soul Body Gems, credited to the Maine Mineral & Gem Museum laboratory. Original wording and figures are retained.
Read the report as text
Analytical Result Report
Sample id: 10491 (new batch #3)
Submitted by: Soul Body Gems
Date completed: 1-31-2024
Operating conditions: An AMRAY 1830 SEM operated at 25 kV acceleration potential, 24 mm working distance, 0 degrees sample tilt, coated with 250 Å carbon, and also using the attached XRF unit operated at 30 kV.
A BRUKER Titan X-ray fluorescence spectrometer was also used and operated for 30 seconds at 50, 25, and 10 kV.
Fig. 1:  Photograph of the specimen.  Approximately 6.5 mm maximum dimension of the beads.
Fig.2: Backscattered electron image of an area of the specimen.
Fig. 3: Energy dispersive spectrum of spot 1 in Fig. 2 (pyrite or marcasite)
Table 1: minor and trace elements in the beads. (in wt. %)
Summary of findings:  This specimen (Fig. 1) is very pretty.  The composition is consistent with a potassium-rich feldspar such as an orthoclase (Figs. 2 and 3).  The minor and trace elements are also typical for this species.  The sheen/adularescence is caused by incipient exsolution of a plagioclase rich phase, exsolution lamellae which cause the optical effect. It is what is commonly referred to as moonstone.
Date:    January 31, 2024                      Signature
Barium | 0.02
Iron | 0.01
Sodium | 2.11
Sage Moonstone Stretch Bracelets · Soul Body Gems, February 2024.
The tested green heart is muscovite. The analyst found no evidence of dye and considers its green color natural, arising from chromium, iron and vanadium.
Also sold as Green Gem Lepidolite · Sample 10496 · New batch #7 · February 1, 2024 · Submitted by Soul Body Gems.
Specimen photograph cropped and slightly brightened from the report. The unedited photograph remains in the original report below.
The question about green color
Our question was whether this material’s green color was natural. The analyst examined its composition and a cleavage piece, observing uniform green color parallel to the cleavage plane and a much paler green across its thin edge. No evidence of dye was observed, including along the cleavage direction where the report explains that dye could enter.
The measured trace elements include chromium at 0.04 wt. %, iron at 0.74 wt. % and vanadium at 0.09 wt. %. The report identifies all three as contributors to the green hue and concludes that the color is natural.
Muscovite and the trade name
Green Muscovite and Green Gem Lepidolite are the two names under which we are listing this material. The laboratory identifies the carved heart as muscovite; Green Gem Lepidolite is retained as a searchable trade name, rather than the mineral identification.
This is a separate report from our Brazilian green mica sold as emerald. The natural-color conclusion applies to this submitted specimen, not automatically to every green mica sold in the market.
Original analytical report submitted by Soul Body Gems, credited to the Maine Mineral & Gem Museum laboratory. Original wording and figures are retained.
Read the report as text
Analytical Result Report
Sample id: 10496 (new batch #7)
Submitted by: Soul Body Gems
Date completed: 2-1-2024
Operating conditions: An AMRAY 1830 SEM operated at 25 kV acceleration potential, 24 mm working distance, 0 degrees sample tilt, coated with 250 Å carbon, and also using the attached XRF unit operated at 30 kV.
A BRUKER Titan X-ray fluorescence spectrometer was also used and operated for 30 seconds at 50, 25, and 10 kV.

Fig. 1:  Photograph of the specimen.  Approximately 1.5 mm maximum dimension. Two close-up images show that the color parallel to the cleavage plane is green and perpendicular to a cleavage piece, it is almost colorless with very faint greenish hue.  No evidnce of dye is visible.
Fig.2: Backscattered electron image of an area of the specimen.
Fig. 3: Energy dispersive spectrum of spot 1 in Fig. 2 (pyrite or marcasite)
Table 1: minor and trace elements in the specimen. (in wt. %)
Summary of findings:  This specimen (Fig. 1) is very interesting to see, carved muscovite.  Compositionally, it shows the usual composition (Figs. 2 and 3).  Trace elements included 3 elements that can contribute green color: chromium, iron, and vanadium (Table 1).  Noteworthy is uniform appearance of a cleavage piece of the material.  It is uniformly green parallel to the cleavage plane and pale green perpendicular, which is pale due to the thinner nature.  There is no evidence of dye.  The only place where dye could get in is parallel to the cleavage plane and nothing was noted.  This I believe the color is natural and a result of the 3 chromophores which contributed to the green hue.
Date:    February 1, 2024                      Signature
Chromium | 0.04
Iron | 0.74
Vanadium | 0.09
Yellow Muscovite aka Yellow Lepidolite · Soul Body Gems, December 2023.
The tested yellow material is muscovite, rather than the lepidolite named in its market label. The report also detects resin or epoxy, likely used to stabilize it.
Yellow Muscovite · Yellow Lepidolite · Muscovite (yellow) · Sample 10504 · New #6 · Approximately 40 mm · February 22, 2024.
Three names, one tested material
All three directory names lead to this report. Yellow Lepidolite is preserved so that someone searching the name used by a seller can find the findings. The laboratory identifies the mineral as muscovite, so lepidolite is not the correct identification for this specimen.
Resin or epoxy in the specimen
The electron images and spectra distinguish the muscovite from resin or epoxy. The analyst interprets the latter as likely used for stabilization. This treatment is part of the tested specimen’s description and should accompany its mineral name.
What the report establishes
The report describes a typical muscovite minor and trace element composition. It does not separately conclude whether the yellow color is natural or enhanced; the principal findings are the muscovite identification and the presence of resin or epoxy.
Original analytical report submitted by Soul Body Gems, credited to the Maine Mineral & Gem Museum laboratory. Original wording and figures are retained.
Read the report as text
Analytical Result Report
Sample id: 10504 (new #6)
Submitted by: Soul Body Gems
Date completed: 2-22-2024
Operating conditions: An AMRAY 1830 SEM operated at 25 kV acceleration potential, 24 mm working distance, 0 degrees sample tilt, coated with 250 Å carbon, and also using the attached XRF unit operated at 30 kV.
A BRUKER Titan X-ray fluorescence spectrometer was also used and operated for 30 seconds at 50, 25, and 10 kV.
Fig. 1:  Photograph of the specimen.  Approximately 40 mm maximum dimension.
Fig.2: Backscattered electron image of an area of the specimen.
Fig. 3: Energy dispersive spectrum of spot 1 in Fig. 2 (muscovite)
Fig. 4: Energy dispersive spectrum of spot 2 in Fig. 2 (resin or epoxy)
Fig.5: Backscattered electron image of an0ther area of the specimen.
Fig. 6: Energy dispersive spectrum of spot 1 in Fig. 5 (muscovite)
Fig. 7: Energy dispersive spectrum of spot 2 in Fig. 5 (resin or epoxy)
Table 1: minor and trace elements in the manganese silicate.
Summary of findings:  This specimen (Fig. 1) is unusual; it is composed of muscovite (Figs. 2,3, 5 and 6).  Some resin or epoxy was used likely to stabilize it (Figs. 2, 4, 5 and 7).  Chemically it shows the typical minor and trace elements (Table 1).
Date:    February 22. 2024                      Signature
Calcium | 0.09
Chromium | 0.01
Iron | 0.59
Magnesium | 0.7
Manganese | 0.33
Sodium | 1.01
Titanium | 0.02
Vanadium | 0.01
Gem Muscovite Yellow · Soul Body Gems, January 2026.
Pink Selenite sold as naturally pink was tested as gypsum. Our experience with eight pieces fading to white, together with the producing factory’s verbal admission, provides further evidence that the pink color of our purchased material was artificially induced. The laboratory report itself leaves treatment unresolved.
Sample 10471 · New batch #1 · January 18, 2024 · Submitted by Soul Body Gems.
Original AI illustration of pink gypsum. This illustrates the market material and is not a photograph of our tested specimen.
How this material was presented
When this pink material entered the market, it was promoted strongly as naturally colored and offered at high prices. Ordinary gypsum is not generally an expensive material, so the claimed natural pink color was central to the premium being asked. We wanted to investigate that claim rather than rely on the sales description.
What we observed at Soul Body Gems
We purchased eight pieces and left them in a box. About two months later, they had lost their pink color and become entirely white. We also spoke with a factory in China that produces the material; it verbally confirmed to us that the pink color was not natural.
We regard the fading in our purchased pieces and the producing factory’s admission as additional evidence supporting artificially induced color. These are our direct observations and the factory’s verbal statement. They do not establish which process produced the color, and they are separate from the laboratory analysis below.
What the laboratory established
The laboratory identified gypsum and documented pink color zoning. Its trace-element discussion considered manganese and trivalent iron as possible coloring contributors. The analyst interpreted the zoning as ruling out dye application or diffusion treatment, and considered radiation treatment as a possibility if shielding had affected portions of the specimen.
No radiation above background was detected. The report also mentions red compounds in halophile microbes as a point to consider. It concludes that the analyst could not determine whether this specimen had been treated. Neither irradiation nor a biological coloring mechanism was established by the report.
Our conclusion and the limits of the evidence
The laboratory confirms what the mineral is, while our later fading observation and the factory’s acknowledgment strengthen the case against the natural-color marketing claim for our purchased material. We do not present the laboratory report as proof of a specific treatment. We also do not apply this experience to every pink gypsum specimen from every source.
Original analytical report submitted by Soul Body Gems, credited to the Maine Mineral & Gem Museum laboratory. Original wording, figures and tables are retained.
Read the report as text
Analytical Result Report
Sample id: 10471 (#1)
Submitted by: Soul Body Gems
Date completed: 1-18-2024
Operating conditions: An AMRAY 1830 SEM operated at 25 kV acceleration potential, 24 mm working distance, 0 degrees sample tilt, coated with 250 Å carbon, and also using the attached XRF unit operated at 30 kV.
A BRUKER Titan X-ray fluorescence spectrometer was also used and operated for 30 seconds at 50, 25, and 10 kV.
\

Fig. 1:  Photograph of the specimen.  Note color zoning.
Fig.2: Backscattered electron image of an area of the specimen.
Fig. 3: Energy dispersive spectrum of spot 1 in Fig. 2 (gypsum)
Table 1: Trace elements in the specimen
Summary of findings:  This specimen (Fig. 1) is very interesting for its notable pink color (Fig. 1).  Compositionally, is is gypsum (Figs. 2 and 3).  Trace elements which could cause such a color are shown in Table 1.  Manganese and trivalent iron are the only candidates from the trace element data.  The specimen shows noticeable color zoning.  This rules out and dye application or diffusion treatment.  Dye treatment on optically clear gypsum is not likely to be successful.  Radiation treatment is a possibility if some shielding was present over the areas not showing the pink color.  No radiation above background was detected from the specimen.  Iron isotopes could have converted to radioactive isotopes under radiation treatment, depending on the type used.  One point to consider is the red compounds present in red halophile microbes.  At this point I cannot say that this material has been treated or not.
Date:    January 18. 2024                      Signature
Iron | 0.03
Manganese | 0.03
Phosphorus | 0.1
Strontium | 0.04
Blue Apatite in Orange Calcite (Madagascar) Spheres · Soul Body Gems, February 2024.
This Madagascar sphere contains blue apatite, orange calcite and pale quartz. The analyst describes brecciated calcite and apatite naturally cemented by quartz/chalcedony, addressing our question about whether the combination was natural.
Also Orange Calcite & Blue Apatite · Sample 10489 · Batch #8 · Approximately 45 mm · January 29, 2024 · Madagascar is the collection locality supplied by Soul Body Gems.
The minerals behind the colors
The blue areas were identified as apatite, the orange areas as calcite, and the white to light-gray material as quartz. The report attributes the apatite’s blue chiefly to manganese, with iron also able to contribute. It attributes the calcite’s orange chiefly to trivalent iron.
Was it naturally combined?
The laboratory describes the material as brecciated calcite and apatite, with quartz/chalcedony acting as natural cement. This is the report’s interpretation of the examined specimen. The electron images, spot spectra and elemental map document how its different minerals occur together.
One report under two names
Blue Apatite in Orange Calcite and Orange Calcite & Blue Apatite lead to this same entry. The Madagascar provenance comes from our collection history; the analytical work establishes mineral composition and the observed association, rather than independently verifying geographic origin.
This is a separate specimen and report from the Blue Apatite Chert material elsewhere in Gem Knowledge.
Original analytical report submitted by Soul Body Gems, credited to the Maine Mineral & Gem Museum laboratory. Original wording, figures and tables are retained.
Read the report as text
Analytical Result Report
Sample id: 10489 (w batch #8)
Submitted by: Soul Body Gems
Date completed: 1-29-2024
Operating conditions: An AMRAY 1830 SEM operated at 25 kV acceleration potential, 24 mm working distance, 0 degrees sample tilt, coated with 250 Å carbon, and also using the attached XRF unit operated at 30 kV.
A BRUKER Titan X-ray fluorescence spectrometer was also used and operated for 30 seconds at 50, 25, and 10 kV.
Fig. 1:  Photograph of the specimen.  Approximately 45 mm maximum dimension.
Fig.2: Backscattered electron image of an area of the specimen.
Fig. 3: Energy dispersive spectrum of spot 1 in Fig. 2 (apatite)
Fig. 4: Energy dispersive spectrum of spot 2 in Fig. 2 (quartz)
Fig. 5: Energy dispersive spectrum of spot 3 in Fig. 2 (calcite)
Fig.6: Backscattered electron image of another area of the specimen.
Fig. 7: Energy dispersive spectrum of spot 1 in Fig. 6 (apatite)
Fig. 8: Energy dispersive spectrum of spot 2 in Fig. 6 (quartz)
Fig. 9: Energy dispersive spectrum of spot 4 in Fig. 6 (calcite)
Fig. 10: X-ray map of the area shown in Fig. 6.  Silicon: yellow, phosphorus: green, calcium: red.
Table 1: minor and trace elements in the calcite. (in wt. %)
Summary of findings:  This specimen (Fig. 1) is very intriguing.  The blue material is apatite (Figs. 2, 3 and 6, 7).  The orange areas are calcite (Figs. 2, 5 and 6, 9) And the white to light gray is quartz (Figs. 2, 4 and 6, 8).  The material appears to be brecciated calcite and apatite, naturally cemented by quartz/chalcedony.  The colors are caused in the apatite by manganese dominantly, it gives the blue color, iron can also contribute.  The orange color is caused dominantly by iron, in the trivalent state (Table 1).
Date:    January 29, 2024                      Signature
 | apatite | calcite
Iron | 0.10 | 0.38
Magnesium | 0.02 | 0.22
Manganese | 0.24 | 0.30
Quartz from a Brazilian find that entered our collection history in 2023, with green inclusions that the analyst considers likely to belong to the pumpellyite group.
Sample 1217 · #2 quartz with green inclusions · Approximately 4 cm · February 25, 2025 · Brazil and the 2023 find are supplied collection history.
The quartz and green inclusions
The laboratory identifies the host as quartz. Some green inclusions exposed at the surface closely resemble a member of the pumpellyite group, with small amounts of magnesium and iron substituting for calcium. The report preserves this as a qualified group-level identification rather than assigning a specific pumpellyite species.
Polishing powder in fractures
The analyst also identifies chromium/aluminum oxide polishing powder trapped in some fractures. This observation is distinct from the green mineral inclusions described elsewhere in the report. It should be retained when describing this polished specimen.
Collection history and scope
We associate this material with a 2023 find from Brazil. The report was completed in February 2025 and analyzes the submitted specimen; it does not independently date the discovery or establish the mine locality.
Original analytical report submitted by Soul Body Gems, credited to the Maine Mineral & Gem Museum laboratory. Original wording, figures and tables are retained.
Read the report as text
Analytical Result Report
Sample id: 1217 (#2 quartz with green inclusions)
Submitted by: Soul Body Gems
Date completed: 2-25-2025
Operating conditions: An AMRAY 1830 SEM operated at 25 kV acceleration potential, 24 mm working distance, 0 degrees sample tilt, coated with 250 Å carbon, and also using the attached XRF unit operated at 30 kV.

Fig. 1:  Photograph of the specimens.  4 cm maximum dimensions. Two close-ups of the green inclusions on the right.

Fig.2: Backscattered electron image of an area of the specimen.

Fig. 3: Energy dispersive spectrum of spot 1 in Fig. 2. (quartz)
Fig. 4: Energy dispersive spectrum of spot 2 in Fig. 2 (likely chromium and aluminum oxide polishing material).
Fig.5: Backscattered electron image of another area of the specimen.
Fig. 6: Energy dispersive spectrum of spot 1 in Fig. 6 (pumpellyite group).
Summary of findings:  This specimen (Fig. 1) is very nice.  The specimen is quartz (Figs. 2 and 3). Some chromium/aluminum oxide polishing powder got trapped in some fractures. (Figs. 2 and 4).  Some of the green inclusions are exposed at the surface and are looking very much like a member of the pumpellyite group, with a little magnesium and iron substituting for calcium (Figs. 5 and  6)
Date:    2-25-2025                      Signature
Purple and white beads originally sold as Amethyst Jade were identified as quartz, variety amethyst. This tested material is not jade.
Also listed as Amethyst in Quartz · Sample 10473 · #4 · Beads approximately 8.9 mm · January 18, 2024.
Correcting the original sales name
The laboratory identifies quartz and describes trace elements characteristic of amethyst, including elevated iron. Amethyst Jade is preserved here as the name under which the material was sold, so customers can find the test results using that label. It is not the mineral identification.
The two directory names
Amethyst Jade and Amethyst in Quartz lead to this one report. Amethyst is itself a variety of quartz; the second listing follows our collection name for these purple and white beads rather than introducing an additional mineral species.
The original report’s figure 3 caption labels its analyzed spot as calcite, while the summary identifies the beads as quartz, variety amethyst. Both are preserved in the original text below.
Original report submitted by Soul Body Gems; Maine Mineral & Gem Museum laboratory. Original text, figures and table retained.
Read the report as text
Analytical Result Report
Sample id: 10473 (#4)
Submitted by: Soul Body Gems
Date completed: 1-18-2024
Operating conditions: An AMRAY 1830 SEM operated at 25 kV acceleration potential, 24 mm working distance, 0 degrees sample tilt, coated with 250 Å carbon, and also using the attached XRF unit operated at 30 kV.
A BRUKER Titan X-ray fluorescence spectrometer was also used and operated for 30 seconds at 50, 25, and 10 kV.
Fig. 1:  Photograph of the specimen.  Approximately 8.9 mm maximum dimension of the beads.
Fig.2: Backscattered electron image of an area of the specimen.
Fig. 3: Energy dispersive spectrum of spot 1 in Fig. 2 (calcite)
Table 1: minor and trace elements in the quartz.
Summary of findings:  This specimen (Fig. 1) is a pretty wristlet of purple and white beads.  Compositionally, they are quartz (Figs. 2 and 3).  The trace elements are characteristic for amethyst with elevated iron (Table 1).  They are quartz, variety amethyst, this is not jade!  Jade is a sodium aluminum silicate.
Date:    January 18. 2024                      Signature
Aluminum | 0.3
Calcium | 0.03
Iron | 0.15
Manganese | 0.01
Titanium | 0.006
Grossular Garnet bracelets · August 2025. This photograph shows a later collection group; laboratory report 10474 below concerns a separately submitted bracelet.
The tested bracelet is green grossular garnet. Its chemistry illustrates a naming boundary with tsavorite, and the analyst prefers the more specific description green grossular with minor chromium, vanadium and iron for this specimen.
Sample 10474 · #6 · Beads approximately 7.5 mm · January 18, 2024 · Submitted by Soul Body Gems.
Tsavorite is a variety of grossular
Grossular and tsavorite are not two unrelated mineral species. The report explains that tsavorite is green grossular. The question for these beads is which descriptive name best fits a green grossular with relatively low chromium, vanadium and iron.
The measured minor and trace elements include iron, titanium, chromium and vanadium. The analyst notes that chromium, vanadium and iron contribute to the green color, but calls the naming choice tricky and explicitly favors green grossular for this bracelet.
A boundary in naming
A green appearance alone does not resolve the trade-name question. This report illustrates why two visually similar green grossular materials need not be described identically in commerce. We retain the analyst’s preferred description without claiming that every green grossular should be called tsavorite or inventing a universal cutoff from this one analysis.
The report is also included on our Tsavorite Garnet page. These tested beads are a separate specimen from the Kenya-sourced faceted gems photographed there.
Original report submitted by Soul Body Gems; Maine Mineral & Gem Museum laboratory. Original text, figures and table retained.
Read the report as text
Analytical Result Report
Sample id: 10474 (#6)
Submitted by: Soul Body Gems
Date completed: 1-18-2024
Operating conditions: An AMRAY 1830 SEM operated at 25 kV acceleration potential, 24 mm working distance, 0 degrees sample tilt, coated with 250 Å carbon, and also using the attached XRF unit operated at 30 kV.
A BRUKER Titan X-ray fluorescence spectrometer was also used and operated for 30 seconds at 50, 25, and 10 kV.


Fig. 1:  Photograph of the specimen.  Approximately 7.5 mm maximum dimension of the beads.
Fig.2: Backscattered electron image of an area of the specimen.
Fig. 3: Energy dispersive spectrum of spot 1 in Fig. 2 (grossular)
Table 1: minor and trace elements in the beads.
Summary of findings:  This specimen (Fig. 1) is a pretty wristlet of beads.  Chemically, they are grossular (Figs. 2 and 3).  The trace elements show minor amounts of iron, titanium, chromium and vanadium.  Tsavorite is a green grossular but this material is a green grossular with low chromium, vanadium and iron content which also gives it a green color.  So, it is a tricky one.  I would be more comfortable calling it a green, grossular with minor chromium , vanadium and iron content which give it green color.
Date:    January 18. 2024                      Signature
Chromium | 0.09
Iron | 0.15
Titanium | 0.12
Vanadium | 0.05
The green beads are nickel-colored quartz/chalcedony, with some garnierite content considered likely by the analyst. Australia is the origin supplied for this collection.
Sample 10476 · #7 · Approximately 4.8 mm beads · January 18, 2024 · Submitted by Soul Body Gems.
Australian Chrysoprase SS Rings · Soul Body Gems, November 2024.
Nickel and the green color
The report attributes the green color to nickel. It records nickel as the dominant minor element at 1.7 wt. % and describes the material as likely chalcedony or quartz with some garnierite content.
How to read the collection name
Chrysoprase Garnierite is our searchable collection label. The report does not describe a pure garnierite specimen or establish a separate mineral species with that combined name. Its qualified wording is retained: a quartz/chalcedony material with some garnierite considered likely.
Collection provenance and scope
Australia is our supplied collection provenance. The analysis identifies the submitted beads’ composition and coloring element, rather than independently determining their mine locality. The video photograph illustrates our collection; the original tested bracelet is photographed in the report below.
Original analytical report submitted by Soul Body Gems; Maine Mineral & Gem Museum laboratory. Original figures, wording and tables retained.
Read the report as text
Analytical Result Report
Sample id: 10476 (#7)
Submitted by: Soul Body Gems
Date completed: 1-18-2024
Operating conditions: An AMRAY 1830 SEM operated at 25 kV acceleration potential, 24 mm working distance, 0 degrees sample tilt, coated with 250 Å carbon, and also using the attached XRF unit operated at 30 kV.
A BRUKER Titan X-ray fluorescence spectrometer was also used and operated for 30 seconds at 50, 25, and 10 kV.


Fig. 1:  Photograph of the specimen.  Approximately 4.8 mm maximum dimension of the beads.
Fig.2: Backscattered electron image of an area of the specimen.
Fig. 3: Energy dispersive spectrum of spot 1 in Fig. 2 (quartz/chlcedony with nickel content)
Table 1: minor and trace elements in the beads.
Summary of findings:  This specimen (Fig. 1) is a pretty wristlet of beads.  This is an interesting one, the color is caused by nickel content (Figs. 2 and 3).  Table 1 shows some of the minor and trace elements and nickel is dominant with 1.7 wt. %.  This is likely a chalcedony or quartz with some garnierite content!
Date:    January 18. 2024                      Signature
Copper | 0.02
Iron | 0.08
Manganese | 0.02
Nickel | 1.7
Our video is captioned Dumortierite and Rose Quartz. Words visible within the video image reflect its original presentation.
The blue and pink-to-lavender beads are quartz. The blue inclusions have an aluminum-rich silicate composition consistent with dumortierite, while the pink-to-lavender beads appear more like rose quartz.
Also Dumortierite & Lavender Rose Quartz · Sample 1210 · #9 blue and lavender rose quartz · Approximately 0.45 cm beads · December 24, 2024.
Lavender Rose Quartz sphere from the November 2025 personal collection release. The laboratory report on this page concerns the separately submitted blue and lavender beads, sample 1210.
What the two colors share
The laboratory identifies quartz in both bead colors. The blue beads contain an aluminum-rich silicate consistent with dumortierite. The report’s caption retains dumortierite as a possibility, and the summary says the blue beads appear to be colored by dumortierite.
The pink-to-lavender beads appear more like rose quartz. The report records differences in minor and trace elements between the two bead colors. Its original element table and wording are retained below, including the laboratory’s uncertainty.
One report, two directory names
Lavender Rose Quartz & Dumortierite and Dumortierite & Lavender Rose Quartz lead to this same report and collection video. These names help visitors find the material without presenting the blue inclusion identification as more conclusive than the laboratory describes.
Original analytical report submitted by Soul Body Gems; Maine Mineral & Gem Museum laboratory. Original figures, wording and tables retained.
Read the report as text
Analytical Result Report
Sample id: 1210 (#9 blue and lavender rose quartz)
Submitted by: Soul Body Gems
Date completed: 12-24-2024
Operating conditions: An AMRAY 1830 SEM operated at 25 kV acceleration potential, 24 mm working distance, 0 degrees sample tilt, coated with 250 Å carbon, and also using the attached XRF unit operated at 30 kV.

  Fig. 1:  Photograph of the specimens.  The beads are about 0.45 cm in maximum dimensions.  Close-ups are shown on the right.

Fig.2: Backscattered electron image of an area of the specimen.
Fig. 3: Energy dispersive spectrum of spot 1 in Fig. 2. (quartz)
Fig. 4: Energy dispersive spectrum of spot 2 in Fig. 2. (the blue mineral, dumortierite is a possibiliity)
Table 1: trace element and minor element composition of the two colors of beads, in wt.
Summary of findings:  This specimen (Fig. 1) is made from beads with blue color patches and more pinkish ones.  The material is in both cases quartz (Figs. 2 and 3) but the blue material is a high aluminum silicate consistent with dumortierite.  Table 1 shows that the blue beads are more aluminum-rich and the pink ones have higher manganese and also detectable and quantifiable manganese.  The blue ones appear to be colored by dumortierite and the pink to lavender ones appear more like rose quartz.
Date:    12-24-2024                      Signature
 | Blue bead | Pink/lavender bead
Aluminum | 0.76 | 0.38
Iron | 0.03 | 0.02
Manganese | 0.02 | 0.06
Phosphorus | nd | 0.08
A sphere identified as fluorite. Its trade name remains pending, so the tested specimen is listed as Mystery Stone 22.
Sample 1522 · #4 sphere · 6.5 cm maximum dimension · September 24, 2025 · Submitted by Soul Body Gems.
What testing identified
Both analyzed areas were identified as fluorite. The analyst describes this sphere as homogeneous in composition compared with another sphere discussed in the testing series.
Yttrium and associated elements
The report records yttrium between 0.30 and 0.33 wt. %. It also notes smaller amounts of ytterbium, lutetium, thulium and other heavy rare earth elements. The original spectra are included below.
Scope and report date
The results describe the submitted sphere, rather than all fluorite sold under an eventual trade name. The original document gives September 24, 2025 as its completion and signature date, although the uploaded filename contains September 25.
Original analytical report submitted by Soul Body Gems; Maine Mineral & Gem Museum laboratory. Original wording and figures retained.
Read the report as text
Analytical Result Report
Sample id: 1522 (#4 sphere)
Submitted by: Soul Body Gems
Date completed: 9-24-2025
Operating conditions: An AMRAY 1830 SEM operated at 25 kV acceleration potential, 24 mm working distance, 0 degrees sample tilt, coated with 250 Å carbon, and also using the attached XRF unit operated at 30 kV.

Fig. 1:  Photograph of the specimens.  6.5 cm maximum dimension.

Fig.2: Backscattered electron image of an area of the specimen in Fig. 1.
Fig. 3: Energy dispersive spectrum of spot 1 in Fig. 2. (fluorite)
Fig. 4: Energy dispersive spectrum of spot 2 in Fig. 2. (fluorite)
Summary of findings:  A very interesting specimen!  This one is also fluorite (Figs. 2-4).  Compared to the other sphere, this one is homogenous in composition.  The major heavy rare earth element is yttrium and runs between 0.30 and 0.33 wt. %. The heavy rare earth elements ytterbium, lutetium, thulium etc.  are also present in lesser amounts.
Date:    9-24-2025                      Signature
Gem Rhodonite SS Rings · Soul Body Gems, June 2024.
The laboratory confirms rhodonite in this specimen, together with potassium feldspar, quartz and barite. It is listed as Gem Rhodonite from our African collection.
Sample 10500 · New #4 · Approximately 40 mm · February 14, 2024 · Africa is the provenance supplied by Soul Body Gems.
Confirmed rhodonite and associated minerals
The report identifies rhodonite in several analyzed areas and describes its minor and trace element composition as comparatively clean. Potassium feldspar is also present, quartz forms large patches, and barite is an accessory mineral.
A possible skarn origin
The analyst considers formation in a manganese-rich skarn likely. This is a geological interpretation of the mineral association, rather than an independently established mine location or discovery history.
Collection name and provenance
Gem Rhodonite is our collection name. Africa is the supplied origin; the report does not identify a particular African country or mine. The findings describe the submitted specimen and do not establish a faceting grade or the composition of every similar-looking piece.
Original analytical report submitted by Soul Body Gems; Maine Mineral & Gem Museum laboratory. Original wording and figures retained.
Read the report as text
Analytical Result Report
Sample id: 10500 (new #4)
Submitted by: Soul Body Gems
Date completed: 2-14-2024
Operating conditions: An AMRAY 1830 SEM operated at 25 kV acceleration potential, 24 mm working distance, 0 degrees sample tilt, coated with 250 Å carbon, and also using the attached XRF unit operated at 30 kV.
A BRUKER Titan X-ray fluorescence spectrometer was also used and operated for 30 seconds at 50, 25, and 10 kV.
Fig. 1:  Photograph of the specimen.  Approximately 40 mm maximum dimension.
Fig.2: Backscattered electron image of an area of the specimen.
Fig. 3: Energy dispersive spectrum of spot 1 in Fig. 2 (rhodonite)
Fig. 4: Energy dispersive spectrum of spot 3 in Fig. 2 (potassium feldspar)
Fig. 5: Backscattered electron image of another area of the specimen.
Fig. 6: Energy dispersive spectrum of spot 1 in Fig. 5 (rhodonite)
Fig. 7: Energy dispersive spectrum of spot 4 in Fig. 5 (barite)
Fig. 8: Backscattered electron image of another area of the specimen.
Fig. 8: Energy dispersive spectrum of spot 2 in Fig. 5 (quartz)
Table 1: minor and trace elements in the rhodonite.
Summary of findings:  This specimen (Fig. 1) is a pretty specimen!  The rhodonite is confirmed (Figs. 2, 3, 5 and 6).  It also pretty clean (Table 1).  Potassium feldspar (Figs. 2 and 4) is also present, and quartz forms large patches (Figs. 8 and 9).  An interesting accessory mineral is barite (Figs.6 and 7).  This material likely formed in a manganese-rich skarn.
Date:    February 14. 2024                      Signature
Barium | 0.22
Iron | 0.37
Calcium | 0.74
Magnesium | 0.26
Strontium | 0.01
A smiling face, a rounded belly, and an open, relaxed posture: the Laughing Buddha is one of the most recognizable subjects in decorative carving. In our April 2025 collection, this familiar figure appears in garden quartz, bringing the character of the carving together with the patterns inside the stone.
Who is the Laughing Buddha?
The figure commonly called the Laughing Buddha is Budai, a Chinese Buddhist monk associated with the tenth century. His name refers to the cloth bag he carries. The Metropolitan Museum of Art describes his laughing expression and round stomach, and explains his traditional identification with Maitreya, the Buddha of the future. This is a particular figure within Buddhist imagery, rather than a portrait of the historical Buddha, Shakyamuni.
The Walters Art Museum’s collection includes a rubbing of a much older depiction of Budai. Its explanation connects the monk, his cloth bag, and the later name “Laughing Buddha.” Seeing him represented in historical artworks helps place contemporary gemstone carvings within a wider artistic tradition.
A carving about joy
For a collector, the appeal may begin with the expression: a figure who seems comfortable, cheerful, and at ease. The smile can serve as a personal reminder to make room for laughter and generosity. These are ways someone might relate to an artwork; they do not require believing that a stone or carving can guarantee a particular outcome.
The meaning of a carving also depends on the person who chooses it. Some people appreciate its religious or cultural associations, while others are drawn to its warmth, the skill of the carving, or the material itself. Understanding the subject’s background gives that appreciation more depth.
Our garden quartz carvings
The photograph shows transparent to translucent carvings with visible material inside the quartz. Looking through the held piece, the face, belly, and folded contours appear against its internal patterns. The surrounding carvings show how the same subject can look different from one piece to another. Turn the piece and the view changes as light passes through the body of the carving.
“Garden quartz” is a descriptive trade name used for quartz with an inclusion-rich, landscape-like appearance. It does not identify every mineral inside a particular carving. GIA’s work on gemstone inclusions explains that inclusions can be solid minerals, fluids, or gases, and that their study can reveal information about a gem’s formation. A photograph alone does not establish the composition of each inclusion in our pieces.
Stone and artistry together
The natural patterns belong to the material; the face and figure are shaped by the carver. Both deserve attention. A clear area can make the expression easier to see, while an included area can add depth or create a miniature scene within the figure. The result is an object that invites looking closely at the stone as well as at the artwork.
A dark polished stone can suddenly open into a sweep of violet, gold, blue, or green. Labradorite’s changing flash makes it a material to turn in the hand: its beauty depends on the relationship between the stone, the light, and the person looking.
Labradorite and the feldspar family
Labradorite belongs to the plagioclase feldspars, a group of rock-forming minerals that also supplies several gem materials. Feldspar is a broad family, so recognizing a flash is only part of understanding a piece. Mineral composition, internal structure, and the way it interacts with light all contribute to its appearance.
Why the color appears and disappears
The broad iridescent flash is called labradorescence. GIA explains that microscopic alternating feldspar layers with different compositions interact with light. Their spacing and optical properties affect which colors we see. The color is therefore a structural optical effect: the stone can look subdued from one direction and brilliant when turned toward a favorable angle.
This directionality matters to a lapidary. A polished surface needs to reveal the internal arrangement effectively. The brightest view is not necessarily visible from every side of a freeform, and one stone can have several differently colored areas. Moving the light or rotating the piece gives a fuller sense of its character than a single still photograph.
Our Madagascar freeforms
The collection collage shows strong pink, purple, orange, gold, and blue flashes across polished freeforms. Some appear as broad color fields, while others show dark lines and differently oriented areas. Those visible differences are part of what makes choosing a piece personal: one collector may prefer a continuous flash, another a patchwork of colors or a particularly sculptural shape.
Madagascar is the supplied origin of this collection material. GIA’s illustrated discussion of phenomenal cabochons includes labradorite from Madagascar alongside Finnish material. A photograph can document appearance, but it does not independently establish a mine or locality. We preserve locality information as part of the sourcing record.
Labradorite and rainbow moonstone
Names in the feldspar trade can overlap. GIA identifies transparent rainbow moonstone as labradorite, and its 2025 gem-show coverage discusses transparent Madagascar material confirmed as that feldspar variety. That does not mean every material sold as moonstone has the same composition. Our Malagasy Rainbow Labradorite entry preserves the findings for the specimen we submitted for testing.
This page focuses on the darker, visibly flashy polished freeforms shown here. The pale and transparent materials in our other entries have their own photographs and specimen records. A shared mineral name can encompass quite different appearances.
Handling and enjoying the material
The Australian Museum gives labradorite a Mohs hardness of 6–6.5 and draws attention to its cleavage, meaning it can split along preferred internal directions. Hardness describes resistance to scratching; it does not make a stone resistant to every impact. Handle polished freeforms gently, protect edges from knocks, and keep them separated from harder stones in storage.
For viewing, try a small directional light and slowly turn the piece. Let the flash emerge at its own angle. Our photo captures especially colorful views; seeing the quieter directions as well is part of understanding this material.
Fordite SS Rings · Soul Body Gems, September 2024.
Fordite brings industrial history into jewelry. Its flowing bands can look geological, but the material begins in a paint shop: many accumulated layers of automotive paint are cut and polished to reveal the patterns inside.
What is Fordite?
Fordite is a manufactured material, also called Detroit Agate or Motor City Agate. The agate names describe its banded appearance; it is not natural agate or a mineral species. The Detroit Institute of Arts Museum Shop explains that overspray built up on automotive paint-shop floors and fixtures, hardening through repeated baking processes. Eventually the accumulated material could be recovered and fashioned into decorative objects.
How the layers become a pattern
Imagine successive paint colors coating the same surface over time. A cut across that buildup exposes the sequence. As a lapidary changes the cutting angle and shapes the surface, layers appear as bands, curves, and nested outlines. The Dorman automotive publication Shop Press describes the relationship between repeated paint applications, curing, and the resulting layered material.
The carver or cutter is an essential part of the final appearance. A rounded cabochon reveals the layers differently from a flat slice. Two pieces from the same recovered mass may look quite different once shaped. That interplay between an accumulated material and a deliberate cut makes Fordite especially interesting as wearable art.
A record of making
Part of Fordite’s appeal is the idea of a working history preserved in color. Its origin is human activity rather than geological crystallization. Changing painting methods also affect what material is available. The museum shop describes collections with documented factory associations, including specific vehicle lines and Detroit’s Rouge Plant.
Such associations belong to a particular piece’s provenance. A swirl pattern alone does not prove which factory, vehicle model, or decade produced it. We distinguish a documented source from a general Fordite identification, rather than assigning an automotive story from appearance.
Our sterling silver pendants
The April 2025 photograph shows cabochons in sterling silver settings, with black, white, and colored layers arranged in tightly flowing patterns. Some pieces have centered outlines; others have waves that cross the surface. The settings frame those patterns without requiring every pendant to have the same shape.
The photograph below is an additional collection view. It is included here to show Fordite in finished jewelry; a separate image will be chosen for the main profile photograph.
Gem Knowledge includes the materials people encounter in jewelry, including manufactured decorative materials. Understanding what a piece is made of helps us appreciate its workmanship and its origin accurately. Fordite can be beautiful on its own terms: layered paint transformed into an object to wear and collect.
Moqui Marbles, also called Shaman Stones, are often kept as a pair in spiritual practice. In our original post, a “male” stone represents yang energy and a “female” stone represents yin energy. Together, they symbolize balance and complementary energies.
Working with the pair
The practice described in our post is to keep the two stones together and hold them at least once a week. That moment of care can become a simple ritual for grounding, reflection, and reconnecting with an intention.
Connection across time
In metaphysical traditions, Moqui Marbles are associated with ancestral wisdom and a felt connection to the past, present, and future. These are spiritual interpretations and personal practices.
Our original post
Swipe through the six original Soul Body Gems images below, beginning with “Moqui Marbles / Swipe to Read More.”
Vivid green fluorite from Peru, admired for its luminous crystals and contrasting mineral companions.
Origin and discovery
Our collection notes identify these specimens with the Atacocha mining district near Cerro de Pasco, Pasco, Peru, and a limited 2022 find. Published specimen records place green fluorite associated with geocronite at the Milpo mine in this district during July–August 2022. We retain the collection history without treating it as proof that no further material can be found.
Mineral companions
Fluorite from this district can occur with pyrite, sphalerite and minerals of the geocronite–jordanite series. Their presence varies between specimens; this page does not attach a laboratory identification to every dark inclusion visible in our video. “Emerald” describes the green color here, not the mineral emerald.
Metaphysical traditions
Within the crystal community, fluorite is commonly associated with protection, mental clarity and focus. Some people use it during study, meditation or intention setting as a reminder to pause, settle their thoughts and return their attention to the task at hand. These are spiritual beliefs and personal practices, not established medical effects or a substitute for healthcare.
A dark ornamental material celebrated for its soft, metallic-looking shimmer, especially when polished and turned in the light.
Science and naming
Hypersthene is a historical name still widely used by collectors and sellers for iron-bearing orthopyroxene in the enstatite–ferrosilite series. It is no longer recognized as a separate mineral species under modern mineral nomenclature. Precise naming depends on composition; the familiar market name remains useful for finding this material.
Material sold under this name is commonly brown, gray or greenish, with a glassy to pearly luster. Some polished pieces display bronze, reddish or silvery reflections. It often occurs in aggregates rather than isolated, well-formed crystals. Cleavage and brittleness mean it should be protected from knocks.
Metaphysical traditions
In crystal traditions, hypersthene is associated with grounding, protection and creating a quieter space for reflection. People may use it as a meditation companion or a symbolic reminder to step back from distractions, organize their thoughts and approach problems with a calmer perspective.
Descriptions of deeper awareness and inner journeys reflect spiritual beliefs and personal experiences. They are not scientifically established effects, medical advice or a replacement for professional care.
Brucite is magnesium hydroxide, Mg(OH)₂. Our collection notes identify these blue-green polished palms as material from the Bazhenovskoye deposit in Russia, a locality documented for blue brucite. The color shown in our video ranges from soft blue-green to deeper green, with cloudy pale areas.
Brucite is soft—about 2.5–3 on the Mohs scale—and has pronounced cleavage. Protect polished pieces from scratches, pressure and knocks; keep them separate from harder stones.
Metaphysical traditions
In crystal practices, blue brucite is associated with clarity, balance and a sense of renewal. Some people use it as a focus during meditation or chakra-based intention setting, treating its cool colors as a reminder to pause and regain perspective.
These are spiritual beliefs, not established medical effects. Brucite has not been shown to treat headaches, migraines, neuralgia or joint pain, and crystal practices should not replace medical care.
Pink halite from Searles Lake in California is a delicate collector’s mineral with translucent pink cubes and striking stepped surfaces. Halite is natural sodium chloride—the mineral form of rock salt—and forms as salty water becomes concentrated enough for salt to crystallize.
What are hopper crystals?
A hopper crystal has a recessed face framed by more developed edges. When its edges grow faster than the centers of its faces, the result can resemble a tiny stairway descending into the cube. Crystal-growth research documents this distinctive shape in sodium chloride.
The pink color at Searles Lake is associated with pigmented salt-loving microorganisms. Color and crystal-growth pattern are separate features: the pigment explains the pink appearance, while uneven growth creates the stepped geometry.
Care
Halite dissolves in water. Keep specimens dry, avoid rinsing or soaking, and protect the fragile crystal edges from handling and knocks. These mineral specimens are for display, not consumption.
Metaphysical traditions
In crystal traditions, pink halite is associated with emotional balance, gentle reflection and renewal. It may serve as a visual focus for quiet moments or personal intentions. These associations are beliefs, not proven treatments for stress or medical conditions.
Phenakite, also spelled phenacite, is a beryllium silicate with the formula Be₂SiO₄. Clear crystals can resemble quartz; its name comes from a Greek word meaning “deceiver,” reflecting that resemblance.
The bracelets in our collection were sourced as material from Høgtuva in Rana, Nordland, Norway. Published geological studies document phenakite at this locality, alongside other beryllium minerals. Høgtuva is also the type locality for the rare mineral høgtuvaite.
These studies describe the deposit and its minerals; they are not laboratory reports for these particular bracelets. We have not submitted this collection for separate Soul Body Gems testing.
Spirit & tradition
In metaphysical traditions, phenakite is associated with purifying light, heightened awareness and meditation focused on the upper chakras. Some practitioners use it during reflection on spiritual guidance, ancestors or a sense of connection with higher consciousness.
These are spiritual beliefs and personal practices, rather than established effects on glands or physical health. Crystal practices do not replace medical care.
Andean Opal is a trade name for greenish-blue opal from Peru. Its appeal lies in its body color, translucency and patterns, rather than the rainbow play-of-color associated with precious opal. Opal is hydrated silica, commonly written SiO₂ · nH₂O.
The Acarí mining area in the Arequipa region is a documented source of Peruvian blue opal. That is a known locality for the material generally; we do not have a specific mine recorded for the pendants shown here.
GIA describes Peruvian Andean opal as generally translucent and discusses its chrysocolla-rich geological setting. A blue color alone does not identify a material or establish the cause of its color. This profile does not assign a particular coloring mineral or treatment status to the pictured carvings without analysis.
What to look for
Color and pattern: Consider the balance of blue-green areas, lighter zones and any visible matrix.
Carving: Look at the detail, polish and condition of thin edges and projecting features.
Disclosure: Check the seller’s identification, origin information and any stated treatments. Appearance alone cannot confirm these.
Care
Opal’s hardness is approximately 5–6.5 on the Mohs scale, but resistance to scratching is different from resistance to breakage. Protect carvings from knocks, high heat and sudden temperature changes. Clean gently with warm soapy water; avoid steam and ultrasonic cleaning.
Metaphysical traditions
In contemporary crystal traditions, blue and green opal are associated with calm, gentle communication and emotional reflection. The dragon motif can also serve as a personal symbol of strength, protection or transformation. These are spiritual interpretations, not laboratory findings or medical effects. Crystal practices do not replace medical care.
Uvarovite is a green member of the garnet family: a calcium chromium silicate with the formula Ca₃Cr₂(SiO₄)₃. Chromium gives it its characteristic green color. It is an uncommon garnet, documented in Russia and several other countries.
Russian occurrences include the Ural Mountains. Uvarovite develops in chromium-rich geological settings, including altered chromite-bearing serpentinite and some metamorphic rocks. Our collection notes identify the pictured egg as Russian material; no specific mine or specimen-specific laboratory report is recorded here.
Small crystals, striking sparkle
Uvarovite is especially admired as druzy: a surface covered with many tiny crystals that sparkle together. These crystals are commonly too small for ordinary faceting, so jewelry often preserves their natural surface. It can also occur in granular or compact forms. The polished egg shown here has green areas within a contrasting dark matrix; it is not a druzy example.
Care
Uvarovite has a Mohs hardness of about 6.5–7, but it is brittle. A carving’s durability also depends on its matrix. Protect it from impacts and avoid harsh chemicals. Treat delicate druzy surfaces gently so projecting crystals are not damaged.
Metaphysical traditions
In contemporary crystal traditions, uvarovite symbolizes abundance beyond money: love, acceptance, peace and a willingness to receive support. Its green color is often associated with the heart chakra and a sense of connection.
Some people choose it as a reminder to honor their individuality while staying open to others, express feelings with kindness, or find contentment during time alone. As a gift, its uncommon beauty can symbolize a bond that feels precious and lasting. These are spiritual beliefs and personal meanings, not scientifically established effects or promises of wealth, healing or finding a partner. They do not replace medical care.
Firefly Quartz aka Petroleum Quartz · Soul Body Gems, September 2024.
Science: a hidden world inside quartz
“Firefly Quartz” is a descriptive trade name for quartz containing petroleum-related inclusions that can fluoresce under ultraviolet light. “Petroleum Quartz” describes the inclusions rather than a separate mineral species: the host is quartz, SiO₂.
GIA has documented petroleum-bearing quartz from Pakistan and Madagascar. Studied cavities can hold oil-like liquid, water, dark bituminous material and a gas bubble; their contents vary. Some bubbles move when the crystal is tilted.
Fluid inclusions form when fluids become sealed in cavities during crystal growth or the healing of fractures. It is not accurate to assume that water in every sealed cavity was later replaced by petroleum. Establishing the sequence and contents requires studying the particular specimen.
Why does it glow?
Petroleum inclusions can emit visible light when exposed to long-wave UV. GIA describes yellow-to-blue fluorescence and notes that a camera can record a different color from what the eye sees. The glow is fluorescence, not evidence of supernatural energy, and a UV reaction alone does not identify the inclusion. The source locality and inclusion chemistry of our pictured bracelets have not been established here by laboratory analysis.
Enjoying the details
Compare the piece in ordinary light and under an appropriate UV lamp.
Look for internal cavities, colored liquid, dark specks or moving bubbles without assuming every feature has the same identity.
Keep UV light away from eyes and follow the lamp manufacturer’s instructions.
Metaphysical traditions
In contemporary crystal practices, Petroleum Quartz is associated with the root chakra and themes of grounding, stability and connection to everyday life. Some people use it during meditation as a reminder to feel centered, establish boundaries and return their attention to the present.
Its contrast between a clear exterior and luminous inner details can also symbolize resilience and discovering light within oneself. These are spiritual interpretations, not established healing effects. Crystal use does not replace medical care or provide proven protection from physical harm.
About this page: A material profile with our collection image and published mineralogical context. Sources describe their own researched specimens; this profile is not a laboratory report for every pictured piece.
Our orange garnet rings
Our January 2025 collection includes spessartine garnet rings in sterling silver. The cover image shows faceted orange stones whose warmth contrasts with the cooler metal. Faceting gives a transparent gem a very different appearance from a polished opaque stone: as a ring moves, light is reflected from different internal and external surfaces. A photograph records only a moment in that movement. We retain the mineral name supplied with the collection, but do not assign a mining country to these rings from their colour or cut. The wider history of spessartine includes several important sources, and those examples provide context rather than a provenance claim for our jewellery.
The manganese-rich garnet
Spessartine is a manganese aluminium garnet, with the ideal formula Mn₃Al₂(SiO₄)₃. “Spessartite” is also widely encountered in gem trade usage. Garnet is a family of related minerals rather than a single red gemstone, and spessartine is one of the members that makes the family’s colour range particularly interesting. It belongs to the cubic crystal system. Natural crystals can develop the many-faced forms familiar to mineral collectors, while gem cutters reshape suitable transparent material into faceted stones. Spessartine is commonly orange, orange-red or brownish, with its composition influencing the appearance. Natural garnets can contain contributions from related garnet components rather than matching an ideal formula perfectly.
Colour and trade names
Manganese is central to spessartine’s identity, while differences in composition and absorption help produce the range seen in real stones. GIA discusses orange spessartine separately from orange hessonite, which belongs to the grossular branch of the garnet family. An orange colour alone therefore does not settle which garnet is present. Terms such as “mandarin garnet” may describe a desirable orange appearance in the trade, but they are not the names of separate mineral species and do not prove a mining locality. When comparing rings, look at hue, depth of colour and how evenly the appearance is distributed. A stone can be lively in one light and look darker in another, particularly when its cut or setting changes the path of light.
A documented pegmatite history
Spessartine is associated with some granitic pegmatites, rocks notable for their large crystals and occasional pockets of gem material. GIA’s 2001 study of material from Ramona, California, describes the Little Three mine as an important twentieth-century source. The study examines garnets from the Hercules Spessartite and Spaulding pegmatites and discusses their chemistry, absorption and inclusions. The analysed specimens were rich in the spessartine component, with a smaller contribution from almandine. This illustrates how a familiar gem name can encompass chemical variation. It also shows why an important historic source should be discussed as a documented example, rather than assumed to be the origin of every orange garnet in a modern jewellery collection.
Cut, inclusions and choosing a ring
A well-proportioned cut helps light return to the viewer rather than disappearing through the centre or leaving broad dark areas. Examine a gem while tilting it gently, noticing whether the central area remains lively and how its orange colour relates to the silver setting. Natural inclusions can be part of a stone’s individual character. Published studies describe features such as healed fractures and small internal crystals in spessartine; these should not be assigned to a particular ring from a distant photograph. Clarity, colour, size and workmanship all contribute to a finished piece, and personal preference matters alongside standard gem-quality descriptions. Our archive video is useful for seeing movement that the cover photograph cannot convey.
Wearing, cleaning and personal meaning
Spessartine has a Mohs hardness of about 7–7½, but hardness describes resistance to scratching, not immunity to a sharp knock. Protect a ring from heavy work and impacts against hard surfaces. Warm soapy water is a sensible cleaning choice. GIA advises against steam cleaning garnet, and stones with fractures or possible filling need particular care; avoid assuming an ultrasonic cleaner is suitable without knowing the individual gem’s condition. Keep the ring separate from other jewellery to protect both its stone and setting. Some people choose orange garnet as a symbol of enthusiasm, creativity or renewed energy. These are personal associations rather than established health effects. Its place within the garnet family, colour chemistry and gem-mining history provide a rich foundation for appreciating the ring itself.
Golden Hills Turquoise SS Rings · Soul Body Gems, November 2024.
About this page: A material profile with our collection image and published mineralogical context. Sources describe their own researched specimens; this profile is not a laboratory report for every pictured piece.
Our Golden Hills collection
The Golden Hills turquoise in our January 2025 collection was supplied to Soul Body Gems as material from Kazakhstan. The photograph shows pale blue to blue-green stones in sterling silver settings, with brown matrix creating branching lines and irregular islands of colour. Those patterns are part of what makes each piece individual: a ring can feel like a small landscape rather than a uniform blue surface. “Golden Hills” is a trade and locality label used for this turquoise, rather than the name of a separate mineral species. We retain that collection name while distinguishing it from the mineral identification, turquoise. The collection record does not establish an exact mine, extraction date or treatment history, so those details are not assigned from the name alone.
What turquoise is
Turquoise is a hydrated copper and aluminium phosphate. Its familiar colour belongs to a mineral whose formation depends on water moving through a suitable geological setting. In arid regions, circulating groundwater can carry dissolved copper and react with aluminium- and phosphorus-bearing material to produce turquoise. This is quite different from imagining a blue stone simply crystallising from a pool of molten rock. It is a product of chemical alteration and mineral growth within an existing landscape. Turquoise is generally opaque, although very thin areas can be somewhat translucent. It has long been shaped into cabochons, beads, inlays and ornamental objects. Its appeal comes from colour, surface texture and pattern rather than the sparkling facets associated with transparent gemstones.
Colour, texture and matrix
The word matrix describes remnants of the surrounding rock or associated material visible within a turquoise piece. In our Golden Hills jewellery, the contrast between light blue areas and warm brown markings is especially noticeable. A fine line of matrix can connect two areas of colour; a broader patch can make a stone look mottled or webbed. The pattern alone cannot prove a particular mine. It is more useful to look at each piece as a combination of colour distribution, matrix placement and finished shape. Gemological descriptions often discuss turquoise quality through colour, texture and matrix. Personal preference is equally important when choosing a patterned stone: some collectors seek an even field of blue, while others are drawn to the movement and individuality of the host-rock markings.
Looking at a finished piece
When viewing a ring, notice how the cutter has placed the strongest area of colour within the outline. Follow the matrix from one edge to another and consider how it works with the silver setting. Compare photographs taken in soft daylight with those under bright indoor lighting; a pale blue stone can look markedly different against warm skin, white paper or a dark background. A photograph is useful for documenting these differences, but it cannot determine stabilisation, dyeing or every other possible treatment. Treatment information should come from the supplier’s records or appropriate examination. We do not describe the collection as untreated simply because its colour looks natural. The January archive preserves how these particular pieces were presented in our collection.
Wearing and caring for turquoise
Turquoise has a Mohs hardness of about 5–6, and its porosity makes its care different from that of quartz. Keep it away from perfumes, cosmetics, harsh cleaning products and prolonged contact with oily substances. Put jewellery on after applying lotions or fragrance. Avoid steam and ultrasonic cleaners, as well as excessive heat. Use gentle cleaning with warm soapy water when suitable for the setting and known treatment, then dry it carefully; prolonged soaking is unnecessary. Store it separately from harder gems that could scratch the surface. When cleaning sterling silver, keep polishing compounds and chemical dips away from the stone. A jeweller can advise on the safest way to clean an intricate setting without exposing the turquoise to unsuitable products.
Meaning and collecting
Some people choose turquoise as a personal symbol of protection, friendship or a connection with the outdoors. Those meanings belong to cultural traditions and individual interpretation, rather than measurable medical effects. For our collection, the visible combination of cool blue and earthy brown offers its own point of connection. A useful collecting record includes the trade name, stated country, seller, purchase date and any supplied treatment information. Keeping these details alongside a photograph makes future comparisons more meaningful than relying on colour alone.
About this page: A material profile with our collection image and published mineralogical context. Sources describe their own researched specimens; this profile is not a laboratory report for every pictured piece.
Our Milpillas collection
Our January 2025 photograph shows an assortment of bright blue shattuckite specimens supplied as material from Milpillas, Mexico. These are mineral specimens whose interest lies in their natural surface textures as well as their colour. Unlike a single faceted jewel, a specimen can contain several growth areas, remaining host rock and associated minerals. The appearance may change as it is turned, with the light catching raised clusters and softer-looking blue surfaces. The collection’s stated locality is important, but the photograph does not identify a particular mining level or discovery pocket. Published accounts of Milpillas material provide geological and collecting context; they are not a claim that our pieces came from the exact discoveries described in those accounts.
The mineral behind the blue
Shattuckite is a copper silicate with the formula Cu₅(SiO₃)₄(OH)₂. It belongs to the orthorhombic crystal system and commonly occurs as aggregates of slender, needlelike crystals rather than large, transparent crystals suitable for conventional faceting. These aggregates can produce a silky appearance or form rounded clusters. The mineral is named after the Shattuck mine at Bisbee, Arizona, its type locality. Its blue colour and copper chemistry place it within a fascinating family of secondary minerals formed as copper-bearing rocks change near the surface. Shattuckite is not the same mineral as chrysocolla, even though the two may occur together and both can contribute blue or blue-green areas to a specimen.
Milpillas and documented discoveries
Milpillas lies near Cuitaca in Sonora, northern Mexico. A Mineralogical Record field report describes a January 2019 discovery at the mine’s 1100 level. In that account, deep blue shattuckite first appeared as felted inclusions within colourless quartz; a later generation formed sky-blue, rounded coatings on matrix, associated with pale green chrysocolla. This is a useful example of how a mineral can take more than one form even within a single locality. “Botryoidal” means a surface resembling a cluster of grapes, while “acicular” describes needlelike crystals. Those terms help explain specimen shapes without suggesting that every blue area has identical chemistry. The published discovery date belongs to that documented find, not to all shattuckite offered under the Milpillas name.
How this kind of specimen forms
Shattuckite is associated with the oxidised zones of copper deposits, where pre-existing minerals react with water and oxygen and copper can be redistributed. Silica and the local chemical environment help determine which secondary minerals develop. A specimen therefore records a sequence of changes rather than a single moment of formation. Quartz, chrysocolla, malachite and other minerals may accompany shattuckite, depending on the locality and the particular growth environment. Colour alone cannot reliably separate all of these materials. Where exact identification matters, examination or analysis is more informative than matching a specimen to a photograph. Our page uses the supplied collection identification and explains the mineral generally; it does not present a new laboratory determination of every constituent in the pictured assortment.
What to look for
View a specimen first as a whole, then study the edges of the blue growth. Does the surface consist of tiny rounded mounds, fibrous patches or more angular structures? Are there clear crystals over the blue material, or exposed areas of host rock? Soft side lighting often reveals relief better than direct frontal light. A magnifier can help show why a surface appears silky, but avoid pressing the lens against the specimen. Photographing the same piece from several angles provides a useful record of fragile edges and associated minerals. A locality label should stay with the specimen, particularly if it is later moved between display cases or passed to another collector.
Care and personal meaning
Shattuckite is comparatively soft, around Mohs 3½, and fine crystal aggregates can be easily damaged. Handle specimens by a stable part of their matrix rather than rubbing the blue growth. Avoid scrubbing, abrasive polishing, chemical cleaners and ultrasonic cleaning. For delicate specimens, careful dry dusting with a very soft brush is usually a better starting point than soaking; seek advice if the matrix or associated minerals are unstable. Keep pieces in padded individual compartments during transport. Some collectors associate blue minerals with calm or communication as a personal practice. That interpretation can sit alongside an appreciation of the mineral’s geology, but it is not evidence of a therapeutic effect.
About this page: A material profile with our collection image and published mineralogical context. Sources describe their own researched specimens; this profile is not a laboratory report for every pictured piece.
Our Australian boulder opal
The January 2025 collection includes sterling silver pendants in which blue opal areas contrast with brown host rock. That contrast is central to boulder opal’s character: the surrounding rock becomes part of the finished gem’s appearance. A piece may show a narrow ribbon of colour, a broader blue field or small flashes that appear only when the light reaches it at a particular angle. Our collection is labelled Australian boulder opal. That identifies the country and material category, but it does not establish a particular Queensland mining field for these pendants. We keep the source label with the collection while using documented Australian localities to explain the wider geological setting.
Why the host rock stays
Boulder opal is associated especially with Queensland, where opal can occur in seams and cavities within ironstone. Well-known fields include the areas around Quilpie, Yowah and Koroit. GIA’s field reporting from Australia describes how cutters work with these natural combinations of opal and rock. A thin seam may be too irregular to shape into a conventional uniform cabochon, yet it can become a striking gem when the outline follows the material. Retaining the host rock supports and displays the opal within its natural setting. The brown part is therefore not automatically a flaw to remove. Its placement, strength and contrast with the opal help determine how the finished piece is cut and presented.
Understanding play of colour
Opal is hydrated silica. In precious opal, an ordered arrangement of tiny silica spheres can diffract light, producing the shifting colours known as play of colour. This is different from a stone simply being blue or green throughout. A body colour may remain visible while flashes of another colour appear, move or disappear as the gem is turned. Common opal does not show the same play-of-colour phenomenon. Within one boulder opal piece, the distribution of precious opal, common opal and host rock can create a mixture of steady colour and changing flashes. A still photograph captures only one lighting arrangement. Video is particularly helpful because movement reveals parts of the pattern that a single image may miss.
Reading the pattern
Look at the relationship between the opal and the brown ironstone before focusing on the brightest flash. Does the colour form a vein across the piece, several separate pools or a fine network? Notice whether it appears strongest when viewed face-on or at a slight angle. These observations describe the gem’s individuality and can help you choose a pendant you enjoy in everyday lighting. They are not enough to determine the exact mine or all aspects of construction. Ask for a clear description of a finished piece, including any treatments or assembly information supplied with it. The trade name should describe the material honestly; a natural-looking backing in a photograph is not, by itself, a complete examination of how a jewellery stone was made.
Cutting, setting and viewing
An irregular outline can be a deliberate response to the seam, preserving colour that would be lost in a standard oval or circle. Silver settings may follow that outline or create a contrast between organic stone patterns and a more regular frame. When comparing photographs, use a consistent light source and background. Strong spotlights can emphasise brief flashes, while diffuse daylight helps show the overall appearance. Neither view is the whole story. Consider how the pendant sits when worn, because its resting angle determines which areas are most often visible. Our Memory Lane video records the January collection in motion and provides a useful companion to the cover image on this page.
Caring for boulder opal
Opal has a Mohs hardness of roughly 5–6½ and requires gentle handling. Protect it from sharp impacts, excessive heat and sudden temperature changes. GIA recommends warm soapy water as the safe cleaning method for opal; avoid steam and ultrasonic cleaners. Do not use silver dips or aggressive chemicals on the stone. Dry the setting carefully and keep the pendant separate from harder gems in storage. Known treatments or assembled components can require additional precautions, so retain any care information supplied with a specific piece. For some people, opal’s shifting colour becomes a personal symbol of creativity or change. Those associations are individual meanings, while its geological story is the remarkable meeting of silica, water, light and host rock.
About this page: A material profile with our collection image and published mineralogical context. Sources describe their own researched specimens; this profile is not a laboratory report for every pictured piece.
Our Greenland material under UV
Our January 2025 photograph shows rough tugtupite material from Greenland under ultraviolet illumination. The pink and purple appearance in this image is a record of the lighting used, rather than a daylight colour chart. That distinction matters for a mineral whose attraction includes its response to light. Rough pieces can contain tugtupite alongside other minerals, and not every part of a mixed specimen necessarily reacts in the same way. We retain Greenland as the supplied origin. The image does not establish a particular mine pocket, the concentration of tugtupite in every fragment or the wavelength of the lamp used. It is an invitation to look more closely at the material and the conditions under which it is photographed.
Discovery in southern Greenland
Tugtupite was discovered in 1957 in the Ilímaussaq region of southern Greenland and initially discussed as a beryllium-bearing relative of sodalite. The mineral received its approved name in 1965. GIA’s 1982 account describes its discovery at Tugtupagtakorfia near the Tunugdliarfik fjord and later gem material associated with the Kvanefjeld area near Narsaq. Its geological setting includes unusual alkaline rocks, with tugtupite developing in hydrothermal veins containing albite. This history helps explain why Greenland is so closely connected with the gem’s identity. The historical account documents particular discoveries; it should not be used to assign every modern specimen to the same vein or to treat an older list of occurrences as a complete present-day distribution.
An unusual mineral structure
Tugtupite is a sodium, beryllium and aluminium silicate containing chlorine. One way of writing its composition is Na₄[BeAlSi₄O₁₂]Cl. The framework and the atoms or defects within it are important to its optical behaviour. Research published on tugtupite’s luminescence discusses sulphur-related molecular ions and colour centres within the structure. Small-scale differences in that environment can affect the visible response. This is a reminder that a mineral’s colour is not simply a matter of its broad chemical name: very small amounts of particular constituents and structural features can have a large optical effect. A photograph can show a response, but it cannot reveal all the chemical mechanisms in a specific specimen.
Fluorescence and changing colour
Fluorescence occurs when a material absorbs ultraviolet radiation and emits visible light while it is being illuminated. It is not the same as a surface being painted pink, and it is not a glow caused by heating the stone. Tugtupite is known for striking fluorescence, with the appearance influenced by the material and the lamp conditions. Published gemological observations also describe reversible changes in colour associated with light exposure, commonly discussed as tenebrescence or photochromism. These effects should be distinguished: an immediate luminous response under a lamp and a colour change that remains visible after exposure are different observations. A specimen can be interesting even if its response is weaker than an especially dramatic photograph taken under another lamp.
How to document a specimen
A useful record includes a daylight photograph, an image under the chosen UV lamp and a note of the lamp’s stated wavelength. Keep the camera position and exposure as consistent as possible when comparing pieces. Observe whether the brightest areas follow particular veins or patches. If you are studying a colour change, compare ordinary-light images before and after exposure rather than comparing an ordinary-light image directly with a UV image. Avoid assigning every fluorescent patch to tugtupite solely from its colour: associated minerals may also respond. These simple records preserve what was actually observed and make it easier to discuss a specimen without turning one striking image into a universal claim about the mineral.
Handling, care and meaning
Handle rough pieces carefully, especially around sharp edges, cracks and mixed-mineral boundaries. Store them separately in padded compartments and avoid abrasion, chemical cleaners, heat and ultrasonic cleaning. If cleaning is needed, consider the entire specimen rather than assuming all its components share one set of properties. Use UV equipment according to its manufacturer’s instructions and avoid directing the lamp into anyone’s eyes. Some collectors connect tugtupite’s changing appearance with affection, renewal or personal transformation. These are symbolic interpretations, not established health effects. Its documented Greenland history and unusual light behaviour already offer a rich story for anyone who enjoys the relationship between mineral structure and visible colour.
About this page: A material profile with our collection image and published mineralogical context. Sources describe their own researched specimens; this profile is not a laboratory report for every pictured piece.
Our Russian palm stones
Our January 2025 collection contains polished palm stones supplied as Yooperlite from Russia. The photograph on this page shows their appearance in ordinary light: black, grey and white areas form a textured pattern across the smooth surfaces. The colourful ultraviolet response is not pictured in this particular image. “Yooperlite” is a trade name associated with fluorescent sodalite-bearing rock; it is not the name of a newly recognised mineral species. Keeping “Russia” in the title matters because the history of the trade name begins elsewhere. The collection label does not supply an exact Russian quarry or a complete analysis of the rock, so we do not assign either from the palm stones’ appearance alone.
Where the name comes from
The widely shared Yooperlite story begins with Erik Rintamaki finding fluorescent beach stones in Michigan’s Upper Peninsula in 2017. “Yooper” refers to a person from the U.P., and the name grew from that local connection. A research account reproduced with the original discovery story describes examination of Michigan material using electron-microscope and microprobe methods, identifying the fluorescent constituent as sodalite. The researchers were careful about the name of the entire rock: its apparent syenitic character was discussed without claiming that a complete whole-rock classification had already been established. That distinction remains useful when the trade name is applied to material from other countries. A Russian specimen does not become Michigan material because it shares a nickname and an optical effect.
Sodalite and the surrounding rock
Sodalite is a sodium aluminium silicate containing chlorine, commonly written Na₈Al₆Si₆O₂₄Cl₂. It belongs to the feldspathoid family and occurs in certain silica-poor alkaline rocks, including nepheline syenites. A polished sodalite-bearing rock is a mixture of minerals, rather than necessarily a solid piece of sodalite. Dark and pale grains can be part of that mixture. Russia’s Kola Peninsula contains famous alkaline complexes, including Khibiny and Lovozero, where sodalite and related minerals are documented. Those localities provide regional context, but they do not prove the exact origin of our particular palm stones. Naming every visible grain from a photograph would go beyond what the collection record establishes.
Why ultraviolet light changes the view
Some sodalite produces a strong red to orange fluorescent response under suitable ultraviolet illumination. The effect depends on features within the mineral structure, including small amounts of constituents involved in light-emitting centres. Research on sodalite-related minerals from Lovozero examines how sulphur-bearing components and structural differences contribute to their optical properties. The same mineral family can therefore show different colours and strengths of response. The lamp’s wavelength, power, distance and the room lighting also influence what you see. A vivid image taken in darkness is not a reliable guide to how the stone looks on a sunlit shelf. The ordinary-light pattern and the UV response are complementary views of the same specimen.
Comparing and recording your piece
Start with a clear daylight photograph so the stone’s grain pattern is recorded. Then take a separate photograph under a suitable UV lamp, noting its stated wavelength. Look for whether the luminous areas follow particular grains, form a fine network or occur in broader patches. Keep the camera exposure similar when comparing two specimens; automatic settings can make a weaker response look brighter than it really is. Fluorescence is a useful observation, but the colour of the glow alone is not a complete mineral analysis. A simple label containing the supplied origin, seller and acquisition date protects the piece’s collecting history more effectively than relying on a nickname alone.
Care and collecting meaning
Sodalite is comparatively modest in hardness, around Mohs 5½–6, and a mixed rock can have constituents with different strengths. Protect polished palms from impacts and from rubbing against harder stones. Use gentle cleaning rather than abrasives, chemical dips, steam or ultrasonic treatment. Avoid prolonged soaking where cracks or uncertain components are present. When enjoying the UV effect, follow the lamp manufacturer’s handling instructions and keep its beam away from eyes. Some people use fluorescent stones as a personal reminder that familiar objects can reveal something unexpected under a different light. That is an individual interpretation, not a medical property. For a mineral collector, the equally engaging story is how chemistry and texture become visible through a change in illumination.
About this page: A material profile with our collection image and published mineralogical context. Sources describe their own researched specimens; this profile is not a laboratory report for every pictured piece.
Our Russian eudialyte palms
The January 2025 photograph shows polished palms supplied as eudialyte from Russia. Pink areas stand out against black and lighter material, creating a mottled pattern that remains interesting across the whole surface. These pieces are best appreciated as patterned mineral-bearing rock, rather than assuming that every visible area is pure eudialyte. The stated country is part of our collection record. The photograph does not identify the exact mine, the chemical composition of the pink grains or the identity of every dark and pale constituent. Those limits leave plenty to observe: the distribution of colour, the boundaries between grains and the way a polished surface reveals the original rock’s texture.
What eudialyte means
Eudialyte belongs to a complex family of sodium-, calcium- and zirconium-bearing silicate minerals. The eudialyte group contains related species distinguished by chemical and structural differences, so a trade label on a polished rock is not necessarily a species-level determination for every grain. Eudialyte itself may be pink, red or brown and is often encountered as grains or irregular masses within its host rock. It has a Mohs hardness of approximately 5–6 and is brittle. Its name refers to being readily dissolved, a useful reminder that mineral identity includes chemical behaviour as well as appearance. Acid should not be used as an informal identification experiment on a collection piece.
Russia’s alkaline-rock setting
Eudialyte-group minerals are particularly associated with unusual alkaline igneous rocks, including nepheline syenites and their related pegmatitic rocks. Russia’s Lovozero and Khibiny complexes on the Kola Peninsula are important documented localities. In these environments, minerals can contain unusual concentrations of elements that are less abundant in more familiar rocks. Eudialyte may occur alongside feldspar, nepheline, aegirine, arfvedsonite and sodalite, depending on the setting. Those are examples of documented associations, not identifications of every coloured patch in our photograph. The regional geological story helps explain why Russian eudialyte is of interest, while an exact provenance still requires information that travels with the individual specimen.
Why researchers study it
Eudialyte is more than a decorative pink mineral. Its composition can help scientists investigate how alkaline magmas evolved and how elements were distributed as minerals crystallised. A 2020 study of the Lovozero complex examines eudialyte-group mineral chemistry in relation to the history of the layered intrusion. Other structural research explores the family’s capacity to accommodate different elements within its framework. Zirconium, rare-earth elements and other constituents make these minerals useful subjects for understanding unusual geological systems. That scientific interest should not be confused with an assay of our palm stones. A published analysis of a locality specimen does not determine the concentration of an element in a separately acquired polished piece.
Looking closely at the pattern
Study where the pink areas meet the dark and pale parts of a palm stone. Are the boundaries sharp, or does the colour form a fine speckled mixture? Do the grains align in any direction, or appear scattered? These are observations of texture that can be recorded without assigning every mineral a name. A hand lens and gentle side lighting may reveal more detail than a strongly lit frontal photograph. Turning the stone slowly helps separate its body colour from reflections on the polish. Photograph both sides if the pattern differs, and keep a label with the stated origin and purchase information. A record of the entire piece is often more useful than a close-up of its brightest patch alone.
Care and personal associations
Treat eudialyte palms as brittle, mixed-mineral objects. Protect them from drops, knocks and abrasion by harder gems. Avoid acids, harsh chemical cleaners, steam and ultrasonic cleaning. Gentle wiping is a sensible starting point for a polished surface; if water is used, keep cleaning brief and dry the stone carefully rather than leaving it to soak. Fine cracks and constituent minerals may require extra care. Some people associate its pink and dark pattern with balance, compassion or a connection to the earth. Those are personal or spiritual interpretations, not laboratory findings or established treatments for illness. Its documented mineral chemistry, Russian geological context and individual pattern provide a substantial story alongside any meaning a collector chooses for it.
Collection profile: Our photograph accompanies published mineralogical context. Locality research describes the specimens studied by its authors.
Our Pinolite collection
The February 2025 photograph shows rounded palm stones with an intricate network of pale, elongated grains outlined by dark material. Some grains look like small petals; others form a crowded mosaic with intersecting lines and irregular islands of white. The polish brings that contrast into focus without erasing the underlying texture. Pinolite is especially satisfying to compare across several pieces because the pattern changes continuously. A single palm can show broad pale areas on one side and a much finer network on the other.
A rock made of several minerals
Pinolite, also spelled pinolith, is a rock name rather than a separate mineral species. The classic Austrian material combines white magnesite with dolomite and graphite. The Munich State Mineral Collection explains its name through the resemblance of its pale grains to pine nuts. This distinction matters: a polished palm is an assemblage, and its appearance comes from the arrangement of several components rather than a single uniform crystal. Magnesite is magnesium carbonate, MgCO₃; dolomite contains both calcium and magnesium, CaMg(CO₃)₂.
The Austrian geological story
Austria is particularly associated with pinolite. The Hohentauern/Sunk deposit in the Eastern Alps is a well-studied example, with pinolite, rosette and striped textures. Research at Montanuniversität Leoben interprets its magnesite in terms of magnesium-rich fluids replacing dolomitic host rock. Replacement is a chemical transformation within an existing rock: fluid moves through it, and new minerals develop as the older material reacts. The study examines several stages of dolomite and magnesite formation, showing that a striking decorative pattern can preserve a complicated geological history. That regional account supplies context; an exact source for an individual palm depends on its accompanying collection records.
The newer Canadian discovery
A major newer source was discovered in 2018 by placer gold miners at Quartz Creek near Golden, British Columbia. A 2021 Geoscience Canada study documents the occurrence and the development of North America's first pinolite quarry. The rock has elongated magnesite grains in a dark, mixed-mineral matrix; its constituents need not exactly match every Austrian specimen. The Canadian supply changed the collecting landscape. In Soul Body Gems' sourcing experience, its wider availability made carved and polished Pinolite much more affordable, opening the material to more collectors. That affordability is our market experience rather than a price conclusion measured in the geological study.
How to read the pattern
Begin by following one pale grain to its boundary. Does it meet another pale grain directly, or is there a dark rim between them? Then widen your view. Look for areas where the grains are similarly oriented and areas where they are scattered. Compare coarse patches with finely textured ones. These observations are useful even without assigning a geological cause to every feature. A hand lens and soft side lighting help separate the rock's markings from reflections on the polished surface. On a sphere, rotate it slowly to see how the pattern wraps around the entire form; on a palm, compare its two faces and the curved edge.
Care for polished Pinolite
Magnesite has a Mohs hardness of approximately 3½–4½, while dolomite is around 3½–4. Both are brittle, so a smooth polish does not make this a particularly scratch-resistant stone. Keep palms apart from quartz, sapphire and other harder materials. A soft cloth is a useful first choice for removing dust; avoid abrasive pads, acidic cleaners, steam and ultrasonic cleaning. Protect edges from knocks and avoid leaving a piece soaking. Resting it on a padded surface also makes close examination easier without risking a fall.
Collecting for texture
Pinolite offers an alternative to collecting by colour alone. Its interest lies in spacing, contrast and the changing relationships between grains. Photograph both sides when documenting a piece, and retain the seller's locality information alongside the image. A collection of palms and spheres can reveal how different cuts highlight different parts of the same kind of rock. At Soul Body Gems, the appeal is that meeting between natural structure and the artist's chosen shape: each polished surface invites a closer look.
Collection profile: Our photograph accompanies published mineralogical context. Locality research describes the specimens studied by its authors.
Our Malachite freeforms
Our February 2025 photograph brings together polished freeforms with an exceptional variety of green patterns. Some have large circular eyes, while others contain fine rippling lines or tightly clustered rings. Deep green areas sit beside brighter bands, creating an impression of movement across a still surface. The freeform outlines allow the pattern to lead: each piece has a different balance of broad curves, points and rounded edges. These are shapes for observing the stone from several angles, rather than viewing only a single face.
The mineral behind the green
Malachite is a copper carbonate hydroxide, Cu₂CO₃(OH)₂, in the monoclinic crystal system. Its copper chemistry produces its familiar green colour. It commonly develops in the oxidised zones of copper deposits, where pre-existing copper-bearing minerals undergo change. Associated minerals can include azurite, cuprite, chrysocolla and calcite. Well-known occurrences include the Democratic Republic of the Congo and the Ural Mountains of Russia, among many others. A green banded surface alone cannot identify a country or mine, so those regional examples are geological context rather than a provenance assigned to our pictured collection.
Where the bands come from
Malachite can grow as rounded, grape-like aggregates, stalactitic forms and masses with a radiating fibrous interior. Cutting and polishing these structures exposes bands and curved sections through their growth. That helps explain why an eye-like pattern and a flowing ribbon can appear within the same piece. The visible pattern depends on both the original growth and the direction of the cut. Colour can range from bright to very dark green; the darkest areas may look nearly black in a photograph, especially beside strong reflections.
Looking closely at a freeform
Choose one circular feature and follow its rings outward. Notice where a ring becomes interrupted or merges into a neighbouring pattern. Then look at the edge of the carving: a band that seems to end on the front may continue around its side. Soft, diffuse lighting is helpful because a bright reflection can conceal very fine lines. Comparing front, back and side views gives a fuller impression than one strongly lit image. The photograph records the arrangement beautifully, but holding or rotating the piece reveals how its surface and internal pattern work together.
Natural material, synthetics and imitations
Three different ideas should be kept distinct. Natural malachite forms geologically; synthetic malachite is grown by people with the mineral's chemistry and structure; an imitation may be a different substance chosen to resemble it. GIA documents glass that imitates malachite and research into distinguishing natural from synthetic material through trace-element analysis. Its researchers also note the limitations of their study's sample size. Colour and banding are therefore valuable observations, but a quick visual rule is not a complete identification method. Supplier records and suitable gemological examination matter when authenticity or treatment is in question.
Care and display
At approximately Mohs 3½–4, malachite is softer than many familiar gemstones and deserves gentle handling. Store polished pieces where harder stones cannot rub against them, and support freeforms securely so they cannot roll or tip. Begin cleaning with a soft cloth and avoid abrasive scrubbing, acids, chemical dips, steam and ultrasonic treatment. Keep the polished finish away from rough shelf surfaces. A protected display lets the pattern remain the focus, while photographs of several sides preserve the individuality of the piece in your collection record.
Collection profile: Our photograph accompanies published mineralogical context. Locality research describes the specimens studied by its authors.
Our Norwegian Thulite carvings
The February 2025 collection shows Ganesha carvings supplied as thulite from Norway. Their colour varies from vivid pink to deeper red-pink areas, with pale streaks and patches crossing the carved surfaces. Even within a group sharing the same subject, each carving has its own visual rhythm. A pale line may pass over a shoulder or across the base, while a darker area makes another feature stand out. The finished pieces bring together the geological texture of the material and the carver's decisions about shape, proportion and detail.
What Thulite is
Thulite is the pink, manganese-bearing variety of zoisite, a calcium aluminium silicate in the epidote group. It is a variety name, not a separate mineral species. Zoisite also includes blue-to-violet tanzanite, although these familiar names describe very different appearances and uses. The opaque or partly translucent massive material used for thulite carvings lends itself to observing colour distribution and texture rather than the transparency sought in faceted tanzanite. Pink colour alone does not identify zoisite: several unrelated minerals can be pink.
Norway and its documented localities
Norwegian mineralogical references describe thulite from Sauland in Telemark, where it was first described in 1823, as well as Leksvik and the Lom area. Its name refers to Thule, the historic northern place-name. Geological Survey of Norway records also document a thulite occurrence at Austre Brannsfjellet in Lierne, discovered during mapping in 1991; sample material was collected in 1992 and studied as polished slices. These records show why Norway has a strong place in thulite's mineralogical story. They describe particular documented occurrences, while our collection label establishes Norway without assigning these carvings to one of those precise sites.
A metamorphic mineral
Zoisite commonly develops in calcium-rich rocks transformed by metamorphism. Heat, pressure and chemical reactions reorganise minerals within a solid rock; the process need not involve complete melting. Zoisite may occur with minerals such as quartz, calcite, garnet or albite, depending on the setting. A finished carving can preserve contrasting areas of the original rock, but a photograph does not identify every pale streak or darker patch. Examining mineral grains and their chemistry is what lets geologists move from an attractive pattern to a supported account of the material.
Reading colour through a carving
Look first at the distribution of pink across the entire object. Then compare the smooth base with the deeply worked features. Shadows in carved recesses can make colour seem darker than it is, while polish creates bright highlights on raised surfaces. A second photograph from the side can separate those lighting effects from actual changes in the stone. Notice how the carver has retained the larger block's pattern: bands do not stop at the outline of a hand or garment simply because the form changes. That continuity is part of the pleasure of a mineral carving.
Care, detail and collecting
Zoisite has a Mohs hardness of about 6–7, but it is brittle and has cleavage, so hardness should not be mistaken for resistance to a fall. Protect projecting carved details from knocks and support the piece on a stable, padded surface. Use gentle cleaning with a soft cloth or soft brush; avoid steam, ultrasonic cleaning and harsh chemicals, particularly where fine cracks or mixed material may be present. Keep the supplied country, acquisition information and photographs together. The Ganesha form contributes its own artistic and cultural meaning, while the material's mineral identity and Norwegian context offer a separate geological story to explore.
Roman Glass SS Earrings · Soul Body Gems, September 2024.
Our Roman Glass collection
Soul Body Gems acquired this material as a newer find from Pakistan, with an estimated age of around 2,000 years. These are the sourcing details accompanying our collection. “Newer find” refers to its recent discovery or arrival on the market, while the estimated age refers to the glass itself. We preserve that distinction because something ancient can be newly available to collectors. The photograph shows the raw collector pieces before considering the polished rings and rose-cut bracelets elsewhere in our February archive.
Glass in the Roman world
Roman glass belongs to the history of human craftsmanship rather than the mineral species in a crystal collection. Glass is generally amorphous: its atoms do not form the repeating long-range structure of a crystal. Archaeological scholarship describes Roman soda-lime-silica glass made using sand and a sodium-rich flux, with calcium contributing to the composition. Ian Freestone's overview explains a system in which primary glass was produced in large furnaces and transported as chunks to workshops that fashioned vessels, sheets and beads. Manufacture and finishing could therefore happen in different places.
From luxury to everyday life
The development of glassblowing in the first century BCE transformed production. The Royal Ontario Museum describes how blowing into molten glass allowed vessels to be made more quickly and widely. The Metropolitan Museum of Art documents glass across daily life: perfume containers, tableware, storage vessels, jewellery and architectural uses. Casting and other techniques continued alongside blowing. This variety makes glass a particularly rich historical material, connecting artistic skill with ordinary activities such as storing food, wearing jewellery or carrying a precious fragrance.
Pakistan, age and the collection record
A recovery country and a manufacturing origin answer different questions. Material supplied from Pakistan need not have been manufactured there, and the Roman Glass name alone cannot identify a workshop or a specific ancient object. For our pieces, the approximately 2,000-year estimate is the supplied collection history, rather than a laboratory date determined from these photographs. The exact archaeological site and manufacturing centre are not assigned here. Recording that history alongside the images allows the collection's story to remain useful without turning an estimate into a more precise claim than the evidence supports.
Why ancient surfaces can glow
Some ancient glass develops iridescent surfaces during long interaction with its environment. A 2023 PNAS study analysed a Roman glass fragment from Aquileia, Italy, showing how weathering and silica reorganisation produced extremely fine layered structures that changed reflected light. Its original glass colour differed from its metallic-looking surface. That is a scientific example of structural colour, where arrangement on a tiny scale influences what the eye sees. It explains a possible mechanism for ancient iridescence; it does not establish the age or composition of every colourful shard. Nor does a weathered appearance alone authenticate an object.
Raw pieces and modern jewellery
A raw fragment, a polished cabochon and a newly cut rose-cut stone can show different sides of the material. The finished jewellery is modern craftsmanship using glass presented as ancient, rather than a claim that the current ring or bracelet was made by a Roman artisan. When comparing pieces, notice transparency, surviving surface texture, thickness and the placement of colour. Avoid rubbing or polishing a delicate weathered surface, since its layers may be fragile. Store collector fragments on a soft support, keep sharp edges protected, and clean cautiously rather than soaking or using chemical dips, steam or ultrasonic equipment.
Roman Glass stainless steel rings · September 2025
These rings are a separate September collection photograph; the earlier February collector pieces and their stated sourcing should not be inferred for these rings.
Ametrine Gems (Bolivia) · Soul Body Gems, September 2024.
Our Bolivian ametrine facets
Our collection photograph brings together rectangular step cuts, rounded cushions, ovals and other faceted shapes. Lavender and deeper violet sit beside honey-yellow and pale golden areas. Some stones show a clear division; others display a softer mixture as reflections move between the facets. The tray is a useful reminder that ametrine does not have one fixed appearance. Each cut gives the underlying colour arrangement a different expression.
One crystal, two colours
Ametrine is the gem name for quartz that contains both the purple colour associated with amethyst and the yellow-to-orange colour associated with citrine. The two areas belong to the same crystal. Natural ametrine is not made by joining an amethyst to a citrine. Both names describe colour varieties of quartz, whose chemical formula is SiO₂.
Trace iron and its behaviour within quartz help explain the colours. Published gemological research connects the contrast to particular growth conditions, iron-related colour mechanisms and irradiation involved in producing the amethyst colour. “One side was hotter” is an appealing shortcut, but it leaves out the chemistry and crystal growth. The visible boundary records differences between growth sectors within a crystal.
Why Bolivia matters
The Anahí mine in eastern Bolivia is the principal commercial source of natural ametrine. Its setting is far from the mountain scenery often associated with Bolivia: GIA's field account follows the route into the tropical lowlands near the Brazilian border. The mine produces other quartz varieties alongside ametrine, including amethyst, citrine and colourless quartz.
A landmark 1994 study by Paulo Vasconcelos, Hans-Rudolf Wenk and George Rossman combined field observations with experimental work. It established that the amethyst-citrine combination in the Anahí crystals studied was natural rather than the result of laboratory treatment. That finding is central to understanding Bolivian ametrine. It describes the researched deposit; it is not an individual laboratory report for every gemstone sold under the name.
The art of cutting a colour boundary
The cutter must consider where the purple and golden areas will appear when the finished stone is viewed from above. A rectangular step cut can frame a distinct division, while a cushion or imaginative cut can send light through both zones and create more blended reflections. An attractive stone need not have an exact half-and-half split. The relationship between colour, outline and light can be just as compelling.
GIA's quality guidance highlights colour strength, clarity and the arrangement of the two colours. Many faceted ametrines have no readily visible inclusions. Larger stones can show stronger colour, but weight alone does not determine beauty. Compare how lively the facets look, whether the colour balance appeals to you and how the stone changes as it turns.
Natural material and identification
Synthetic ametrine also exists. A purple-and-yellow appearance by itself cannot establish natural origin, treatment history or a particular mine. Gemologists can examine colour zoning, crystal optics and other features, sometimes with spectroscopy or chemical analysis, to distinguish materials. Published identification research discusses the orientation of the colour boundary relative to the quartz optic axis. This is a specialist observation, not a reliable test to perform from a photograph.
Wearing and caring for ametrine
Ametrine has a Mohs hardness of 7 and good toughness, making it suitable for jewellery with thoughtful care. Hardness measures resistance to scratching; it does not make a stone immune to chipped corners or damaged facet edges. Remove rings before demanding work and store gems separately to prevent rubbing.
Warm soapy water and a soft brush are a practical cleaning choice. Avoid steam cleaning, heat and sudden temperature changes. Prolonged intense light can affect some colours, so a sunny windowsill is not ideal permanent storage. GIA notes that ultrasonic cleaning is usually safe for untreated material, but exceptions include fracture-filled or dyed stones; gentle hand cleaning is the simpler choice when a stone's treatment history is unknown.
Our photograph shows polished nodule halves with pink, lavender-gray, cream and white bands surrounding darker or crystalline centers. Cutting a nodule exposes a cross-section through its interior: bands that originally enclosed a cavity become nested outlines on the polished face. Two halves of the same nodule can offer beautifully related patterns, while neighboring nodules have their own arrangements.
What the name describes
Zhanguo Agate is the collection name used here. Published gemological research often uses the more specific name Zhanguohong for colorful agate from Chinese deposits, including Xuanhua in Hebei and Beipiao in Liaoning. The best-studied red and yellow material is useful geological context, but its exact deposit and color mechanisms cannot be assigned to every piece sold under a similar name. This photograph records our collection; the cited studies examine their authors’ samples.
How banded nodules develop
A 2017 study of Xuanhua Zhanguohong described agate hosted in volcanic lava of the Jurassic Tiaojishan Formation. The authors found bands of very fine-grained silica, with zones of larger quartz crystals or calcite between them. They interpreted the deposits as mineral-filled former cavities in lava, supplied by silica-rich fluids associated with volcanism. Repeated mineral deposition helped build the layered interiors. That model explains the studied deposit rather than establishing a formation history for our photographed nodules.
Texture and color under the microscope
A 2016 study of Xuanhua material distinguished several microscopic textures, including fibrous silica, rounded aggregates and larger quartz crystals. Its analyses associated red bands with hematite and yellow bands with goethite. A later study of yellow-to-red Xuanhua agate also identified these iron-bearing minerals. Small quantities of inclusions can therefore strongly influence a silica-rich stone’s appearance. The pale pink and gray bands in our photograph should not be attributed to a particular inclusion without analysis.
Looking closely
Compare the outer border, the spacing of the bands, the shape of the center and the contrast between polished silica and tiny exposed crystals. A band may change width as it follows the cavity’s outline. The cut and polish reveal those relationships, making the arrangement of each piece as interesting as its color.
Care
Handle open crystalline centers gently. Use lukewarm water, mild soap and a soft brush or cloth, then rinse and dry carefully. Avoid hard knocks, abrupt heating and abrasive cleaners. Where treatments or internal fractures are unknown, gentle hand cleaning is preferable to an ultrasonic cleaner.
The tested Brazilian specimen is a muscovite/quartz schist affected by copper mineralization, containing azurite and/or malachite, some chrysocolla and gypsum or anhydrite.
Collection name: Chessylite Azurite · Sample 1208 · #7 Brazilian sample · Approximately 4.8 cm · December 24, 2024.
What the collection name represents
Chessylite Azurite is retained as the collection name for our patterned polished pieces. The laboratory describes an assemblage rather than a specimen made entirely of one mineral: abundant muscovite and quartz, abundant copper carbonate identified as azurite and/or malachite, some chrysocolla, and gypsum or anhydrite.
Copper mineralization in a schist
The analyst interprets the specimen as a muscovite/quartz schist that experienced copper mineralization. Copper carbonates contribute to the blue and green portions, while muscovite and quartz form important parts of the host material.
The report proposes that an earlier copper sulfide might have oxidized, producing azurite/malachite and chrysocolla. Sulfate released in that process could have reacted with a calcium-bearing mineral to form gypsum or anhydrite. This is a possible formation explanation, not a directly proven sequence.
Keep the identification at the report’s level
The report retains azurite and/or malachite and gypsum or anhydrite as alternatives. We preserve those limits rather than choose one mineral in each pair from the collection’s trade name alone. Brazil is included in the submitted sample description.
Original analytical report submitted by Soul Body Gems; Maine Mineral & Gem Museum laboratory. Original figures, wording and tables retained.
Read the report as text
Analytical Result Report
Sample id: 1208 (#7 Brazilian sample)
Submitted by: Soul Body Gems
Date completed: 12-24-2024
Operating conditions: An AMRAY 1830 SEM operated at 25 kV acceleration potential, 24 mm working distance, 0 degrees sample tilt, coated with 250 Å carbon, and also using the attached XRF unit operated at 30 kV.
  Fig. 1:  Photograph of the specimens.  4.8 cm maximum dimensions.

Fig.2: Backscattered electron image of an area of the specimen.
Fig. 3: Energy dispersive spectrum of spot 1 in Fig. 2. (muscovite)
Fig. 4: Energy dispersive spectrum of spot 2 in Fig. 2. (copper carbonate, malachite/azurite)
Fig. 5: Energy dispersive spectrum of spot 4 in Fig. 2. (gypsum or anhydrite)
Fig. 6: Energy dispersive spectrum of spot 4 in Fig. 2. (quartz).
Fig. 7: Energy dispersive spectrum of spot 8 in Fig. 2. (gypsum or anhydrite).
Fig.8: Backscattered electron image of another area of the specimen.
Fig. 9: Energy dispersive spectrum of spot 1 in Fig. 8. (muscovite).
Fig. 10: Energy dispersive spectrum of spot 3 in Fig. 8. (chrysocolla).
Fig. 11: Energy dispersive spectrum of spot 4 in Fig. 8. (azurite/malachite).
Summary of findings:  This specimen (Fig. 1) is evidently a muscovite/quartz schist which has experienced a copper mineralization.  Muscovite is abundant (Figs. 2, 3, 8, and 9).  A copper carbonate, azurite and/or malachite is abundant (Figs. 2, 4, 8 and 11).  Surprisingly, gypsum or anhydrite is also present (Figs. 2, 5, and 7). This mineral usually appears with rough surface due to its softness.  Quartz is abundant (Figs. 2 and 6).  And some chrysocolla has also been noted (Figs. 8 and 10. It is possible that a copper sulfide was originally present which got oxidized producing the  azurite/malachite and chrysocolla and the sulfate produced may have reacted with some calcium species such as calcite to produce the gypsum or anhydrite.
Date:    12-24-2024                      Signature
The green pyroxene mineral, including our Chrome Diopside set in resin and a separate Russian specimen report.
Chrome Diopside is a chromium-bearing variety of diopside, a calcium-magnesium silicate in the pyroxene family. Its chemistry and crystal structure differ from emerald, tourmaline and jade, even when their greens appear similar. Trace chromium can produce an intense green: GIA documented this mechanism in a diopside crystal enclosed within a diamond. Iron also influences diopside’s appearance, and a green color alone does not establish the proportions of its color-causing elements.
Crystal structure and geological setting
Diopside is monoclinic and can form prismatic crystals as well as granular or massive aggregates. The Handbook of Mineralogy describes it in several geological environments, including metamorphosed carbonate rocks, skarns and some igneous rocks. Its presence in a rock is therefore a mineralogical clue rather than a unique geographic signature. A locality should come from documented sourcing or appropriate analysis, rather than from green color.
Our resin piece
The March photograph shows green mineral fragments set within clear resin. It is a composite object: the transparent enclosing material is part of the finished piece and is not a continuous natural diopside crystal. This format lets the individual fragments remain visible from different angles. The resin also determines how the surface wears and how the object should be cleaned.
Our separately tested Russian material has its own Chrome Diopside (Russia) laboratory page. That report describes diopside with dolomite filling fractures, chromium present and iron as the main reported color contributor. Its findings concern that specimen and should not be transferred to the resin piece.
Handling and care
Diopside’s Mohs hardness is approximately 5.5–6.5. It is brittle and has distinct cleavage, so resistance to scratching and resistance to a sharp impact are different concerns. For the resin composite, use a soft slightly damp cloth and dry gently. Avoid abrasive polishing, solvents, hot water, steam and ultrasonic cleaning. Keep the surface away from harder jewelry and rough handling. These conservative care steps protect the enclosing material as well as the mineral fragments.
Libyan Desert Glass is a natural silica-rich glass associated with the Great Sand Sea in western Egypt, near the Libyan border. Its familiar name refers to the wider desert region; it should not be read as a promise that a specimen was collected within modern Libya. Published research dates the glass to approximately 28.5–29 million years ago.
Glass lacks the long-range repeating atomic arrangement of a crystal. This is why a translucent piece can resemble a pale yellow crystal while belonging to a different material category. The March photograph shows irregular, pale yellow translucent pieces from our collection. Their surfaces and shapes make them especially interesting as objects to examine in changing light.
The reidite fingerprint
The strongest part of the 2019 zircon study is its pressure evidence. Zircon and reidite have the same chemical formula, ZrSiO₄, but their atoms occupy different crystal arrangements. Reidite is the denser high-pressure form. The study describes pressures of about 30 gigapascals, far beyond the atmospheric overpressure associated with an airburst.
The researchers did not simply find intact reidite crystals in every glass fragment. They examined tiny newly formed zircon grains whose systematic orientation relationships record transformation back from reidite. This surviving crystallographic pattern is evidence of the mineral’s former presence, even after subsequent heating and transformation.
The authors concluded that this record requires high-pressure shock waves and excludes formation by an airburst alone. It is the combination of heat and pressure evidence that makes the interpretation persuasive: heat can accompany both proposed mechanisms, whereas the zircon fingerprint records the extreme shock conditions.
Reading the evidence at different scales
Our June photograph shows yellow translucency and the shapes of collection pieces. The impact argument operates at a much smaller scale, using mineral structures and microscopic shock features. A hand specimen lets us appreciate the material; crystallographic analysis reconstructs its formation history. Keeping those scales distinct makes the scientific story clearer.
The material’s formation was debated for decades, including whether the heat came from an impact at the ground or an atmospheric airburst. Research by Cavosie and Koeberl examined zircon grains in the glass and found evidence of the former presence of reidite, a high-pressure form of zircon. Curtin University’s explanation of their 2019 study emphasizes that the pressure required for this mineral points to a meteorite impact.
Separate research by Koeberl and colleagues reported shock features in quartz from bedrock in the glass region, also supporting a physical impact. These are microscopic geological observations, not something that can be confirmed from the yellow color of a hand specimen. The exact source crater remains a subject of investigation.
A terrestrial material with an extraordinary history
Libyan Desert Glass is best understood as Earth material transformed during an impact event. Calling it impact glass does not mean that every yellow fragment is a piece of the incoming meteorite. Scientific studies examine evidence within particular samples to reconstruct the event. Our photograph illustrates the collection material; it is not a laboratory identification of the photographed pieces.
Looking after irregular pieces
Keep pieces cushioned during storage, especially where narrow tips and thin edges might touch another object. Clean gently with a damp soft cloth, and avoid abrasive compounds, sudden temperature changes or impacts. Inspect an irregular edge before handling it closely. Preserving the surface allows both the translucency and the natural form to remain part of its appeal.
London Blue describes a deep blue appearance used in the gemstone trade. It is not a distinct mineral species and does not mean the stone was mined in London. The mineral is topaz; the color name helps distinguish this darker blue presentation from lighter blue topaz sold under other trade descriptions.
Our March photograph shows faceted blue stones in sterling silver rings. Each setting frames the stone differently, while the facets create bright and dark areas as the hand moves. A photograph is useful for remembering the collection, but lighting, exposure and the display used to view it influence the shade seen on screen.
How blue topaz is commonly produced
GIA explains that irradiation followed by heat treatment transforms colorless topaz into commercially available blue hues. Strong blue topaz should be understood in this treatment context rather than marketed as naturally blue on the strength of its color alone. Treatment can change a gemstone’s color while the underlying mineral remains natural topaz.
The precise processing history of an individual stone belongs in its supplier disclosure or laboratory documentation. The term London Blue is a description of appearance, not an analytical record of the irradiation method, facility or treatment conditions. It also differs from the iridescent surface-coating effect commonly marketed as Mystic Topaz.
Hardness is only part of durability
Topaz ranks 8 on the Mohs hardness scale, making it relatively resistant to ordinary scratching. However, it has basal cleavage: a sharp blow can split it along a structural plane. GIA consequently distinguishes its high hardness from its limited toughness. A ring can therefore benefit from a protective setting and thoughtful handling even when the polished stone feels hard.
Care for topaz rings
Clean with lukewarm water, a small amount of mild soap and a soft brush, then rinse and dry gently. Avoid steam and ultrasonic cleaners. Remove rings before activities that can deliver blows to the stone or pressure to its mounting. Sudden temperature changes should also be avoided. Store rings separately so that the silver and the gemstone do not rub against harder objects. This approach protects both the facet edges and the setting while keeping the blue color easy to enjoy.
Trapiche ruby draws attention to a fixed internal pattern rather than a uniformly colored transparent gem. The arrangement can reveal distinct sectors, a central core and radiating boundaries. Our March photograph shows pink-red, approximately hexagonal slices with contrasting dark zones. The broad polished faces make these internal arrangements easy to compare from one slice to another.
The word trapiche is also used for patterned emerald and other minerals. It describes a relationship between crystal growth and texture, rather than naming a separate species of ruby. Ruby itself belongs to corundum; the patterned structure is an additional feature of the material.
What published studies have found
A 1996 Gems & Gemology study described ruby crystals from Southeast Asia with six ruby sectors separated by less transparent yellow or white planes. Many had a tapered hexagonal core. Concentrations of tube-like inclusions occurred in the arms and sector boundaries; examined inclusions contained fluids and carbonate minerals. These observations explain why the boundaries can look very different from the ruby sectors around them.
Trapiche and trapiche-like
Not every six-rayed internal pattern has the same growth structure. GIA’s 2019 account of a trapiche-like ruby from Kashmir described a fixed pattern containing feldspar, graphite and rutile inclusions. It distinguished this arrangement from true trapiche ruby with clearly separated crystallographic sectors. The difference requires close examination of the structure, and may require microscopic or spectroscopic work.
Ruby Trapiche is the collection label for the photographed slices. A photograph alone does not determine whether every slice meets the strict scientific definition of trapiche, nor does it identify the dark material. This page therefore provides the geological context without assigning an unrecorded locality or a laboratory conclusion to the collection.
A fixed pattern rather than a moving star
A trapiche pattern remains part of the stone’s internal arrangement. Star ruby’s asterism is an optical effect produced by light interacting with oriented inclusions. Changing the direction of a light can help distinguish how an optical star behaves from a visible fixed texture. For these slices, inspect the faces in gentle light and keep the edges protected during storage. Use a soft damp cloth rather than abrasive polishing or aggressive cleaning.
Tsavorite is green grossular, one of the mineral species within the garnet family. Garnet describes a group of related minerals rather than a single red gemstone. Spessartine, andradite and grossular can have very different appearances despite belonging to that family. Tsavorite should also be distinguished from demantoid, the green variety of andradite.
The March collection photograph shows faceted Tsavorite Garnet gems supplied to us as material from Kenya. The individual boxes let each stone be seen separately, with differences in shape, size and color. Kenya is our sourcing description; a photograph does not independently establish a mine or geographic origin.
Why the color develops
Trace elements influence which wavelengths a crystal absorbs. GIA research describes vanadium as the dominant color contributor in many tsavorites, with chromium making a smaller contribution. The relative contribution varies between specimens. This means that the attractive green is part of a particular mineral chemistry rather than proof that all green garnets share one composition.
GIA notes that tsavorite occurs in metamorphic rocks and requires particular geological conditions and rock chemistry. A gem’s color gives an accessible introduction to that geological history, but chemical and microscopic analysis is needed to study it in detail.
East African discoveries
Bruce Bridges’s account in Gems & Gemology records Campbell Bridges’s early tsavorite discoveries near Komolo in Tanzania in 1967, followed by the discovery at Taita in Kenya in 1970. This sequence matters: the modern story involves both countries, rather than a single discovery location. Later Kenyan finds and the introduction of the gemstone through Tiffany & Co. helped establish its identity in the jewelry world.
Enjoying and caring for faceted stones
A faceted gem is shaped to reveal the interaction of light with the crystal. Look at it face-up in diffuse daylight as well as under a point light, and compare how bright areas and darker areas change as it moves. Avoid using a single strongly lit photograph as a complete color record.
GIA places tsavorite among the harder garnets, but hard blows and rough wear can still cause damage. Warm soapy water is a gentle cleaning choice. Keep loose gems apart so facet edges cannot strike one another, and avoid steam cleaning. A jeweler can assess a setting before regular wear and check whether any treatment or fracture requires additional care.
A separately tested bracelet and the tsavorite naming boundary
Our bracelet report below is a separate test from the Kenya-sourced faceted gems illustrated above. It identifies green grossular with comparatively low coloring elements, and the analyst prefers green grossular over tsavorite for this specimen. Including this report here explains the naming boundary; it does not certify the photographed faceted gems.
The tested bracelet is green grossular garnet. Its chemistry illustrates a naming boundary with tsavorite, and the analyst prefers the more specific description green grossular with minor chromium, vanadium and iron for this specimen.
Sample 10474 · #6 · Beads approximately 7.5 mm · January 18, 2024 · Submitted by Soul Body Gems.
Tsavorite is a variety of grossular
Grossular and tsavorite are not two unrelated mineral species. The report explains that tsavorite is green grossular. The question for these beads is which descriptive name best fits a green grossular with relatively low chromium, vanadium and iron.
The measured minor and trace elements include iron, titanium, chromium and vanadium. The analyst notes that chromium, vanadium and iron contribute to the green color, but calls the naming choice tricky and explicitly favors green grossular for this bracelet.
A boundary in naming
A green appearance alone does not resolve the trade-name question. This report illustrates why two visually similar green grossular materials need not be described identically in commerce. We retain the analyst’s preferred description without claiming that every green grossular should be called tsavorite or inventing a universal cutoff from this one analysis.
The report is also included on our Tsavorite Garnet page. These tested beads are a separate specimen from the Kenya-sourced faceted gems photographed there.
Original report submitted by Soul Body Gems; Maine Mineral & Gem Museum laboratory. Original text, figures and table retained.
Read the report as text
Analytical Result Report
Sample id: 10474 (#6)
Submitted by: Soul Body Gems
Date completed: 1-18-2024
Operating conditions: An AMRAY 1830 SEM operated at 25 kV acceleration potential, 24 mm working distance, 0 degrees sample tilt, coated with 250 Å carbon, and also using the attached XRF unit operated at 30 kV.
A BRUKER Titan X-ray fluorescence spectrometer was also used and operated for 30 seconds at 50, 25, and 10 kV.


Fig. 1:  Photograph of the specimen.  Approximately 7.5 mm maximum dimension of the beads.
Fig.2: Backscattered electron image of an area of the specimen.
Fig. 3: Energy dispersive spectrum of spot 1 in Fig. 2 (grossular)
Table 1: minor and trace elements in the beads.
Summary of findings:  This specimen (Fig. 1) is a pretty wristlet of beads.  Chemically, they are grossular (Figs. 2 and 3).  The trace elements show minor amounts of iron, titanium, chromium and vanadium.  Tsavorite is a green grossular but this material is a green grossular with low chromium, vanadium and iron content which also gives it a green color.  So, it is a tricky one.  I would be more comfortable calling it a green, grossular with minor chromium , vanadium and iron content which give it green color.
Date:    January 18. 2024                      Signature
Chromium | 0.09
Iron | 0.15
Titanium | 0.12
Vanadium | 0.05
Guatemala’s jadeite and omphacite material, its cultural history and our beads and carvings.
Guatemalan jade belongs to a story that reaches far beyond modern jewelry. GIA describes blue to green-blue jadeite jade as a material prized by the Olmecs, whose civilization flourished approximately 1500–400 BCE. Later Mesoamerican cultures also valued it. The modern trade term Olmec blue recalls that connection, although it is a color description rather than proof that a newly carved object is ancient.
Guatemala has regained recognition as an important jadeite source. GIA’s 2024 reporting documents rough and finished material in blue, green and lavender hues, including beads, pendants and carvings. The range is broader than a single familiar dark green.
Jade is an aggregate material
Jade terminology needs care. Jadeite and nephrite are different mineral materials, and some jade from Guatemala includes substantial omphacite. The stone used for an ornament is commonly an interlocking aggregate of crystals, rather than one large transparent crystal. Composition and texture both influence its appearance.
GIA reported bright green jade from Guatemala at the 2025 Tucson shows that ranged from jadeite to omphacite and was sold within the fei cui trade category. This published work is useful context for understanding the variety of Guatemalan material. It does not identify the exact mineral proportions of our photographed pieces.
Our March collection
The main photograph shows our Guatemalan Jade beaded bracelets. Other March photographs include necklaces, donut rings and rose carvings. Beads repeat a polished form around the wrist; carvings reveal how a cutter uses the same collection material to describe petals, curves and depth. Differences in illumination can alter the green seen in a photograph.
Guatemala is the provenance supplied for this collection. Color alone is not an origin test, and this profile does not assign a mine, archaeological age or treatment classification to the photographed jewelry. Those details belong in the documentation for a particular piece.
Durability and gentle cleaning
GIA gives jadeite a Mohs hardness of approximately 6.5–7 and emphasizes jade’s exceptional toughness. Toughness describes resistance to breaking and is distinct from scratch resistance. A polished surface still benefits from separate storage, especially beside harder faceted gems.
Warm soapy water is the conservative cleaning choice because jade can be dyed, bleached, impregnated or coated. Use a soft cloth, rinse gently and dry before storage. Beaded jewelry also needs attention to its cord or elastic; avoid soaking the entire bracelet unnecessarily and inspect the stringing before wear.
Pietersite is known for irregular patterns and silky areas of reflected light. The March collection photograph shows polished disks with blue, black and pale contrasting regions. A still image records the arrangement on their faces, but tilting a polished piece beneath a small light is a better way to explore any moving sheen. Each disk offers a broad view of the texture rather than presenting it only through small facets.
What causes the sheen
Published research describes pietersite as a chalcedony material containing fibrous amphibole inclusions. GIA’s 2025 review of phenomenal gemstones attributes its chatoyancy to crocidolite fibers. Chalcedony is very fine-grained silica. The reflected effect depends on the arrangement of the fibers and their relationship to the polished face, so different regions may brighten at different angles.
Chatoyancy is a behavior of reflected light, not a separate body color. A blue region can remain blue while a brighter band or patch appears to move across it. The collection photograph therefore cannot show every light effect that might be visible when the disks are handled.
Its relationship to tiger’s-eye
Pietersite is often introduced as a brecciated relative of tiger’s-eye because both can show a fibrous sheen. That comparison describes an appearance but does not fully describe the geology. Hu and Heaney’s 2010 microstructural study examined samples from Namibia and China using diffraction, microscopy and gemological methods. They proposed a formation history different from South African tiger’s-eye.
GIA’s later review likewise distinguishes pietersite’s chalcedony and irregular texture from the columnar quartz of tiger’s-eye. The swirling appearance is therefore worth studying as its own material rather than treating the stone as ordinary tiger’s-eye that has simply been broken into fragments.
Sources and our collection
Namibia and China are the principal sources examined in the cited study. Its authors used analytical methods to compare material from those localities. The blue color or texture of our photograph is not enough to assign either source. This page uses our disks as the collection image while keeping the published findings linked to the researchers’ samples.
Preserving the polished face
Keep disks apart or cushioned so their edges do not strike one another. Use a soft damp cloth for routine cleaning, avoiding abrasive compounds, impacts and unnecessary heat. A clean, intact polished surface makes the changing light easier to observe. View a piece in several orientations and compare different regions before deciding how strongly it shows a sheen.
Our photograph shows faceted bead necklaces and bracelets with brown, bronze and smoky olive tones, finished with sterling silver extension chains. A strand presents many small windows into the material: each bead has its own orientation and pattern of reflections. The photograph records this collection in one position and one lighting setup; gently turning the jewelry offers a fuller view of its changing appearance.
One chemistry, three mineral structures
Andalusite is an aluminum silicate, Al₂SiO₅, with an orthorhombic crystal structure. Kyanite and sillimanite have the same chemical formula but different atomic arrangements. These related minerals are called polymorphs: identical ingredients can produce distinct minerals when assembled differently. Their occurrence helps geologists interpret the pressure and temperature conditions experienced by metamorphic rocks. Andalusite commonly develops when clay-rich sediments are heated, including around igneous intrusions, and also occurs in metamorphosed schists. Its name refers to Andalusia in Spain, while gem crystals have been documented in Brazil and Sri Lanka.
Why the color changes with direction
Pleochroism means that a crystal absorbs light differently along different directions. It is different from the color-change effect produced by switching between daylight and incandescent illumination. Gem andalusite can show strongly contrasting greenish or yellowish brown and reddish colors, sometimes together across the face of a faceted stone. GIA identifies andalusite among the gems in which this property can be especially pronounced. A cutter's orientation decisions influence how these components combine in the finished gem. In small faceted beads, orientation, internal reflections and the direction of illumination all contribute to what the eye sees. Comparing several angles in the same light is more informative than comparing unrelated photographs.
Identification and everyday care
The warm colors alone do not identify andalusite: several other gemstones can look similar in a photograph. Gemologists examine optical properties and internal features, and use instrumental analysis when needed. The mineral has cleavage and is brittle despite its useful resistance to scratching; published hardness values span approximately 6.5–7.5. For these necklaces and bracelets, gentle cleaning with mild soapy water and a soft cloth is a practical approach. Avoid knocks, abrasive rubbing and pulling on extension chains. Store each piece separately so that beads and metal fittings do not rub against neighboring jewelry. This profile describes the mineral and the collection photograph; it does not assign an unrecorded mine locality to these beads.
The collection photograph shows closely gathered faceted bead strands with peach, pink and reddish tones. Small facets create a mosaic of pale highlights and deeper areas of color. Necklaces and bracelets allow these shades to be seen side by side, rather than isolating a single cut gem. The photograph illustrates the jewelry in our March 2025 collection; it does not establish a chemical formula for every individual bead.
What Malaya means in gemology
Malaya, also spelled Malaia, is a trade name associated with yellowish, reddish or pinkish orange garnets, commonly described as pyrope-spessartine. It is not a separate mineral species with one fixed composition. Garnet chemistry is often more complicated than a simple label suggests because several end-member compositions can mix within one crystal. Pyrope contributes magnesium, spessartine manganese and almandine iron; other components can also occur. Different mixtures influence color and measurable gemological properties. The name therefore describes a recognized area of the gem trade rather than a guarantee that two visually similar stones have identical proportions.
Why laboratory chemistry matters
A GIA investigation of an orange garnet found a substantial grossular component in addition to pyrope and spessartine. Standard gemological observations were consistent with pyrope-spessartine, while chemical analysis revealed the more complex mixture. That example is useful because it shows why appearance and a familiar trade name cannot supply the whole mineralogical story. It is research on another specimen, not an analysis of our pictured beads. Garnets are normally singly refractive, so the directional color effect called pleochroism is not their defining optical behavior. Some garnets change appearance with the light source, but a Malaya label alone does not establish that a particular strand is color-change garnet.
Looking at the jewelry
View the strand in soft daylight and then in indoor lighting, keeping the background similar. Notice its overall tone, the balance of pink and orange, and the consistency or variation between beads. Facet reflections can temporarily make one bead appear much lighter than its neighbor. For a record of the piece, photographing both a full strand and a close-up gives more useful information than relying on an isolated bright reflection.
Care for faceted garnet strands
Garnets generally offer good resistance to scratching, with hardness across the group around 6.5–7.5, but they still need protection from hard blows. GIA recommends warm soapy water for cleaning and advises against steam cleaning. For assembled bead jewelry, use a brief gentle clean appropriate to the stringing and metalwork, rinse carefully and dry before storage. Keep strands separate from harder gems and avoid tugging at clasps or extension chains.
Our photograph shows pale blue faceted bead necklaces and bracelets with sterling silver extension chains. The small beads catch clear highlights against the hand, while shaded facets show deeper blue. This is a collection photograph, not a treatment record. Color depth and brightness vary with bead size, lighting, orientation and the way adjacent facets reflect their surroundings.
Zircon and cubic zirconia are different
Natural zircon is a mineral gemstone, while cubic zirconia is a different material widely manufactured for jewelry. The shared beginning of their names does not make them interchangeable. Zircon occurs in many colors, including yellow, green, reddish brown, red and blue. GIA describes its brilliance and flashes of spectral color, known as fire. These optical qualities helped colorless zircon acquire a long history of being confused with diamond, although the two are distinct minerals with different properties.
A mineral with a changing crystal structure
Zircon crystals occur in varied rock settings. Small amounts of radioactive elements present as impurities can damage a crystal's atomic order over very long geological periods. Gemologists distinguish high, intermediate and low zircon according to the extent of this structural alteration and its effect on physical and optical properties. This classification is about the mineral's internal structure, not a simple ranking of how attractive a bead looks. Normal or high zircon retains a comparatively intact structure. GIA's discussion explains why published zircon properties span a range rather than one universal value.
Where the blue color fits
Heat treatment is commonly used to produce blue and colorless zircon. That is useful general background for understanding the gem, but it does not prove the treatment history of the jewelry in this image. A precise description of an individual piece should follow its own supplier information or laboratory documentation. Likewise, a photograph of pale blue beads cannot establish a mine or country of origin. When comparing blue zircon, look at the full strand as well as individual beads: reflected light, visible inclusions and the amount of material light travels through can all influence the impression of color.
Care for beads and facets
Zircon's published hardness is about 6–7.5, and GIA notes that it can be brittle. Protect faceted strands from hard rubbing, knocks and contact with other jewelry; facet edges deserve particular care. Warm soapy water is recommended, while ultrasonic and steam cleaners are not. Some heat-treated zircon can change color after prolonged bright-light exposure, and heat can affect certain stones. For these assembled pieces, keep cleaning gentle, dry the fittings thoroughly and store the jewelry separately in a soft pouch.
Our photograph shows green and blue-green faceted bead necklaces and bracelets, gathered across a hand with silver extension chains. Bright reflections interrupt deeper shaded facets, giving the strands a varied appearance. The image records this collection at one viewing angle. It does not assign the beads to a specific country, establish their boron content or show laboratory measurements.
A name with a mineralogical history
Kornerupine belongs to a complex magnesium-aluminum silicate system. Its relationship to prismatine is important: modern mineralogical work separates compositions within the group according to boron content, rather than treating every example as the same boron-rich mineral. In their 1996 study, Grew, Cooper and Hawthorne revalidated prismatine for the boron-rich compositions and restricted kornerupine in the strict sense to compositions below the relevant boron threshold. The jewelry trade's familiar name is therefore useful, but it does not replace a detailed chemical classification. This is a good example of mineral terminology becoming more precise as researchers learn more about crystal structures.
Directional color and a published gem example
Kornerupine can show pleochroism, meaning that color differs with viewing direction through the crystal. GIA's Gübelin collection includes a green gem recorded from Kenya with yellow and green pleochroic colors. The same specimen has a vitreous luster, measured refractive indices and visible internal growth tubes and fractures. These are observations on that documented gem, not measurements of our necklaces. They show the range of evidence available to a gemologist beyond the overall color of a photograph. In faceted beads, each piece can be oriented differently, while reflections mix with transmitted color. This makes a rotating strand a more revealing view than a single still image.
How identification goes beyond green color
Several unrelated gemstones occur in green or blue-green shades. A gemological identification considers optical behavior, refractive index where measurable, density and microscopic features together. More detailed mineral classification can require chemical information, especially where closely related compositions are involved. The scientific sources below describe their own studied material; they are background reading rather than a certificate for this collection.
Enjoying and caring for the strands
Look at the jewelry under one consistent light while gently turning it, then compare the overall color in a second light source. This helps distinguish a change associated with viewing angle from a change associated with illumination. Handle faceted bead strands gently, protecting bead edges and the areas around drill holes from impacts. A soft cloth and a cautious mild-soap clean are sensible choices for assembled jewelry. Avoid abrasive rubbing and pulling on the fittings, and store each strand separately.
The photograph shows faceted spinel bead necklaces and bracelets in pink, purple, gray and reddish tones, with sterling silver extension chains. Seeing the beads together emphasizes the collection's varied palette. This page follows the Burma origin supplied for the material, while the regional research below provides geological background. The photograph does not establish a particular mine or a treatment history for each bead.
Spinel's own identity
Spinel is a distinct gemstone rather than a variety of ruby or sapphire. GIA describes it as a cubic, singly refractive mineral, with natural crystals often shaped like two joined pyramids, or octahedra. Twinned crystals can have a much flatter form. Its crystal symmetry distinguishes its normal optical behavior from strongly pleochroic gems such as andalusite or tourmaline. The color variations between our beads should therefore not be described simply as different pleochroic directions in one crystal.
The geological setting of Mogok
Mogok in Myanmar is an important source of spinel, ruby and sapphire. GIA's research describes a complex metamorphic region containing marble, schist, gneiss and other rocks. Spinel commonly occurs in the region's marble-related deposits, and gem mining includes both primary deposits and secondary material transported from its original host. The geology is linked to major episodes of metamorphism associated with the collision of the Indian and Asian plates. A country designation is broader than this one famous district, so Mogok's story should not be treated as a mine assignment for every Burmese spinel.
What color research can tell us
A 2026 GIA study compared red and orange spinels from Mogok with material from two Vietnamese sources. It related color to differences in chromium and vanadium and explored trace-element patterns useful for origin work. Some groups overlapped chemically, showing why origin determination can require multiple observations and careful comparison. These findings concern the study's red and orange specimens. They do not supply the chemistry of all pink, purple or gray beads in our photograph, nor do they establish that an entire strand is untreated. Published research is most useful when its sample limits remain attached to its conclusions.
Care and collection records
GIA places spinel at 8 on the Mohs scale and describes good toughness, making it well suited to jewelry with normal care. Mild soapy water is a straightforward cleaning choice for bead strands and their fittings. Protect the jewelry from knocks, store it separately and avoid pulling on clasps or extension chains. Preserve any supplier or laboratory records alongside photographs of the actual piece: those records carry information that an attractive collection image alone cannot provide.
Our photograph shows yellow and yellow-green faceted sphene bead necklaces and bracelets with sterling silver extension chains, draped across a hand. The Madagascar origin follows the collection information supplied for this material. The varied highlights in the image are a useful record of the finished jewelry, while the sources below explain the mineral's general properties. They do not constitute a laboratory report on these particular beads.
Sphene and titanite
Titanite is a calcium titanium silicate, CaTiSiO₅. Sphene remains the familiar gemstone name, while titanite is the mineralogical name. Its monoclinic crystals have direction-dependent optical properties. Mineral descriptions document yellow, green, brown and other colors, and its characteristic crystal habit often has a wedge-like form. Titanite occurs in several geological environments, including igneous and metamorphic rocks. Madagascar is a recognized gem source; GIA has illustrated sphene from Madagascar in its educational material. A country of origin, however, is not the same as an identified deposit or a complete geological history for one strand.
Fire and directional color
GIA highlights sphene's high dispersion: white light can separate into different spectral colors as it travels through and emerges from a faceted gem. Those colored flashes are called fire. Dispersion should not be confused with a claim that one gemstone is universally brighter than another, since cutting, body color and lighting also influence appearance. Titanite is also doubly refractive and can be pleochroic. Directional absorption can affect the color seen through a crystal, while facet reflections add another layer to the view. A still photograph combines these effects rather than isolating them. Turning the beads in a consistent light is a better way to appreciate the interplay of color and reflections.
From mineral to bead jewelry
A large faceted gem offers one view of sphene; small drilled beads offer another. Each bead has its own orientation, depth of color and internal features. The strand's overall appearance comes from these pieces together, including the spacing, silver fittings and changing angles as the jewelry moves. Natural inclusions can interrupt transparency, but their presence or absence in a photograph is not enough to identify a gem or establish its treatment history. Reliable identification uses several optical or analytical observations.
Care for a softer faceted gem
The Handbook of Mineralogy gives titanite a hardness of approximately 5–5.5 and records cleavage. These properties call for gentle handling even when the bead surface is polished and glossy. Protect the strands from hard blows, abrasive contact and rubbing against harder gemstones. Use a soft cloth and mild cleaning, avoiding vigorous scrubbing or harsh handling around drill holes. Store the necklaces and bracelets separately in a soft pouch, and support the strand rather than tugging on the extension chain.
Soul Body Gems · March 2025 collection · ordinary light
Our March collection in ordinary light
The photograph shows polished spheres with white, pink and dark speckling, including four held in a hand above more spheres. This is an ordinary-light image, so it does not show their UV response. The collection is labeled Willemite from New Jersey. A polished sphere presents the patterns in the material across a rounded surface; where several minerals occur together, it is more accurate to describe willemite-bearing material than to assume that every visible area is pure willemite.
A zinc mineral and a historic district
Willemite is zinc silicate, Zn₂SiO₄, and was an ore mineral in the Franklin and Sterling Hill district of New Jersey. The Franklin-Ogdensburg Mineralogical Society describes it in granular aggregates, often associated with franklinite and zincite in a calcite matrix, as well as in crystals, veins and other forms. Its ordinary-light appearance is remarkably varied: green is only one of many possible colors. The pale and dark areas of a polished rock should not be assigned mineral names from a photograph alone, even when the general association is well known.
Why collectors look under UV
New Jersey willemite is especially celebrated for bright green fluorescence. The local mineralogical society reports this response in almost all willemite from Franklin and Sterling Hill under shortwave ultraviolet light. Trace manganese substituting for zinc can activate the green emission. UV provides energy to the material, which then emits visible light; the observed color is not simply the mineral reflecting a green lamp. A response can vary with composition and with the wavelength and strength of the light used. A common longwave flashlight therefore should not be assumed to reproduce every shortwave display.
Fluorescence, afterglow and mineral mixtures
Some willemite specimens continue to emit light after the UV source is removed, a phenomenon called phosphorescence. The Fluorescent Mineral Society documents an example of radiating Franklin willemite with prolonged afterglow. That is a specimen-specific observation, not a promised duration for our spheres. When willemite occurs alongside other minerals, UV can reveal a contrasting pattern: some components emit different colors and others remain dark. Comparing an ordinary-light image with a properly recorded UV image of the same piece is particularly informative. Recording the lamp wavelength helps make that comparison meaningful.
Caring for polished spheres
The mineral's published hardness is around 5.5, while a mixed rock may contain components with different properties. Keep spheres on stable padded stands, avoid knocks and protect polished surfaces from abrasive dust. A soft cloth and gentle cleaning are preferable to harsh scrubbing. The New Jersey designation describes this collection's supplied provenance; it does not identify which mine or level produced each sphere.
Willemite SS Rings · Soul Body Gems, February 2024.
Brazil gave this celebrated copper-colored tourmaline its name. Its story combines unusual chemistry, striking color and a small group of remarkable deposits.
Paraíba is a gem variety name rather than a separate mineral species. Brazilian material belongs principally to the elbaite branch of the tourmaline family. Copper contributes the characteristic blue-to-green color, while manganese can influence pink and violet tones.
A bright blue tourmaline is not automatically Paraíba. The accepted gemological definition considers both the color range and its chemical cause. Tiny traces of copper alone are insufficient, and iron can also produce blue tourmaline. A photograph cannot establish the chemistry of a stone.
The Brazilian story
The name comes from Paraíba State in northeastern Brazil, where the material attracted international attention in the late 1980s. Later Brazilian discoveries included neighboring Rio Grande do Norte. São José da Batalha is a historically important locality.
The Brazilian deposits are associated with pegmatites: coarse-grained rocks in which crystals developed from mineral-rich melts and fluids. The unusual availability of copper during tourmaline growth helped create this distinctive material. Production has been intermittent, contributing to its rarity in the gem trade.
This profile focuses on Brazil. The variety name itself is also used for qualifying material from other countries; Brazilian origin is a separate claim that should be supported by provenance or a laboratory origin opinion.
Color, jewelry and thoughtful buying
Fine examples can show vivid turquoise, greenish blue or green with a luminous appearance. “Neon” describes their visual impression, not light emitted by the stone. Color strength, clarity, cut, size and condition all influence desirability; two Brazilian stones can look very different.
Ask what supports the identification and the stated Brazilian origin.
Check any laboratory report against the actual stone it describes.
Look for disclosures about heating or other treatments rather than assuming a natural gemstone is untreated.
For cabochons and material with matrix, consider the complete piece, its inclusions and its setting—not only the brightest colored area.
The rings pictured are from our own collection. No laboratory report for these particular rings accompanies this profile, and the photograph is not a chemical identification.
Care
Tourmaline has a Mohs hardness of about 7–7.5, but hardness does not make a ring immune to chips or fractures. Use warm soapy water and a soft brush, rinse gently and dry thoroughly. Avoid steam and ultrasonic cleaning, sudden temperature changes and hard impacts. Store rings separately to protect both stones and settings.
Metaphysical traditions
In contemporary crystal practices, blue and blue-green tourmaline is associated with clear expression, reflection and a sense of emotional openness. Some people use it as a reminder to pause, speak thoughtfully and approach change with curiosity. These are spiritual associations and personal interpretations, not established medical effects or substitutes for healthcare.
Soft pink, peach, and rose tones give faceted morganite a quiet elegance. Its beauty depends on the relationship between natural color, transparency, and the cutter’s choices.
Morganite is the pink to orange-pink variety of beryl, the mineral family that also includes aquamarine and emerald. Trace manganese produces its characteristic color. Its mineral formula is Be₃Al₂Si₆O₁₈, and its Mohs hardness is approximately 7.5–8. “Pink emerald” is a misleading name: morganite has its own identity within this family.
Color is often delicate rather than intense. Pale rose, peach, salmon, and purplish pink all belong to its palette. A light-colored stone can still be appealing; stronger pink saturation is rarer. The photographed facets show our May 2025 collection, rather than a laboratory sample or a claim about every morganite on the market.
What faceting brings to the stone
Morganite can show different shades when viewed along different crystal directions, a property called pleochroism. A cutter must consider this orientation before shaping the rough. The final arrangement of facets works with the material’s color and transparency, so two stones of similar weight can have noticeably different appearances.
Light material may be cut somewhat deeper to strengthen the apparent color. Morganite lends itself to oval, pear, cushion, emerald-style, round, and imaginative designer cuts. Shape and cutting style are separate choices: the outline describes the shape, while the facet arrangement determines how light travels through the stone.
When comparing loose facets, look at the whole stone in ordinary lighting as well as under a spotlight. Notice whether the color remains pleasing, whether the outline is balanced, and how the reflections change as it moves. This is a practical viewing approach, rather than a formal laboratory grade.
Clarity and size
Faceted morganite commonly has no inclusions visible to the unaided eye. Less-transparent material may instead be carved or fashioned as cabochons. Inclusions can occur, and a photograph cannot establish the clarity of an individual stone.
Morganite crystals can grow large, allowing substantial faceted gems and custom cuts. Larger stones can display stronger color, but carat weight alone does not determine beauty. Color, transparency, the cutting choices, and the visual proportions all deserve attention.
Where morganite forms
Morganite is associated with pegmatites, rocks that can support the growth of large crystals. Brazil’s Minas Gerais is an important source. Madagascar is historically significant, and documented sources also include Afghanistan, Mozambique, Namibia, and the United States. These are general references; no geographic origin is assigned to the pictured collection without sourcing information for those particular gems.
Heat treatment and identification
Heat treatment is common and can reduce a yellow or orange component, leaving a pinker appearance. GIA notes that this heat treatment is not detectable and that the resulting color is stable. A pink appearance alone therefore does not demonstrate that a morganite is unheated.
Gemological identification can distinguish morganite from look-alike materials. A colored-stone identification report records characteristics and detectable treatments; it does not provide an overall morganite quality grade. The pictured facets are collection photographs, and this educational profile does not represent a specimen-specific Soul Body Gems test report.
Caring for faceted morganite
Protect the stone from hard knocks and scratches, and store it separately from harder gems. Warm water and mild soap are the safest routine cleaning choice. Avoid unnecessary heat. Liquid inclusions, fractures, or fracture filling can make ultrasonic or steam cleaning unsuitable; ask about the particular stone before using either method.
The yellow, white and black areas in this polished material each have a different mineral identity. Our laboratory report identifies topaz with some kaolinite in the yellow material, quartz in the white areas, and biotite in the black areas.
Sample: 1255 (#1 new find from Brazil). Report completed: June 2, 2025. Submitted by: Soul Body Gems.
Page name: Imperial Topaz in Quartz is our collection name. The report confirms topaz in the yellow material; it does not separately certify an Imperial color grade.
What was tested
The submitted polished specimen measures approximately 6.5 cm at its maximum dimension. The report examined several regions rather than relying on the overall appearance. Its internal description identifies the specimen as a new find from Brazil, which is the provenance recorded here.
White areas: quartz
Backscattered-electron imaging and an energy-dispersive spectrum identify quartz in the pale part of the specimen. Quartz is one component of the photographed material, rather than a label for the entire mixed-mineral piece.
Black areas: biotite
The dark component was identified as biotite in one examined area and confirmed in a second area. Testing more than one location helps connect the dark appearance with a recurring mineral component in this particular specimen.
Yellow material: topaz and kaolinite
The yellow-orange area was located for backscattered-electron imaging with the help of a graphite strip. Its spectrum indicated an aluminum silicate. X-ray diffraction then matched topaz and kaolinite-group reference patterns, leading to the report’s conclusion that the yellow material is topaz with some kaolinite. Elemental composition and diffraction provide different kinds of evidence: the former describes the elements present, while the latter helps identify crystal structures.
Reading the collection photographs
The main photograph shows the collection pieces shared in June 2025. The additional palms below show the same collection material in another polished form. These photographs illustrate appearance and variety; the laboratory findings apply directly to the submitted specimen pictured in Figure 1.
Topaz has cleavage and can split under an unfavorable blow even though it resists scratching. A mixed piece may also contain boundaries and softer areas that deserve gentle handling. Keep palms cushioned and separate from harder objects, dust with a soft cloth, and avoid impacts, steam and ultrasonic cleaning. For topaz care background, see GIA’s care guide.
Figures from the supplied analytical report
All nine report figures are reproduced below. Select a figure to enlarge it. The complete supplied report text follows the figures.
Analytical Result Report

Sample id: 1255 (#1 new find from Brazil)

Submitted by: Soul Body Gems

Date completed: 6-2-2025

Operating conditions: An AMRAY 1830 SEM operated at 25 kV acceleration potential, 24 mm working distance, 0 degrees sample tilt, coated with 250 Å carbon, and also using the attached XRF unit operated at 30 kV.

A Bruker D2 Phaser X-ray diffra tometer  was also used and operated at 30 kV and 10 mA.


Fig. 1:  Photograph of the specimen.  Maximum dimension 6.5 cm.

Fig.2: Backscattered electron image of an area of the specimen in Fig. 1.

Fig. 3: Energy dispersive spectrum of spot 1 in Fig. 2. (quartz)

Fig. 4: Energy dispersive spectrum of spot 2 in Fig. 2. (biotite)

Fig. 5: Backscattered electron image of another area of the specimen in Fig. 1.

Fig. 6: Energy dispersive spectrum of spot 1 in Fig. 5. (biotite)

Fig. 7: Backscattered electron iamge woth the yellow-orange material.  A graphite strip was used to find it under backscattered electron imaging.

Fig. 8: Energy dispersive spectrum of spot 1 in Fig. 7. (aluminum silicate)

Fig. 9: X-ray diffraction scan of the orange material.  Matches for topaz and kaoliniite roup in reference pattern.

Summary:

This specimen (Fig. 1) is an interesting specimen.  The white parts are quartz (Figs 2 and 3), and the black parts are biotite (Figs. 2 and 4) and confirmed for another area in Figs. 5 and 6).  They yellow material is an aluminum silicate, and was confirmed as topaz with some kaolinite.

Date:    6-2-2025                      Signature
Chocolate Ethiopian Opal pairs warm brown bodycolor with an intimate, shifting display of color. The cabochons in our June 2025 collection show deep brown, reddish and orange tones, with bright flashes that emerge as the stones move.
What “chocolate” describes
Chocolate is a descriptive trade term for the brown bodycolor, rather than a separate mineral species. Bodycolor is the background color of an opal. Play-of-color is the changing display of spectral colors seen when the stone, light or observer moves. Brown opal can be precious opal with play-of-color, or common opal without it; the name alone does not specify which.
Ethiopia’s brown opal
Ethiopian opal discoveries in the early 1990s brought attention to material from Mezezo in the historical Shewa region. Published accounts describe reddish-brown volcanic nodules containing orange, reddish-brown and chocolate-brown precious opal. The later Wegel Tena discovery in Wollo became particularly important for lighter-bodied and crystal opal. These regional histories explain the range of Ethiopian material; they do not assign a particular mine to every chocolate-colored stone.
What research can reveal
In 2026, GIA described a dark chocolate common opal in a research collection of Ethiopian rough. Its chemistry included unusually elevated rare-earth elements and other trace elements compared with many previously studied Ethiopian opals. The authors linked the specimen’s distinctive chemistry to the sensitivity of opal formation to local environmental conditions. That study concerns one analyzed specimen. Its chemical results should not be applied to our photographed cabochons.
Hydrophane behavior and treatment
Many Ethiopian opals are hydrophane: they can absorb water, sometimes changing transparency or appearance while wet. Behavior varies among pieces. Color, appearance and a trade name cannot establish whether a particular stone is hydrophane or whether it has been treated. Ethiopian opal can also undergo color treatments, so natural brown bodycolor and darkened material must be evaluated on their own evidence.
The photograph shows our collection’s appearance. This educational profile does not attach a specimen-specific laboratory report to these cabochons or assign them the results of another published study.
Enjoying a cabochon
A smooth domed cut invites the eye to follow color across the surface. Turn the stone slowly in ordinary light and compare its warm background with the brighter flashes. Brightness, pattern and color distribution are separate qualities; a dark bodycolor alone does not describe how vivid the play-of-color will be.
Care and storage
Opal’s hardness is approximately 5–6.5 and its toughness varies, so protect it from scratches and hard impacts. GIA advises avoiding ultrasonic and steam cleaning. For Ethiopian material that may absorb liquids, avoid soaking, oils, perfumes and household chemicals. Start with a soft dry cloth and seek advice for the specific stone before using liquid cleaners. Protect it from excessive heat and abrupt temperature changes, and store it separately from harder gems.
A quiet change in the light can transform the character of a gemstone. Zultanite is a trade name associated with natural color-change diaspore, valued for delicate greens, warm champagne tones and pinkish hues. The faceted gems shown here belong to our genuine diaspore collection shared in June 2025.
What diaspore is
Diaspore is an aluminum oxide hydroxide, AlO(OH), with an orthorhombic crystal structure. Its reference hardness is 6.5–7, but it is brittle and has perfect cleavage in one direction. Hardness measures resistance to scratching; cleavage describes a direction in which a crystal can split. A stone can resist everyday abrasion yet remain vulnerable to a sharp blow.
Zultanite and the Turkish story
The name Zultanite became associated with transparent color-change diaspore from southwestern Türkiye. Published gemological accounts describe production near Pınarcık in the Muğla region and the establishment of a more consistent commercial supply in the mid-2000s. Diaspore is the mineral name; Zultanite and Csarite are trade names used for Turkish gem material. Other gem diaspore occurrences have also been reported, including Myanmar and material reportedly from Afghanistan.
Why the light matters
Color change is a response to the spectrum of the light illuminating the stone. A daylight-like source and a warmer incandescent source can produce different perceived hues. Pleochroism is a separate effect: color can also vary with the direction in which the crystal is viewed. Neither effect means that every diaspore changes by the same amount.
Research comparing diaspore and corundum examines how trace elements occupy aluminum sites and influence absorption. The presence and combination of color-producing elements help explain why diaspore can display different palettes. These published measurements provide mineralogical context; they are not chemical measurements of the photographed gems.
Looking at faceted gems
Compare a stone under more than one ordinary light source, then turn it slowly. Notice its color, the distribution of bright reflections, and any areas that remain dark. The outline and the facet arrangement both influence what you see. A photograph captures one lighting condition and one orientation, so the live experience may reveal more variation.
Genuine diaspore and imitation material
Our pictured collection is genuine diaspore. Soul Body Gems also keeps a separate educational entry for material sold as Zultanite that laboratory testing identified as glass. Those findings concern the submitted imitation specimens and do not describe these genuine gems. A trade name or a visible color change alone is insufficient to identify an unknown stone; a gemological examination can establish its identity.
Protect diaspore from knocks, pressure on exposed edges and abrupt temperature changes. Store loose stones separately. As a conservative care approach for a brittle mineral with cleavage, clean gently with a soft cloth or brief mild soapy-water cleaning rather than ultrasonic or steam equipment.
A quiet change in the light can transform the character of a gemstone. Zultanite is a trade name associated with natural color-change diaspore, valued for delicate greens, warm champagne tones and pinkish hues. The faceted gems shown here belong to our genuine diaspore collection shared in June 2025.
What diaspore is
Diaspore is an aluminum oxide hydroxide, AlO(OH), with an orthorhombic crystal structure. Its reference hardness is 6.5–7, but it is brittle and has perfect cleavage in one direction. Hardness measures resistance to scratching; cleavage describes a direction in which a crystal can split. A stone can resist everyday abrasion yet remain vulnerable to a sharp blow.
Zultanite and the Turkish story
The name Zultanite became associated with transparent color-change diaspore from southwestern Türkiye. Published gemological accounts describe production near Pınarcık in the Muğla region and the establishment of a more consistent commercial supply in the mid-2000s. Diaspore is the mineral name; Zultanite and Csarite are trade names used for Turkish gem material. Other gem diaspore occurrences have also been reported, including Myanmar and material reportedly from Afghanistan.
Why the light matters
Color change is a response to the spectrum of the light illuminating the stone. A daylight-like source and a warmer incandescent source can produce different perceived hues. Pleochroism is a separate effect: color can also vary with the direction in which the crystal is viewed. Neither effect means that every diaspore changes by the same amount.
Research comparing diaspore and corundum examines how trace elements occupy aluminum sites and influence absorption. The presence and combination of color-producing elements help explain why diaspore can display different palettes. These published measurements provide mineralogical context; they are not chemical measurements of the photographed gems.
Looking at faceted gems
Compare a stone under more than one ordinary light source, then turn it slowly. Notice its color, the distribution of bright reflections, and any areas that remain dark. The outline and the facet arrangement both influence what you see. A photograph captures one lighting condition and one orientation, so the live experience may reveal more variation.
Genuine diaspore and imitation material
Our pictured collection is genuine diaspore. Soul Body Gems also keeps a separate educational entry for material sold as Zultanite that laboratory testing identified as glass. Those findings concern the submitted imitation specimens and do not describe these genuine gems. A trade name or a visible color change alone is insufficient to identify an unknown stone; a gemological examination can establish its identity.
Protect diaspore from knocks, pressure on exposed edges and abrupt temperature changes. Store loose stones separately. As a conservative care approach for a brittle mineral with cleavage, clean gently with a soft cloth or brief mild soapy-water cleaning rather than ultrasonic or steam equipment.
Lavender, violet and creamy white meet in the swirling patterns of Utah Tiffany stone. Our collection includes polished hearts, freeforms, cabochons, pendants and animal carvings, each showing a different part of this patterned material.
A rock with more than one mineral
Tiffany stone is a trade name for a complex mineral-bearing rock rather than a single mineral species. The Fluorescent Mineral Society describes Utah material as opalized fluorite with bands and veins of chalcedony, manganese oxide and bertrandite. Calling the entire stone “bertrandite” does not mean every part is that mineral.
The Utah connection
The classic locality is the Brush Wellman beryllium mine in the Spor Mountain district near Delta, Utah. USGS photographs from the Roadside pit document layered nodules with fluorite, opal and bertrandite mineralization. That mixed structure helps explain why a polished surface can reveal contrasting zones and veins instead of one uniform appearance.
Color and light
Purple, lavender and cream patterns make Tiffany stone a distinctive lapidary material. Some specimens also fluoresce under ultraviolet light; the response depends on their mineral components and the wavelength used. A photographed fluorescent specimen does not establish the response of every piece in our collection.
Our Tiffany collection
The hearts are shown above. Explore the other collection photographs below; select an image to open its Memory Lane entry. The gallery includes still previews of the archive videos.
Handle polished pieces gently, store them separately to avoid knocks and scratches, and clean with a soft damp cloth. Avoid harsh cleaners and sudden temperature changes.
This page features our Utah Tiffany collection. The separate Russian Tiffany laboratory entry concerns a different specimen. No specimen-specific laboratory report is attached to the photographed Utah pieces here.
Pink Aragonite Hearts · Soul Body Gems, September 2024.
Pink Aragonite brings a vivid rose palette to smooth, palm-sized freeforms. Our photograph records the old-stock pieces shared in May 2025.
Our collection
The polished freeforms are irregular rather than cut to one repeated shape. Pale veins and boundaries interrupt the pink areas, giving each piece a different pattern. Turning a freeform makes those relationships easier to see than viewing a single photograph. “Old stock” describes our collection history; it does not establish the date when the mineral formed or provide a mine locality.
Aragonite and calcite
Aragonite is calcium carbonate, CaCO₃, with an orthorhombic structure. Calcite has the same formula but a different arrangement of atoms. Aragonite can form fibrous, banded, branching or rounded aggregates, as well as individual crystals. It occurs in environments including caves, hot springs and marine deposits. Its hardness is about 3.5–4, and it is brittle.
Reading the pink color
Pink is a color description, not a separate mineral species. A photograph cannot establish the coloring agent, exclude dye or identify every component in a polished aggregate. No specimen-specific laboratory report has been attached to these photographed freeforms. We therefore retain the collection name without assigning a chemical cause to their pink color or claiming laboratory confirmation of an untreated condition.
Looking closely
Compare the broad pink areas with the pale seams and edges. A polished surface shows color and internal pattern particularly clearly, while reflections may hide small features. The photographed group demonstrates the appearance of these collection pieces; another piece sold under the same name can have a different pattern or composition.
Care
A soft cloth is the first choice for removing dust. Store each freeform separately to prevent scratches and chips. As practical care for a soft carbonate, avoid acidic cleaners, prolonged soaking, ultrasonic cleaning and impacts. Preserve any original supplier information with the piece so that its collection history remains available.
Source
Handbook of Mineralogy: Aragonite, Mineralogical Society of America. Mineral properties are general reference information; the collection descriptions refer to our photograph.
Bright yellow-green Gaspeite from Australia makes a striking contrast with the surrounding host material in our May 2025 collection photograph.
Our photographed material
These polished pieces were supplied to Soul Body Gems as Australian Gaspeite. The image records that collection description and the pieces’ appearance. It does not establish a particular Australian mine or replace a specimen-specific identification. The contrast between the vivid green areas and their darker markings gives each polished piece its own pattern.
A nickel-bearing carbonate
Gaspeite is a carbonate containing nickel, magnesium and iron, commonly expressed as (Ni,Mg,Fe)CO₃. It belongs to the calcite group. It is often compact and massive, with colors ranging from pale green to grass-green and olive. The reference hardness is about 4.5–5. Its name comes from the Gaspé Peninsula in Canada, where the mineral was first described.
Australian occurrences
Published occurrences include Western Australian nickel districts around Nullagine, Kambalda, Agnew and Widgiemooltha. Those records provide geological context for Australian material, but they do not identify the source of every piece in commerce. Keeping a supplier’s locality information is more useful than assigning a mine from color alone.
Color and identification
The green appearance is memorable, yet color alone cannot distinguish gaspeite from every other green mineral or establish whether a polished piece has been treated. No laboratory report is attached to the photographed pieces on this page. A report, if later added, should identify the actual specimen examined and keep its conclusions separate from untested collection photographs.
Appreciating polished pieces
Look at the relationship between the green regions and the surrounding material rather than expecting one uniform color. Polishing reveals those boundaries and makes a piece comfortable to handle. Different photographs and lighting conditions can change the apparent brightness, so a photograph should be read as one view of a physical object.
Care
Protect polished pieces from harder stones and sharp knocks. Dust gently with a soft cloth and avoid acidic cleaners or prolonged immersion. These are practical precautions for carbonate material; keep the piece’s supplier information alongside it.
Source
Handbook of Mineralogy: Gaspeite, including the original 1966 description and published Western Australian occurrences. Reference mineral properties do not constitute a test of our photographed pieces.
Blue-green tones and pale, flowing internal textures give this Tanzanian material its Ocean Kyanite and Mermaid Kyanite trade names. In our collection, it has another striking feature: a red response under UV light.
Ocean Kyanite and Mermaid Kyanite are descriptive market names, rather than separate mineral species. Soul Body Gems sources the material shown here from Tanzania. We use both names so visitors can find the collection under either term.
The photographed rings show blue-green stones with pale streaks and mottling. They document our May 2025 collection in ordinary light. A specific mine and a specimen-specific analytical report are not assigned here. Trade names are not standardized, so locality and identification should follow the documentation for the actual material.
What kyanite is
Kyanite is an aluminum silicate with the formula Al₂SiO₅. Andalusite and sillimanite share that chemical formula but have different crystal structures. Kyanite commonly develops during metamorphism under relatively high pressure and is associated with rocks such as schist and gneiss.
It often forms elongated blades or tabular crystals. Its colors can include blue, white, gray, green, and other shades, sometimes with zoning. Its luster may be glassy or pearly. The sea-like appearance of a polished stone can reflect its internal structure and any associated minerals; a photograph alone cannot identify every pale inclusion.
Why a blue-green stone can glow red
Body color and fluorescence are different optical effects. The color seen in ordinary light depends on which wavelengths the material absorbs or transmits. Fluorescence is light emitted after excitation by a suitable light source, so its color need not match the stone’s daylight appearance.
Soul Body Gems has observed a red response in this collection under UV illumination. This is our observation of the material, not a laboratory determination of its cause or a promise that every piece will respond with the same intensity.
A 2020 study of green kyanite investigated iron, chromium, inclusions, and photoluminescence. Its samples emitted red light when excited at 410 and 580 nm, yet were inert under the gemological UV lamp used in that study. Those results show why excitation wavelength matters; they do not establish the mechanism in our Tanzanian stones. We therefore do not identify a particular trace element as the cause without testing this material.
Kyanite in jewelry
Kyanite has unusually directional hardness: approximately 5.5 in one direction and 7 in another. It also has strong cleavage, meaning that an impact can split it along certain planes. A harder direction does not make the entire gemstone resistant to knocks.
For these rings, protect the stones from impacts and abrasive work. Use a soft cloth and gentle cleaning, and avoid ultrasonic or steam cleaning as a conservative precaution. Store each piece so other jewelry does not rub against its surface.
The locality, trade names, collection photograph, and observed UV response are supplied by Soul Body Gems. General mineral and optical information is drawn from the references above.
Pale polished natrolite from our Russian collection, with a soft, silvery appearance and fine internal texture.
Natrolite is a sodium-bearing zeolite: a hydrated aluminosilicate with the ideal formula Na₂Al₂Si₃O₁₀·2H₂O. Its name refers to sodium. Water is part of its crystal structure, rather than simply moisture trapped on the surface.
It often forms slender crystals and radiating groups, but can also occur as compact or granular masses suitable for polishing. Colors include white, colorless, gray and subtle blue, yellow or pink; the luster ranges from glassy to pearly.
The Russian connection
The Khibiny and Lovozero massifs of Russia’s Kola Peninsula are documented natrolite localities. Natrolite can develop late in the history of igneous rocks, filling cavities or seams. Russia is the sourcing locality for the palm stones photographed here; a specific mine has not been assigned to this collection.
Reading a polished surface
The photographed palms show pale mottling and a fine silvery texture. These are observations of the collection, rather than an identification of every visible grain. Polished mineral material may include associated minerals, and a photograph alone cannot establish its complete composition.
Care
Natrolite has a Mohs hardness of about 5–5.5, perfect cleavage and brittle behavior. Protect polished pieces from impacts and scratches. As a practical precaution for a mixed mineral carving, use a soft cloth and avoid harsh cleaning, soaking or heating.
Meaning and reflection
The quiet palette can serve as a personal reminder to pause, simplify and make room for clear thought. This is an invitation to reflection, rather than a measured effect of the mineral.
No specimen-specific Soul Body Gems laboratory report accompanies this Russian material profile. The separate pink Indonesian natrolite report concerns a different submitted specimen.
Agate is banded chalcedony, a very fine-grained form of silica. Its principal mineral is quartz, with the chemical formula SiO₂. “Malawi Agate” is a geographic description, rather than a separate mineral species.
A story written in volcanic cavities
Agate occurrences near Ngabu in southern Malawi’s Shire Valley are associated with basalt. According to a locality account credited to miner Joshua Ritter by The Gem Shop, silica-bearing solutions deposited chalcedony in cavities within the volcanic rock.
Mineral deposition in layers creates the contrasting bands revealed by cutting and polishing. The same locality account describes material ranging from larger, fractured nodules to small, strongly colored and banded agates. That regional background does not establish a particular mine for the pieces in our photograph.
Our January 2025 collection
These mini palms show fine curved bands, translucent areas and contrasting patches. Some have warm orange and pink tones, while others emphasize cool gray and white. The small polished shape makes it easy to follow each piece’s individual pattern.
The country label follows our sourcing information. No treatment or exact mine has been inferred from the colors in the photograph.
Care
Quartz has a Mohs hardness of about 7, but a polished agate can still chip or contain fractures. Handle it gently, store pieces so they do not knock together, and use a soft cloth for routine cleaning.
Meaning and reflection
The repeated bands can offer a visual focus for patience, continuity and finding steadiness through change. These are personal symbolic uses, not demonstrated health effects.
No specimen-specific Soul Body Gems laboratory report accompanies this material profile.
Ten luminous, multicolored tourmaline slices from Madagascar, recovered in 1992 according to Soul Body Gems' collection provenance. Each cross-section records a different sequence of crystal growth.
What is liddicoatite?
Liddicoatite is a calcium-rich, lithium-bearing member of the tourmaline group. Tourmaline is a family of closely related borosilicate minerals, rather than one chemical species. Liddicoatite was recognized as a separate species in 1977 and named for Richard T. Liddicoat, a leading figure in gemological education. Its close relative elbaite is rich in sodium at a key structural position where liddicoatite is calcium-dominant. Both may be present in different zones of one crystal.
This distinction matters for a colorful slice: its pink, green, yellow, brown or nearly colorless bands do not, by themselves, identify its species. Refractive index and other routine observations can overlap. Quantitative chemical analysis of the relevant zones is needed to distinguish liddicoatite from elbaite confidently. “Liddicoatite” is the collection name for these photographs; no specimen-specific analytical report accompanies them.
Why the slices look like miniature stained glass
A tourmaline crystal grows outward in stages. As the chemistry of the surrounding fluid changes, new growth can differ in color from earlier growth. A cut made across the long axis exposes the sequence as concentric rims, triangles, and sometimes three-rayed stars. The crystal's threefold symmetry helps shape those geometric boundaries. Thin, polished sections transmit light, so backlighting makes the patterns especially vivid.
The famous polychrome tourmalines of central Madagascar have inspired slices, carvings and occasional faceted gems. Not every slice shows the same pattern: color, transparency and the path of the cut all affect the view. Internal tubes, partially healed fractures, strain, negative crystals and mineral inclusions can add texture. Those features are part of the gemological story, though a photograph cannot identify every inclusion.
Madagascar and the Anjanabonoina story
The Anjanabonoina pegmatite field, west of Antsirabe in Madagascar's central highlands, is an important historic source of polychrome tourmaline. Pegmatites are coarse-grained igneous bodies in which water-rich, chemically evolved melts and fluids can concentrate elements such as lithium and boron. Large cavities at Anjanabonoina produced tourmaline along with minerals such as feldspar, quartz, beryl and spodumene.
Gem tourmaline was documented in the Betafo region in the late nineteenth century. Mining at Anjanabonoina grew in the early twentieth century, revived in the 1970s, and continued through later periods of local work. A detailed GIA study records major pockets reported in 1972, 1978, 1984 and 1991, with production also in the early 1990s. The same study describes the extraordinary color zoning and the need for chemical analysis to separate liddicoatite and elbaite.
Soul Body Gems' collection provenance dates these particular slices to 1992. The regional research does not establish their exact pocket or mine, so we do not equate them with the documented 1991 find or attribute them to Anjanabonoina specifically. Their 1992 date describes this collection, while the mining history above gives context for the broader Madagascar material.
Explore our ten slices
Move through the photographs to compare the banding and geometry. The shapes seen in backlight are a record of growth, not painted decoration.
Soul Body Gems collection photographs · January 2025 Memory Lane. The copyright mark appears on the displayed image.
Looking closely and caring for a slice
Follow the color from the center toward the edge. Look for a triangular core, alternating light and dark bands, or a fine outer rim. Rotate the slice and vary the light: a translucent zone can appear much brighter when lit from behind. These visual clues describe growth, but they are not a laboratory identification or a reliable way to determine treatment.
Tourmaline has a Mohs hardness of roughly 7 to 7½, yet a thin slice can chip or break at a fracture. Hold it over a soft surface, avoid pressure on the edges, and store it separately from harder gems. A soft dry or lightly damp cloth is a gentle first choice. Avoid ultrasonic and steam cleaning, sudden temperature changes, prolonged soaking, and harsh chemicals, especially when the piece's fracture filling or other treatment history is unknown. GIA documents resin stabilization, composite construction and wax or oil in some tourmaline slices generally; that does not establish treatment of these pieces.
Meaning and reflection
Many people use multicolored tourmaline as a personal symbol of change, layered experience and creativity. The changing colors can be a prompt to slow down and notice how one stage leads to another. Such meanings are traditions and personal reflections, not scientifically measured effects or health claims.
No specimen-specific Soul Body Gems laboratory report is attached to these slices. The references describe studied materials and regional context, not a test of the collection photographed here.
Carvings supplied as Yttrium Fluorite from Mexico · Soul Body Gems, September 2025. These pieces have not been laboratory tested for yttrium.
A soft lavender appearance makes these carvings memorable. The name supplied with them invites a closer look at fluorite and the rare-earth element yttrium.
What does the name mean?
Fluorite is calcium fluoride (CaF₂). The name yttrofluorite is used for a variety in which an appreciable amount of yttrium substitutes into the fluorite structure. “Yttrium Fluorite” is a descriptive trade name, not a separate mineral species. Color alone cannot show whether a particular carving contains yttrium or how much it contains.
Our September 2025 collection
These carvings were supplied to Soul Body Gems under the Yttrium Fluorite name with Mexico as the stated origin. We have not tested these pieces to confirm their composition or a specific locality. Other fluorite specimens and reports elsewhere in our Gem Knowledge library concern different material; their analytical findings should not be assigned to these carvings.
Care
Fluorite is about 4 on the Mohs hardness scale and has perfect cleavage, so an impact can chip or split a carving. Display it securely, keep it apart from harder stones, avoid heat and harsh cleaners, and dust or wipe it gently with a soft cloth.
Hyalite Opal necklaces and bracelets · Soul Body Gems, August 2025. Collection identification; these pieces are not represented as individually laboratory tested.
Hyalite can look like a droplet of clear glass, yet it belongs to the opal family. Some examples reveal a remarkable green glow under ultraviolet light.
A clear variety of common opal
Hyalite is a usually colorless, transparent to translucent variety of common opal. Opal is hydrated silica, and common opal generally lacks the play of color associated with precious opal. Its quiet clarity and glassy appearance are part of hyalite’s appeal.
Why some pieces fluoresce
GIA examined hyalite from several localities and found that fluorescence varied between specimens; some glowed strongly yellow-green under short-wave ultraviolet light, while another group was inert. The researchers found varying trace uranium contents associated with fluorescence in their samples. A green response cannot be assumed for every hyalite, and the study did not test the Soul Body Gems pieces shown here.
A mixed parcel of faceted gems including material supplied as Hyalite Opal · September 2025. The photograph does not identify each gem individually.
Care
Protect opal from knocks, extreme heat, and sudden temperature changes. Store jewelry separately to reduce scratches, and clean gently with a soft cloth and mild soapy water. Avoid steam and ultrasonic cleaning when a piece’s construction or treatment is unknown.
Assorted faceted gems including material supplied as Clinohumite · Soul Body Gems, September 2025. This group photograph does not identify an individual gem or document a laboratory test.
Warm color and rarity have made facetable clinohumite a mineral collector’s gem.
What is clinohumite?
Clinohumite is a magnesium silicate mineral in the humite group. The name describes a mineral species, not a color or a cut. Transparent material suitable for faceting is uncommon. GIA documented orange gem-quality clinohumite associated with spinel in a Tanzanian occurrence; that published occurrence does not establish the origin of our photographed assortment.
Why identification matters
In GIA’s report, an orange mineral first thought to be spessartine garnet was identified as clinohumite by X-ray diffraction. A warm orange appearance alone is therefore not an identification. The gems in our September photograph were supplied under their listed names, but no specimen-specific analysis is presented here.
Care
GIA gives clinohumite a Mohs hardness of about 6, softer than many familiar faceted jewelry gems. Protect facet edges from hard impacts and abrasion, store pieces separately, and use gentle cleaning with a soft cloth. Seek advice from a jeweler before mechanical cleaning of a set stone.
Assorted faceted gems including material supplied as Spanish Sphalerite · Soul Body Gems, September 2025. This shared photograph does not isolate an individual stone or serve as a laboratory identification.
Sphalerite can scatter light into vivid flashes of color, making a faceted specimen especially captivating.
Mineral and gem
Sphalerite is zinc sulfide (ZnS) and an important ore of zinc. Transparent, facet-quality material is much less common than opaque ore. Its very high dispersion can separate white light into spectral colors, while its high refractive index contributes brilliance when the gem is expertly cut. GIA has documented notable gem sphalerite from Spain; the exact mine for our September parcel is not documented here.
Handle its fire with care
GIA lists sphalerite at approximately 3.5–4 on the Mohs hardness scale and describes it as brittle with perfect cleavage. It scratches and chips more readily than harder gems. Keep a loose gem in a padded box, avoid knocks and contact with harder stones, and clean it gently without steam or ultrasonic equipment.
A separate testing story
Our library also contains a laboratory report for a different sphere once sold as “sphalerite”. That sphere tested as quartz and fluorite, without identified sphalerite. The result belongs to that sphere and does not test or characterize the Spanish faceted gems pictured here.
Strawberry Quartz is a gem trade name for pink-to-red included quartz, not a separate mineral species. Fine reddish inclusions scatter through otherwise translucent quartz and give each stone a distinctive, seed-like pattern. The pictured facets are presented by Soul Body Gems as material from Mexico.
What creates the color?
Hematite flakes are documented in some Strawberry Quartz, but the name is not tightly defined: other pink quartz materials with different inclusions have also been sold under it. Identifying the particular inclusions in these facets requires analysis; their chemistry cannot be confirmed from the photograph alone.
Care
Quartz is relatively durable, but faceted edges can still chip with a sharp impact. Store each gem separately from harder stones, and clean gently with a soft cloth or mild soap and lukewarm water. Avoid heat, steam and ultrasonic cleaning when any treatment or setting is unknown.
Metaphysical traditions
Some crystal traditions associate Strawberry Quartz with warmth, affection and a renewed sense of joy. These are personal or spiritual interpretations, not scientifically established effects.
Ammolite is the brilliant gem layer preserved in certain fossil ammonite shells from Alberta, Canada. The layer is made of aragonite, a form of calcium carbonate. These marine animals lived during the Late Cretaceous, approximately 70–75 million years ago, and their shells were buried in sediments of the Bearpaw Formation.
Why does it shimmer?
Ammolite's flashes of red, orange, green and sometimes blue or violet are iridescence: light interacting with its thin layered structure. The colorful layer is naturally fragile, and gem cutters commonly stabilize it or assemble it with a backing or protective cap. A photograph cannot establish how an individual ring stone was constructed or treated.
Care
Ammolite is delicate, especially in a ring. Protect it from knocks, scratches, heat and chemicals such as perfume or hairspray. Wipe gently with a damp, soft, non-abrasive cloth; avoid steam, ultrasonic cleaning and soaking.
Metaphysical traditions
In contemporary crystal traditions, Ammolite's ancient origin and changing colors are associated with transformation and possibility. These are symbolic interpretations, not scientifically established effects.
Tibetan Turquoise · Soul Body Gems, September 2025.
Turquoise has been treasured in Tibetan adornment for generations. The blue and green stones in our September collection invite a look at both the mineral and its cultural setting.
Science & formation
Turquoise is a hydrated copper–aluminum phosphate. It forms when copper-rich groundwater moves through rock and reacts with minerals containing aluminum and phosphorus. Its microscopic crystals form a compact mass rather than a single transparent crystal. The color ranges from blue to green; dark or tan lines can be remnants of the surrounding host rock, called matrix. Turquoise is approximately 5–6 on the Mohs hardness scale.
Tibetan adornment
Turquoise has a long place in the jewelry and arts of Tibet. The Metropolitan Museum of Art documents turquoise earrings from the Lhasa area and describes their blue stones as associated with health and life. “Tibetan Turquoise” identifies this collection's supplied material; the photographs do not establish a particular mine or independently verify geographic origin.
Because turquoise can be porous, some material is stabilized with wax or polymer or treated with dye. Treatment cannot be established for these stones from their photos. Keep turquoise away from perfume, cosmetics, high heat and harsh chemicals. Clean gently with warm, soapy water and a soft cloth; do not use steam or ultrasonic cleaners.
Phenakite facets supplied as Brazilian material · Soul Body Gems, September 2025.
Known to mineral collectors as a crystal, Phenakite can also yield remarkably clear faceted gems. This page focuses on the gem material supplied to Soul Body Gems from Brazil.
What is Phenakite?
Phenakite is beryllium silicate, Be₂SiO₄. It crystallizes in the trigonal system and measures about 7½–8 on the Mohs hardness scale. Its name comes from a Greek word meaning “deceiver,” a reference to its resemblance to quartz. Phenakite is the accepted mineral name; phenacite is an older alternative spelling for the same mineral, not another species.
A Brazilian gem expression
Transparent Phenakite crystals occur in Brazilian pegmatites, and some are suitable for faceting. GIA notes that fashioned Phenakite is an unusual gemological encounter. The material in our photograph was supplied as Brazilian Phenakite; the image itself cannot confirm identity, exact locality or treatment. Our Norwegian Phenakite material has its own profile because it has a different provenance and presentation, while sharing the same mineral identity.
Care
Phenakite resists everyday surface scratches better than many softer gems, but hardness does not make a faceted stone immune to chipping. Protect facet edges from knocks and store gems separately. Use gentle cleaning appropriate to the setting rather than assuming all mounted stones tolerate steam or ultrasonic cleaning.
Genuine Chrysanthemum Stone palms · Soul Body Gems, September 2025.
White, radiating patterns seem to bloom across the dark surface of these polished palms. “Chrysanthemum Stone” names that flower-like appearance, not a fossil flower or a single mineral species.
How do the flowers form?
The “petals” are mineral formations preserved within a contrasting rock. Their composition varies by occurrence: studies of Chinese Chrysanthemum Stone describe celestine in some material and replacement assemblages that include calcite, chalcedony and other minerals in others. The shape alone cannot identify which minerals form the white rays in these particular palms.
Natural pattern and constructed pieces
This collection is presented as genuine Chrysanthemum Stone with naturally occurring flower patterns, separate from assembled floral specimens discussed elsewhere in our Gem Knowledge library. Marketed Chrysanthemum Stone may also have its darker matrix painted to exaggerate contrast. We have not published a laboratory determination of the mineral phases or surface treatment for this batch, so we do not assign a specific chemical formula or mineral name to its petals.
Care
Protect polished surfaces from abrasion and impact. Dust with a soft, dry cloth; if needed, use a slightly damp cloth and dry promptly. Avoid harsh cleaners or soaking when a stone's mineral mixture and any surface treatment have not been established.
Kammererite SS Pendants · Soul Body Gems, November 2024.
The photograph shows our Kammererite SS pendants. The locality of these pictured pendants was not specified in the archive label.
What is Kammererite?
Kammererite, also spelled Kämmererite, is a familiar name for chromium-bearing clinochlore, a member of the chlorite group. Chromium contributes to the pink, violet and reddish-purple colors seen in some specimens. Kammererite is a variety name, not a separate mineral species from clinochlore.
The Turkey connection
Mineralogical studies document chromium-bearing clinochlore from eastern Turkey, including the Keşiş Mountains in Erzincan Province and the Kop Mountains in Erzurum Province. The studied crystals occur with chromium-rich rocks and can line small openings in altered ultramafic rock. Those published observations describe the region; they do not establish a precise mine for our photographed pieces.
Our September 2025 specimens
Our supplier identified the raw specimens in the photograph as Kammererite from Turkey. Soul Body Gems has not laboratory tested this group or independently verified its exact locality. Color and appearance in a photograph cannot by themselves confirm the mineral species or the source of an individual specimen.
Care
Clinochlore has prominent cleavage, so protect raw crystal surfaces from rubbing, knocks and harder minerals. Handle gently and store separately when possible.
No specimen-specific Soul Body Gems laboratory report accompanies this Turkey collection. Our separately tested Indian Kammererite pieces have their own profile and reports.
Orange Hematite Tangerine Quartz · September 2025 collection, supplied as Saxrönningen, Sweden.
Warm red and orange color glows through sprays of quartz crystals in this small collection offered to Soul Body Gems from Saxrönningen, Smedjebacken, Dalarna, Sweden.
Quartz, hematite and the “tangerine” name
“Tangerine Quartz” describes the orange appearance; it is not a separate quartz species. The supplier describes this material as quartz colored internally by hematite inclusions, rather than a surface coating. An independently cataloged Saxrönningen quartz specimen is also described as orange from hematite inclusions. That locality observation supports the geological possibility, but it is not an analysis of the particular sprays pictured here.
The Saxrönningen locality
Mineralogical locality records list orange quartz at Saxrönningen, worked as a staked claim for mineral specimens. Our source described the pocket for this September collection as very small and now filled in. We have not independently verified the pocket's present access, production history, or whether further specimens could be found there, so rarity and future availability cannot be guaranteed.
Collection notes and care
This September 2025 group has not received a specimen-specific Soul Body Gems laboratory report. Keep crystal points from knocking against harder objects or one another; dust gently with a soft brush and store separately. Locality and inclusion descriptions are supplier information unless confirmed by testing.
Swedish Orange Hematite Tangerine Quartz · September 2025, photograph 4 of 4
These four photos document additional views of the collection. Their precise inclusions and origin have not been confirmed by a specimen-specific laboratory report.
Chile Nopal SS Pendants · Soul Body Gems, October 2024.
Blue Nopal is the collection name for these richly blue Chilean stones set in adjustable stainless steel rings. The name invites a closer look at the color and pattern, while the material deserves its own careful description.
How does it relate to Chilean blue opal?
This collection was supplied as Blue Nopal from Chile and is grouped with our Blue Opal (Chile) material. “Blue Nopal” is a trade or collection name, not an independently defined mineral species. A GIA field report describes blue to blue-green Chilean opal offered at Tucson in 2024, but explicitly notes that detailed mineralogical analyses of those displayed samples had not been published. It proposed light scattering and dispersed chrysocolla as possible color contributors; those are hypotheses for that reported material, not verified causes of color in these rings.
What is known about this batch?
The photograph documents the September 2025 jewelry; supplier identification and Chilean origin have not been independently confirmed for these particular stones. We do not infer a mine, a color treatment, a polymer impregnation, or a precise mineral mixture from appearance. Findings on other tested Blue Opal (Chile) pieces, where available on their own pages, apply to those tested specimens only.
Care
Remove the rings before impact-prone work, cleaning products, or prolonged soaking. Wipe the stones gently with a soft cloth and dry the stainless steel setting after wear. A treatment or porosity assessment would be needed for more specific care advice.
Dickite collection · September 2025. Separate from our Blue Dickite material.
This September collection arrived under the mineral name Dickite. Its gentle surfaces and subtle variation invite a closer look at one member of the kaolin group.
What is dickite?
Dickite is a recognized clay mineral in the kaolinite subgroup, with the formula Al2Si2O5(OH)4. It shares that composition with related kaolin minerals that differ in their crystal structures. Specialized analysis, especially X-ray diffraction, can help separate dickite from kaolinite, nacrite and other look-alike fine-grained materials.
How this collection differs from Blue Dickite
These are the newly photographed stones supplied as Dickite in September 2025. The separate Blue Dickite page concerns a different collection and its own identification history; its sample-specific conclusions do not establish the composition of this one. We have not published an analysis for the pictured Dickite pieces or verified their source locality.
Care
Handle gently, keep dry when practical, and avoid abrasive or chemical cleaning. A soft, dry cloth is a good first choice for polished pieces when the exact mineral mixture and surface treatment are unknown.
Permineralized wood supplied from Germany · September 2025.
A trace of ancient wood preserved in stone: this September 2025 piece was supplied to Soul Body Gems as fossil wood from Germany.
What does “permineralized” mean?
Permineralized is the usual scientific spelling; “perminalized” is an alternate misspelling sometimes used in searches. Groundwater carries dissolved minerals into the tiny pores of buried wood, where minerals precipitate and can preserve its internal structure. Replacement of original tissue may happen alongside pore filling. This is a process of fossilization, not the name of one mineral: silica is common, while the actual mineral assemblage can vary.
German fossil wood
Studies of German fossil wood, including research at Kyffhäuser, show that silica mineralization can preserve wood at the cellular scale and may record a long history of geological change. That research is context for this material, not a claim that the photographed piece came from Kyffhäuser or shares the studied wood's age or composition. We have no independently verified excavation locality or specimen-specific mineral analysis for this September group.
Care
Protect edges and polished surfaces from impact and scratching. Clean with a soft, lightly damp cloth if needed, then dry fully; avoid prolonged soaking or harsh chemicals when mineral composition and any treatments have not been determined.
Another February 2026 collection view; this photograph is not a specimen-specific laboratory analysis.
Tetraferriphlogopite belongs to the mica family. Its long name tells a structural story: ferric iron occupies a position in the silicate sheets that aluminum fills in ordinary phlogopite.
What is it?
Tetraferriphlogopite is a recognized mineral species in the biotite group of micas, with the ideal formula KMg3(Si3Fe3+)O10(OH)2. The “tetraferri” part refers to iron in the tetrahedral sheet, not a claim that the specimen contains four separate kinds of iron. The modern mineral name has no hyphen; older literature may call it “tetra-ferriphlogopite.”
A mineral of layers
Like other micas, its crystal structure is built from stacked silicate sheets, which can part along the layers. Scientists have examined natural Tetraferriphlogopite from carbonatite-related rocks in Brazil and elsewhere. Those studied occurrences explain the mineral, but do not establish a locality for our pictured material.
About this collection
Our February 2026 material was supplied as Tetraferriphlogopite. We have not published a specimen-specific laboratory identification or verified a mine of origin for the pictured piece. Similar-looking micas require analytical work to distinguish, especially when the distinction rests on where iron sits in the structure.
Care
Protect the edges and layered surfaces from rubbing or knocks. Dust gently with a soft, dry brush and store the specimen separately from harder stones.
Another September 2025 collection view; this photograph is not a specimen-specific laboratory analysis.
Sericho is the official name of a meteorite found in Kenya. It is classified as a pallasite, a stony-iron meteorite in which olivine crystals sit within iron-nickel metal.
The Sericho discovery
The Meteoritical Bulletin records Sericho as a 2016 find near Habaswein and Sericho in Kenya. Local camel-herders had known the large masses for years before their recognition as meteorites. The official classification describes rounded, sometimes translucent olivine grains surrounded mainly by iron-nickel metal. Sericho is a meteorite name, not a mineral species or a location guarantee for every specimen sold under the name.
About our specimen
Our September 2025 piece was supplied as Sericho Pallasite. We have not published a specimen-specific laboratory classification or a documented chain of custody tying this individual piece to the officially classified find. Its visible pattern alone cannot establish that provenance. “Pallastite,” sometimes written in listings, is a spelling error for pallasite.
Care
Because pallasites contain iron-nickel metal, keep the specimen dry and away from prolonged humidity. Handle polished or cut faces with clean, dry hands and use a soft, dry cloth for dust. Store separately to protect the olivine and the surface finish.
Faceted Imperial Topaz hearts · Soul Body Gems, September 2025.
A gem-focused look at the warm color, lively cut and delicate heart outline of the Imperial Topaz facets in our September collection. This is separate from our page about topaz crystals and mineral specimens.
What makes a topaz “Imperial”?
Topaz is its own mineral species, while Imperial Topaz is a trade color term, not another species or a standardized gem grade. GIA describes the prized range as warm orange, pink and reddish hues, but notes that dealers do not all draw the boundary in the same place. For a cut gem, the actual hue, saturation, clarity and appearance matter more than the label alone.
Looking at faceted hearts
Cutters orient topaz to bring out color and brilliance; topaz can show different colors in different crystal directions. A heart cut adds the challenge of balanced lobes, a defined cleft, a graceful point and lively light return across both halves. In the pictured collection, the stones were supplied as Imperial Topaz. A photograph does not establish their precise color origin, treatment history or independent identification, so no specimen-specific laboratory conclusion is claimed here.
Care for topaz gems
Topaz is 8 on the Mohs scratch-hardness scale but has perfect cleavage and can chip or split after a sharp impact. Protect the point and facet edges of heart cuts. Clean with warm, soapy water and a soft brush; avoid steam and ultrasonic cleaners, sudden temperature changes and prolonged heat.
Schalenblende SS Pendants · Soul Body Gems, December 2024.
Concentric bands, warm brown and cream tones, and metallic accents give Schalenblende its distinctive layered appearance.
What is Schalenblende?
Schalenblende is a compact mineral aggregate rather than a single mineral species. It is dominated by fine-grained sphalerite, a zinc sulfide, arranged in curved or concentric layers. Other sulfides may be intergrown with it, including galena, marcasite and pyrite; wurtzite may occur in some material. The exact mineral mixture varies between specimens.
Layers revealed by polishing
Cutting across the layered growth exposes flowing bands and rounded patterns. Polished pieces can combine cream, yellow and brown sphalerite-rich areas with contrasting metallic minerals. Schalenblende is documented from European ore deposits, including the Olkusz district of Poland. That occurrence does not establish the mine or origin of the pendants pictured here.
Separate from Wood Schalenblende
This page covers Schalenblende as a sulfide-rich material. Our Wood Schalenblende (Poland) page concerns a different marketed material identified in its report as limestone/calcite. The two names should not be treated as interchangeable.
Our collection
The photograph shows Schalenblende SS pendants from December 2024. It is a collection reference; no laboratory result for these individual pendants is presented on this page.
Abalone SS Pendants · Soul Body Gems, October 2024.
Abalone shell brings the changing colors of the sea into jewelry and decorative objects. Its luminous inner surface is nacre, also called mother-of-pearl.
What is abalone?
Abalone are marine gastropods of the genus Haliotis. They have a single ear-shaped shell and inhabit coastal rocky environments. Shell is a material made by a living animal, rather than a crystal grown in a geological deposit.
Why the colors change
Abalone nacre contains closely packed layers of aragonite platelets. Light interacting with this layered structure produces interference and diffraction, creating iridescent colors that change with viewing angle. In nacre, this optical effect is called orient. The appearance comes from the shell’s fine structure, rather than simply from a colored pigment.
Shell in jewelry
Its vivid mother-of-pearl surface makes abalone popular for decorative shell pieces and jewelry. Shell, a pearl, and an assembled blister-pearl product are different forms of material, even when all originate from abalone. The photographs show our abalone shells and jewelry. They do not establish an exact species or collecting locality.
Green Turbo Seashell · also known in our collection as Jade Turbo.
A spiral form, green and teal markings, and a pearly sheen make these polished turbo shells a distinctive part of our shell collection. We list this same material under Green Turbo Seashell and Jade Turbo.
Shell shaped by a marine snail
Turbo shells are produced by marine gastropods—sea snails—in the family Turbinidae. Their coiled, turban-like form differs from the flattened, ear-shaped form of abalone shells. Both belong among organic gem and decorative materials rather than geological crystals.
What “Jade Turbo” means
Jade Turbo is the alternate collection name used here for these green turbo seashells. The word “jade” describes the name under which they are offered; it does not identify the shell as jadeite or nephrite. These are seashells, not mineral jade.
Mother-of-pearl and appearance
Many Turbo shells have nacreous interiors. The polished shells shown here display green and teal markings alongside pearly white areas. Their curved surfaces catch the light differently as the viewing angle changes.
The green snail connection
One well-known member of the genus is Turbo marmoratus, the green snail. FAO describes it as a tropical coral reef species, and CSIRO records its shell’s use in carving and jewelry. This provides background on Turbo shell materials; an exact species and collecting locality for these pictured shells have not been documented here.
Care
Handle shell gently and protect it from knocks. Clean with a soft damp cloth, then dry gently. Avoid acidic cleaners, abrasive scrubbing and prolonged soaking.
Green Turbo Seashell · also known in our collection as Jade Turbo.
A spiral form, green and teal markings, and a pearly sheen make these polished turbo shells a distinctive part of our shell collection. We list this same material under Green Turbo Seashell and Jade Turbo.
Shell shaped by a marine snail
Turbo shells are produced by marine gastropods—sea snails—in the family Turbinidae. Their coiled, turban-like form differs from the flattened, ear-shaped form of abalone shells. Both belong among organic gem and decorative materials rather than geological crystals.
What “Jade Turbo” means
Jade Turbo is the alternate collection name used here for these green turbo seashells. The word “jade” describes the name under which they are offered; it does not identify the shell as jadeite or nephrite. These are seashells, not mineral jade.
Mother-of-pearl and appearance
Many Turbo shells have nacreous interiors. The polished shells shown here display green and teal markings alongside pearly white areas. Their curved surfaces catch the light differently as the viewing angle changes.
The green snail connection
One well-known member of the genus is Turbo marmoratus, the green snail. FAO describes it as a tropical coral reef species, and CSIRO records its shell’s use in carving and jewelry. This provides background on Turbo shell materials; an exact species and collecting locality for these pictured shells have not been documented here.
Care
Handle shell gently and protect it from knocks. Clean with a soft damp cloth, then dry gently. Avoid acidic cleaners, abrasive scrubbing and prolonged soaking.
Palm Root Fossil SS Pendants · Soul Body Gems, December 2024.
Fossil plant material brings organic patterns into polished stone. These pendants were supplied to Soul Body Gems as palm root fossil from Indonesia.
From plant tissue to mineral
Plant remains can be preserved through permineralization, in which minerals fill pore spaces, and replacement, in which mineral matter substitutes for the original tissue. Silica can participate in both processes, preserving features of the plant structure as the material becomes stone. Petrified plant material is not a single mineral species.
Palm root and Indonesian provenance
Palm Root Fossil is the collection name for the Indonesian material pictured here. The country is the supplied provenance; a precise collecting locality, geological age and botanical species have not been established for these pendants. Palm wood and palm roots are different plant tissues, so identifying one does not automatically establish the other.
Our December 2024 collection
The photograph shows Palm Root Fossil SS pendants. Their polished surfaces reveal contrasting natural patterns. This collection photograph accompanies general fossilization information and does not represent a specimen-specific laboratory report.
Hollandite in Quartz (Amethyst and Citrine) · Soul Body Gems, December 2024.
Quartz can preserve tiny mineral inclusions as natural details within a transparent host. Our December 2024 collection was supplied as Hollandite in Quartz, in amethyst and citrine-colored pieces.
Understanding the name
Hollandite is an oxide mineral name, while quartz is the host. The collection name describes inclusions attributed to hollandite within quartz; it is not a separate quartz species. Amethyst and citrine describe the purple and yellow varieties of quartz.
Looking beyond appearance
Dark radiating inclusions are sometimes described as stars or sea-urchin forms. Their shape alone does not establish their mineral identity. GIA has identified sea-urchin-like inclusions in quartz as hedenbergite, and separate black fibrous inclusions as mannardite, using Raman spectroscopy. These studies demonstrate why an inclusion name should be confirmed analytically rather than assigned from a photograph.
Our December collection
The image documents the pieces supplied to Soul Body Gems under the Hollandite in Quartz name. No specimen-specific laboratory identification of their inclusions is presented here, and no precise mine or treatment history is inferred.
Hollandite in Clear Quartz · Soul Body Gems, December 2024.
Clear quartz provides a transparent setting for dark mineral inclusions. This page focuses on our clear-quartz collection supplied as containing hollandite, separately from the amethyst and citrine-colored material.
The clear quartz host
Clear quartz is the colorless variety of quartz. Transparency can make individual inclusions easier to examine, with dark clusters standing out against the host. Hollandite refers to an included oxide mineral, rather than a distinct species of quartz.
Identifying the inclusions
A radiating or star-like habit is a useful visual description, but does not by itself identify the inclusion. GIA has documented sea-urchin-like hedenbergite inclusions and black fibrous mannardite inclusions in quartz, identified through Raman spectroscopy. Those examples illustrate why appearance should be distinguished from a confirmed mineral identification.
Our collection
The photograph shows our December 2024 material supplied as Hollandite in Clear Quartz. No specimen-specific laboratory result is presented for these pieces. For the separate colored collection, visit Hollandite in Quartz (amethyst and citrine).
Barite and barite with a sparkling metallic coating, supplied as Lubin Mine material · Soul Body Gems, September 2025.
Creamy, rounded barite forms beside a glittering metallic surface give this Polish collection its striking contrast. These pieces were supplied to us as barite and “barite with marcasite” from the Lubin Mine.
Barite, baryte and the metallic crystals
Barite and baryte are spellings for the same heavy barium sulfate mineral, BaSO₄. Marcasite and pyrite are distinct iron sulfide minerals with the same chemical formula, FeS₂, but different crystal structures. The shiny grains on a specimen cannot be identified reliably from a collection photograph alone.
The Lubin story
Lubin in southwest Poland is a working copper-and-silver mining district. Documented specimens from a large 2011 find at the Lubin Główny shafts show concentric, rounded barite aggregates with a fine metallic coating. The locality occurrence record identifies that coating as pyrite microcrystals, not marcasite. The “Barite Marcasite” title preserves the supplied collection name; it should not be read as a laboratory identification of our pieces.
The account supplied with this group describes an unusually large cavity opened during work in 2011, barite-covered walls and an eventual concrete backfill, leaving only material recovered before the cavity was closed. We can corroborate a 2011 Lubin barite find, but not the supplied cavity dimensions, the backfill details or an individual piece's chain of custody to that particular pocket. “Lubin,” rather than “Lupin,” is the mine and town name.
Care
Barite has a relatively low Mohs hardness of about 3–3½ and cleaves, so protect projecting crystals and polished faces from pressure and abrasion. Keep metallic-coated pieces dry, dust gently with a soft brush and avoid soaking or chemical cleaning, especially while the metallic phase has not been confirmed.
Locality records describe other specimens. They do not replace laboratory identification or documented provenance for the September pieces pictured here.
Morado Opal (Mexico) · stainless steel necklaces and bracelets from the September 2025 collection.
Lavender and violet, often set against softer pale areas, make Morado Opal a distinctive member of the Mexican opal family. These September 2025 necklaces and bracelets give the material its own place in our collection.
What is Morado Opal?
Morado means purple in Spanish. It is a trade name for purple common opal from Mexico, rather than a separate mineral species or a promise of rainbow play-of-color. GIA studied examples offered under this name and documented purple fluorite inclusions as the source of color in those samples. The observed range included mottled purple-and-light material and more even, darker purple material. That published observation describes GIA's samples; the inclusions in our finished jewelry have not been analyzed.
Our September 2025 collection
These necklaces and bracelets were supplied as Morado Opal from Mexico. No specimen-specific laboratory report accompanies them, so we do not claim a precise mine, verified fluorite content, or a treatment determination for these pieces. Morado Opal is presented separately from our Mexican fire opal and other opal collections because the trade name describes a different visual tradition: purple bodycolor in common opal.
Care
Opal can scratch or fracture with hard wear, and strong heat or sudden temperature changes can damage it. Remove the jewelry before impact-prone activities. Clean gently with a soft cloth or a little warm, soapy water; dry the metal setting afterward. Avoid steam and ultrasonic cleaning, and store it apart from harder gems.
Tourmaline supplied as Paraiba Tourmaline from Mozambique · Soul Body Gems, September 2025.
The Paraiba name began with vivid copper-bearing tourmaline from Brazil. Similar blue-to-green tourmaline is also found in Mozambique. This profile follows the faceted gem supplied to our September collection as Mozambican material, with its own provenance distinct from our Brazil page.
The name and the color
Paraiba is a gem trade name, not a separate mineral species or an automatic statement of Brazilian origin. In gemological usage, qualifying tourmaline can come from Brazil, Mozambique or Nigeria. Copper, together with manganese, is central to the characteristic vivid color range. A blue or green photograph alone cannot establish the presence of copper or whether a particular stone meets the laboratory criteria for this name.
Mozambique and origin
Gemological research documents copper-bearing tourmaline from Mozambique. The country of origin can matter to collectors, but the appearance of an individual stone does not securely separate Mozambican from Brazilian or Nigerian material. GIA uses quantitative trace-element analysis, including LA-ICP-MS and comparison with reference stones, for geographic-origin determinations; some results remain inconclusive. Our gem was supplied as material from Mozambique. We have not presented a specimen-specific laboratory determination of its copper content, geographic origin or treatment history.
Care for a faceted tourmaline
Tourmaline is about 7–7½ on the Mohs scratch-hardness scale, yet facet edges can still be damaged by sharp impacts. Clean with warm, soapy water and a soft brush. Avoid steam and ultrasonic cleaners, as well as sudden temperature changes; some tourmaline colors may also have been modified by heat or irradiation.
Covellite in Quartz from the October 2025 Soul Body Gems collection. The pictured piece has not been individually laboratory tested.
Quartz with tiny reflective inclusions can show a vivid pink or purple flash as the stone moves in light. This October collection was supplied as Covellite in Quartz from Brazil.
What creates the flash?
Covellite is a copper sulfide. GIA studied similar near-colorless and smoky quartz with thin, plate-like inclusions and reported a high probability that the inclusions were covellite. Their reflected light produced a bright pink effect often marketed as “pink fire” quartz.
Brazilian provenance
The GIA stones were reportedly from Minas Gerais, Brazil. Brazil is the supplied origin of our photographed collection as well; the image alone cannot confirm a mineral identification or mine locality. See GIA, Gems & Gemology, Spring 2005, pp. 47–48.
Scolecite Merkaba · October 2025 · Soul Body Gems collection photograph.
Merkaba describes the carving’s three-dimensional star shape. This page gathers the form across several gem materials rather than treating “Merkaba” as a mineral.
The shape
In geometry, the form is a compound of two interpenetrating tetrahedra, often called a star tetrahedron or stella octangula. Carvers create its points and intersecting triangular faces in materials with very different colors and textures. The name used for a carving does not identify the stone it is cut from. See Wolfram MathWorld: Polyhedron Compound for the geometric form.
Ethiopian Water Opal from the November 2025 Soul Body Gems collection, shown in its water-filled display vessel.
A world of shifting blue and green light, preserved in water. This page focuses on our Ethiopian specimen opal supplied for permanent submerged display.
What we mean by Ethiopian Water Opal
Here, “Water Opal” names the collection material that must remain fully submerged at all times, following its supplied care requirements. It is a display specimen rather than an opal intended for ordinary dry jewelry use. Ethiopian origin is the supplied provenance; this photograph does not establish a particular mine, treatment history or laboratory classification.
Silica, water and moving color
Opal is hydrated silica, written SiO2·nH2O. In precious opal, ordered microscopic structures diffract visible light to produce play-of-color. The arrangement of those structures affects the colors seen as the specimen and viewing angle change.
Why drying matters
Research distinguishes opals kept in water after extraction from specimens stored successfully in air. Chauviré and colleagues linked cracking in their water-stored samples to drying shrinkage. Stability depends on the material’s internal structure and water behavior; an opal’s country of origin alone does not determine whether it can safely dry.
Water-stored specimens and hydrophane opal
Hydrophane describes opal that readily absorbs water through its pores. It is not a synonym for “must live underwater.” GIA documents that immersion can enlarge cracks in some hydrophane opals. Likewise, a “non-hydrophane” trade label does not by itself establish resistance to drying. Our pictured specimen has not been assigned a hydrophane classification through this image.
Caring for this collection
Keep these specimens permanently and fully submerged in their water-filled display vessels. Check the water level and secure the vessel so the opal cannot become exposed as water is lost. Avoid heat, direct sunlight and attempts to dry the specimen for photography or display. Follow the supplied instructions when servicing the vessel; do not introduce oils, dyes or cleaning additives.
This care instruction applies to our water-stored specimen material. It should not be extended to every Ethiopian opal, faceted gem, bead or jewelry piece.
Vein 8 Ocean Jasper nine-tailed fox carving from our November 2025 collection. The stone name records the supplied material description.
Nine sweeping tails turn a fox into a creature of imagination: a shapeshifter whose stories ask us to look beyond appearances.
One motif, several traditions
Related fox spirits appear across Chinese, Japanese and Korean folklore. The Chinese nine-tailed fox is known as jiuweihu, while Japanese fox-spirit traditions include kitsune and Korea has the gumiho. These traditions overlap, but their stories and moral meanings are not interchangeable.
Transformation and hidden identity
In Japanese art, the story of Tamamo no Mae gives the nine-tailed fox a beautiful human disguise and a dangerous power to enchant. The Metropolitan Museum of Art documents this legend in an 1835 print. Its transformation offers a powerful theme for a carving: what we see on the surface may not reveal a being’s whole nature.
A symbol with light and shadow
Korea’s Ministry of Culture describes the gumiho as often threatening in older stories, with modern portrayals also exploring love and the wish to become human. It notes that Chinese and Japanese counterparts can carry favorable associations. The motif therefore has no single universal meaning of luck, protection or love.
Meaning in a contemporary collection
For us, a nine-tailed fox carving can invite reflection on adaptability, imagination, discernment and the many parts of a developing identity. These are contemporary personal interpretations, rather than one fixed ancient doctrine. A collector may choose the fox for its story, the rhythm of its tails or simply the artistry of the carving.
Spiritual or metaphysical associations are matters of belief and personal practice. They are separate from the mineral identity of the stone and do not establish physical or healing effects.
Canadian Eudialyte from our November 2025 personal collection release. Canada is the supplied origin; a particular mine has not been established for this piece.
Pink-to-red mineral areas bring vivid contrast to eudialyte-bearing rock. This page explores Canadian occurrences separately from our Russian Eudialyte collection.
What is eudialyte?
Eudialyte is a complex zirconium-bearing silicate associated with unusual alkaline rocks. Related minerals form the eudialyte group, so an exact species identification requires more than a red or pink appearance. A polished piece can contain several minerals alongside its eudialyte-bearing areas.
Canadian geology
Edgar and Blackburn’s study in The Canadian Mineralogist describes pink granular eudialyte in syenitic rocks near the Kipawa River in Québec. Their samples included bands of feldspar, pyroxene and amphibole. The paper also records other Canadian occurrences, including Mont Saint-Hilaire and Labrador.
Mont Saint-Hilaire’s mineral reference describes eudialyte in crystals and masses, with red, orange and pink colors, and notes the occurrence of several related group members. These localities explain why “Canadian Eudialyte” is meaningful provenance, but the country name alone cannot assign our photographed piece to a particular deposit.
Reading a polished piece
Polishing brings the rock’s contrasting areas together in one surface. Color and pattern make each piece distinctive, while composition and exact group membership remain questions for mineralogical analysis. No specimen-specific laboratory report is attached to this collection photograph.
Australian Prehnite brings translucent green and yellow color to polished cabochons. These pieces were offered in our December 2025 collection as Australian Bio Prehnite.
What is prehnite?
Prehnite is a calcium-aluminium silicate mineral with the formula Ca₂Al₂Si₃O₁₀(OH)₂. Its orthorhombic structure, glassy luster and typically green-to-yellow color give it a distinctive appearance. Its Mohs hardness is about 6–6.5; cleavage and brittleness also matter when choosing a jewelry setting.
Australian occurrences
Prehnite forms in cavities and veins in volcanic rocks and in some rocks affected by low-grade metamorphism. Documented Australian occurrences include the Warrumbungle region and Prospect Hill in New South Wales. Gem material is also reported from Wave Hill in the Northern Territory.
Australia is the supplied provenance for the photographed cabochons. Their precise locality and accompanying minerals have not been established here. “Bio Prehnite” is retained as the collection name; it is not a separate mineral species or a claim about biological origin.
Phosphosiderite is an iron phosphate mineral known for delicate violet and pink color. These stretch bracelets were offered in our December 2025 collection.
Mineral identity
Phosphosiderite has the formula FePO₄·2H₂O and crystallizes in the monoclinic system. It is a dimorph of strengite: the two share a chemical formula but have different crystal structures. Its mineral name refers to phosphate and iron.
Appearance and formation
It can occur as small crystals or massive material, commonly as a secondary alteration product of other phosphate minerals. The species is documented at several localities worldwide. The name alone does not establish the origin of an individual bead.
The photographed bracelets are identified by their supplied collection name. Their individual composition and any treatments have not been established by a specimen-specific laboratory report on this page.
“Silky Spinel” describes spinel admired for a soft, hazy or velvety appearance rather than a separate mineral species.
What creates a silky appearance?
Fine internal inclusions can scatter light and soften a gem’s transparency. Spinel can contain many kinds of inclusions: GIA documents carbonate crystals, apatite, mineral-filled cavities and, in some stones, needle-like or plate-like inclusions associated with star effects.
A silky appearance does not automatically mean a stone will display a star. The inclusions, their orientation and the cut all matter. Microscopic examination is needed to identify the inclusions in an individual gem; the photograph alone does not establish their mineral identity.
Collection notes
The pictured stone is presented under its supplied Silky Spinel name. Its exact source and treatment history are not established by a laboratory report on this page. Spinel (Silky) is an alternate directory name for the same material profile.
“Silky Spinel” describes spinel admired for a soft, hazy or velvety appearance rather than a separate mineral species.
What creates a silky appearance?
Fine internal inclusions can scatter light and soften a gem’s transparency. Spinel can contain many kinds of inclusions: GIA documents carbonate crystals, apatite, mineral-filled cavities and, in some stones, needle-like or plate-like inclusions associated with star effects.
A silky appearance does not automatically mean a stone will display a star. The inclusions, their orientation and the cut all matter. Microscopic examination is needed to identify the inclusions in an individual gem; the photograph alone does not establish their mineral identity.
Collection notes
The pictured stone is presented under its supplied Silky Spinel name. Its exact source and treatment history are not established by a laboratory report on this page. Spinel (Silky) is an alternate directory name for the same material profile.
Blue Cap Tourmaline · Soul Body Gems, September 2024.
Blue Cap Tourmaline is the collection name for these blue tourmaline crystals associated with quartz. The photographs below show four special specimens from our December 2025 collection.
Tourmaline and color zoning
Tourmaline is a group of related minerals rather than a single composition. Individual crystals can develop different color zones as the chemistry of their growth environment changes. A contrasting tip or cap is one possible expression of that growth history.
Blue and greenish-blue tourmaline is often described as indicolite in the gem trade. Color alone does not identify its precise mineral species or establish copper content. The Blue Cap name is used here as a descriptive collection label, not as a separate mineral species.
These specimens
The collection is presented under its supplied Blue Cap Tourmaline in Quartz identification. No specimen-specific laboratory report or exact mine locality is attached to this page. The four photographs are collection illustrations; no main profile photograph has been assigned.
Strawberry Agate (Mozambique) and Swazi Agate are the two collection names used for this material.
Agate and its patterns
Agate is an ornamental variety of chalcedony, a finely crystalline silica material. Polishing reveals contrasting colors and patterns within the stone. “Strawberry” and “Swazi” are descriptive trade names here, rather than separate mineral species.
Collection notes
Mozambique is the supplied provenance. This profile records the collection name and photograph; no specimen-specific laboratory identification or exact mine locality is established here. Both directory names lead to the same material information.
Strawberry Agate (Mozambique) and Swazi Agate are the two collection names used for this material.
Agate and its patterns
Agate is an ornamental variety of chalcedony, a finely crystalline silica material. Polishing reveals contrasting colors and patterns within the stone. “Strawberry” and “Swazi” are descriptive trade names here, rather than separate mineral species.
Collection notes
Mozambique is the supplied provenance. This profile records the collection name and photograph; no specimen-specific laboratory identification or exact mine locality is established here. Both directory names lead to the same material information.
A profile focused on faceted spinel whose apparent color changes with the lighting.
Why the lighting matters
A gemstone selectively absorbs parts of the light passing through it. Daylight-equivalent and incandescent illumination have different spectral compositions, so some spinels appear bluer in one and more violet in the other. GIA has documented this behavior in faceted spinel; it is not present in every stone.
Viewing faceted gems
Compare the same gem under different lights while keeping the viewing angle similar. Camera white balance and exposure can also affect photographs. The pictured gems are supplied as Color Change Spinel; the photos do not establish an exact color-change grade, origin or treatment history.
A locality-focused profile for the Swedish Eudialyte collection, separate from our Canadian and Russian material.
Swedish mineral background
Norra Kärr in southern Sweden is a documented occurrence of eudialyte-group minerals. Research describes these as complex zirconium silicates and records several compositional varieties within the same alkaline complex. This diversity means one analyzed specimen cannot stand for every piece from the area.
Our collection
Sweden is the supplied provenance for the pictured material. Its specific deposit has not been documented here, so the Norra Kärr information provides regional mineral context rather than a confirmed mine attribution for this piece.
Arfvedsonite is a dark, sodium- and iron-bearing mineral in the amphibole group, also offered in polished beads.
The mineral
It forms monoclinic crystals and occurs in alkaline igneous rocks and pegmatites. Mineral references describe black material, sometimes deep green at thin edges, with a glassy luster and a hardness of about 5–6.
Beads and mixed material
The collection includes an Arfvedsonite bracelet and a bracelet supplied as Garnet in Arfvedsonite. These are collection identifications; the exact mineral assemblage of the beads has not been established by a laboratory report on this page.
Faceted zircon is prized for sparkling brilliance and colorful fire. This profile focuses on cut gems, including our XL facets.
Color and sparkle
Zircon occurs in blue, yellow, green, reddish brown and other colors. Colorless gems can show particularly vivid flashes of spectral color. Cutting and proportions affect how a faceted stone returns light.
Our collection
The featured facets are presented under their supplied Zircon identification. Color, origin and treatment should be documented for individual gems; a collection photograph does not establish those details.
Villiaumite is a sodium fluoride mineral, NaF, known for carmine-red, pink and orange colors. It belongs to the cubic crystal system.
Mineral character
The Handbook of Mineralogy describes villiaumite as commonly granular or massive, with cubic crystals comparatively rare. It has a glassy luster, perfect cubic cleavage and a Mohs hardness of 2–2.5. It occurs in nepheline syenite and related pegmatites, with documented localities including Guinea, Russia and Greenland.
Care
Villiaumite is brittle and water-soluble. Keep specimens dry; avoid soaking, washing or water-based cleaning. Its low hardness calls for gentle handling and protected display.
Our collection
These photographs show our December 2024 material supplied as Villiaumite. A locality and specimen-specific laboratory identification have not been established for these photographed pieces.
Rainbow Pyrite is a descriptive name for pyrite showing iridescent surface colors. The underlying mineral is iron disulfide, FeS₂.
Pyrite and its appearance
Pyrite belongs to the cubic crystal system and is usually metallic and brass-yellow. Its familiar forms include cubes, octahedra and pyritohedra. The Handbook of Mineralogy records that its surface can become darker and iridescent as it tarnishes.
The rainbow effect
The colorful appearance describes a surface effect, rather than a separate mineral species. Color alone cannot establish a specimen’s locality or whether its surface has been treated. Those details require provenance or examination of the individual piece.
Our collection
This photograph shows our December 2024 material supplied as Rainbow Pyrite. No specimen-specific laboratory result, locality or treatment determination is presented for these photographed pieces.
Care
Keep pyrite specimens dry and avoid soaking. Museum conservators document that humidity can promote oxidation and damage susceptible specimens.
Volcanic Chromium Muscovite · Soul Body Gems, November 2024.
Volcanic Chromium Muscovite, previously catalogued as Mystery Stone 13, is a vivid green collection material whose tested specimen contains chromian muscovite, albite and quartz alongside apparent silicified volcanic material.
Sample 1111 · November 16, 2024.
Locality unknown.
What the testing revealed
The report describes material that appears to be silicified volcanic rock or ash, together with chromian muscovite, albite and quartz. Chromium in the muscovite gives the sphere its vivid green color.
The report discusses mixed felsic and mafic indicators and proposes a possible geological explanation involving sediment and volcanic material. This interpretation remains a hypothesis, rather than a confirmed formation history.
Use this guide alongside the written findings and the original report transcript. It explains the purpose of each analytical figure and preserves the laboratory’s own figure labels. The interpretations apply to the tested specimen; signals alone do not establish the identity of every similar-looking stone.
Electron microscope image: This view shows small-scale regions selected for analysis. Its brightness contrast helps distinguish regions with different compositions; it is not a photograph of their natural colors. Numbered spots connect this view to the analyses listed in the report.
Laboratory figure caption: Fig.2: Backscattered electron images of the areas of the specimen.s analyzed Left: large loose stone, right: stone set in ring.
Elemental spectrum: The peaks record characteristic X-ray signals from elements in the analyzed spot or area. This is an analysis of that location, not automatically of the entire specimen. Any mineral identification or uncertainty named in the laboratory caption is retained below.
Laboratory figure caption: Fig. 3: Energy dispersive spectrum of spot 1 in Fig. 2. (appears to be a silicified volcanic rock)
Elemental spectrum: The peaks record characteristic X-ray signals from elements in the analyzed spot or area. This is an analysis of that location, not automatically of the entire specimen. Any mineral identification or uncertainty named in the laboratory caption is retained below.
Laboratory figure caption: Fig. 4: Energy dispersive spectrum of spot 1 in Fig. 2 (chromian muscovite)
Elemental spectrum: The peaks record characteristic X-ray signals from elements in the analyzed spot or area. This is an analysis of that location, not automatically of the entire specimen. Any mineral identification or uncertainty named in the laboratory caption is retained below.
Laboratory figure caption: Fig. 5: Energy dispersive spectrum of spot 3 in Fig. 2 (albite plus quartz)
Read the complete report as text
Analytical Result Report
Sample id: 1111 (#1, green sphere)
Submitted by: Soul Body Gems
Date completed: 11-16-2024
Operating conditions: An AMRAY 1830 SEM operated at 25 kV acceleration potential, 24 mm working distance, 0 degrees sample tilt, coated with 250 Å carbon, and also using the attached XRF unit operated at 30 kV.
Fig. 1: Photograph of the specimen. Approximately 60 mm maximum dimension.
Fig.2: Backscattered electron images of the areas of the specimen.s analyzed Left: large loose stone, right: stone set in ring.
Fig. 3: Energy dispersive spectrum of spot 1 in Fig. 2. (appears to be a silicified volcanic rock)
Fig. 4: Energy dispersive spectrum of spot 1 in Fig. 2 (chromian muscovite)
Fig. 5: Energy dispersive spectrum of spot 3 in Fig. 2 (albite plus quartz)
Summary of findings: This specimen (Fig. 1) has an interesting background! The bulk is made up of 2 components, one of them (Figs. 2 and 3) appears to be silicified volcanic rock or volcanic ash. There is a small potassium peak which indicates a felsic source, such as rhyolite. However, the presence of chromium is typically indicative of a mafic source such as basalt. The presence of coarser grained chromian muscovite (Figs 2 and 4) shows a lot of chromium and it is the chromium which imparts the vivid green color to the sphere. Such a high aluminum mineral as muscovite does not fit with basalt as an immediate source. More likely, a clayey sediment may have gotten mixed with basaltic has and that eventually produced the chromian muscovite. In addition, a sodic plagioclase with quartz was seen in the sample as well (Figs. 2 and 5), another felsic indicator. Bi-modal volcanism is not uncommon where eruptions switched between rhyolitic and basaltic compositions. This is at least one plausible explanation.
Date: 11-16-2024 Signature
Read the original laboratory report as text
The following text and tables are transcribed from the original laboratory document. Figure captions identify the report images; the laboratory interpretations and limitations are preserved.
Laboratory report 1
Analytical Result Report
Sample id: 1111 (#1, green sphere)
Submitted by: Soul Body Gems
Date completed: 11-16-2024
Operating conditions: An AMRAY 1830 SEM operated at 25 kV acceleration potential, 24 mm working distance, 0 degrees sample tilt, coated with 250 Å carbon, and also using the attached XRF unit operated at 30 kV.
Fig. 1: Photograph of the specimen. Approximately 60 mm maximum dimension.
Fig.2: Backscattered electron images of the areas of the specimen.s analyzed Left: large loose stone, right: stone set in ring.
Fig. 3: Energy dispersive spectrum of spot 1 in Fig. 2. (appears to be a silicified volcanic rock)
Fig. 4: Energy dispersive spectrum of spot 1 in Fig. 2 (chromian muscovite)
Fig. 5: Energy dispersive spectrum of spot 3 in Fig. 2 (albite plus quartz)
Summary of findings: This specimen (Fig. 1) has an interesting background! The bulk is made up of 2 components, one of them (Figs. 2 and 3) appears to be silicified volcanic rock or volcanic ash. There is a small potassium peak which indicates a felsic source, such as rhyolite. However, the presence of chromium is typically indicative of a mafic source such as basalt. The presence of coarser grained chromian muscovite (Figs 2 and 4) shows a lot of chromium and it is the chromium which imparts the vivid green color to the sphere. Such a high aluminum mineral as muscovite does not fit with basalt as an immediate source. More likely, a clayey sediment may have gotten mixed with basaltic has and that eventually produced the chromian muscovite. In addition, a sodic plagioclase with quartz was seen in the sample as well (Figs. 2 and 5), another felsic indicator. Bi-modal volcanism is not uncommon where eruptions switched between rhyolitic and basaltic compositions. This is at least one plausible explanation.
Petrified Wood (Turkey) · Soul Body Gems, November 2024.
Petrified wood preserves the structure of ancient wood through mineralization.
How wood becomes stone
Mineral-rich water can fill the pore spaces of buried wood, a process called permineralization. Minerals can also replace organic material as it breaks down. Silica is common in petrified wood, and these processes can preserve details of the original plant structure.
Our collection
The main photograph shows our Petrified Wood from Turkey, from the November 2024 collection.
Desert Oasis Variscite is an alternate collection name for Variscite (Persia). This page reproduces the same material information and laboratory report.
Persian Variscite Various Polished Shapes · Soul Body Gems, November 2024.
The tested tower is an aluminum phosphate, with variscite the researcher's preferred identification; some pyrite was present.
Report: Sample 1112, completed November 16, 2024. Persia is supplied locality information and was not independently established by the laboratory report.
Use this guide alongside the written findings and the original report transcript. It explains the purpose of each analytical figure and preserves the laboratory’s own figure labels. The interpretations apply to the tested specimen; signals alone do not establish the identity of every similar-looking stone.
Electron microscope image: This view shows small-scale regions selected for analysis. Its brightness contrast helps distinguish regions with different compositions; it is not a photograph of their natural colors. Numbered spots connect this view to the analyses listed in the report.
Laboratory figure caption: Fig.2: Backscattered electron images of the areas of the specimen.s analyzed Left: large loose stone, right: stone set in ring.
Elemental spectrum: The peaks record characteristic X-ray signals from elements in the analyzed spot or area. This is an analysis of that location, not automatically of the entire specimen. Any mineral identification or uncertainty named in the laboratory caption is retained below.
Laboratory figure caption: Fig. 3: Energy dispersive spectrum of spot 1 in Fig. 2. (aluminum phosphate, such as variscite)
Elemental spectrum: The peaks record characteristic X-ray signals from elements in the analyzed spot or area. This is an analysis of that location, not automatically of the entire specimen. Any mineral identification or uncertainty named in the laboratory caption is retained below.
Laboratory figure caption: Fig. 4: Energy dispersive spectrum of spot 2 in Fig. 2 (pyrite)
Read the original laboratory report as text
The following text and tables are transcribed from the original laboratory document. Figure captions identify the report images; the laboratory interpretations and limitations are preserved.
Laboratory report 1
                                               Analytical Result Report

Sample id: 1112 (variscite tower)
Submitted by: Soul Body Gems
Date completed: 11-16-2024
Operating conditions: An AMRAY 1830 SEM operated at 25 kV acceleration potential, 24 mm working distance, 0
degrees sample tilt, coated with 250 Å carbon, and also using the attached XRF unit operated at 30 kV.

       @soulbodygems


Fig. 1: Photograph of the specimen. Approximately 45 mm maximum dimension.


Fig.2: Backscattered electron images of the areas of the specimen.s analyzed Left: large loose stone, right: stone set in
ring.
Fig. 3: Energy dispersive spectrum of spot 1 in Fig. 2. (aluminum phosphate, such as variscite)


             @soulbodygems


Fig. 4: Energy dispersive spectrum of spot 2 in Fig. 2 (pyrite)


Table 1: Trace and minor elemenys in the phosphate, in wt. %.

 Chromium                                              0.08
 Iron                                                    0.25
 Vanadium                                              0.38


Summary of findings: This specimen (Fig. 1) is indeed an aluminum phosphate (Figs. 2 and 3). Variscite is the best
choice as other aluminum phosphates such as wavellite tend to be coarser-grained and often show radiating crystal
aggregates. Some pyrite was noted (Figs. 2 and 4). This is very reminiscent of the variscite/wavellite occurrences in
Arkansas such as near Avant. A deep-sea sediment, dark color and rich in vanadium and sulfides was present there and
these phosphates were colored green to blue from trivalent vanadium derived from the deep-sea sediments. This
material; may have been derived from a very similar environment elsewhere.


Date:  11-16-2024            Signature
Black Bridge Variscite is an alternate collection name for Variscite (Persia). This page reproduces the same material information and laboratory report.
Persian Variscite Various Polished Shapes · Soul Body Gems, November 2024.
The tested tower is an aluminum phosphate, with variscite the researcher's preferred identification; some pyrite was present.
Report: Sample 1112, completed November 16, 2024. Persia is supplied locality information and was not independently established by the laboratory report.
Use this guide alongside the written findings and the original report transcript. It explains the purpose of each analytical figure and preserves the laboratory’s own figure labels. The interpretations apply to the tested specimen; signals alone do not establish the identity of every similar-looking stone.
Electron microscope image: This view shows small-scale regions selected for analysis. Its brightness contrast helps distinguish regions with different compositions; it is not a photograph of their natural colors. Numbered spots connect this view to the analyses listed in the report.
Laboratory figure caption: Fig.2: Backscattered electron images of the areas of the specimen.s analyzed Left: large loose stone, right: stone set in ring.
Elemental spectrum: The peaks record characteristic X-ray signals from elements in the analyzed spot or area. This is an analysis of that location, not automatically of the entire specimen. Any mineral identification or uncertainty named in the laboratory caption is retained below.
Laboratory figure caption: Fig. 3: Energy dispersive spectrum of spot 1 in Fig. 2. (aluminum phosphate, such as variscite)
Elemental spectrum: The peaks record characteristic X-ray signals from elements in the analyzed spot or area. This is an analysis of that location, not automatically of the entire specimen. Any mineral identification or uncertainty named in the laboratory caption is retained below.
Laboratory figure caption: Fig. 4: Energy dispersive spectrum of spot 2 in Fig. 2 (pyrite)
Read the original laboratory report as text
The following text and tables are transcribed from the original laboratory document. Figure captions identify the report images; the laboratory interpretations and limitations are preserved.
Laboratory report 1
                                               Analytical Result Report

Sample id: 1112 (variscite tower)
Submitted by: Soul Body Gems
Date completed: 11-16-2024
Operating conditions: An AMRAY 1830 SEM operated at 25 kV acceleration potential, 24 mm working distance, 0
degrees sample tilt, coated with 250 Å carbon, and also using the attached XRF unit operated at 30 kV.

       @soulbodygems


Fig. 1: Photograph of the specimen. Approximately 45 mm maximum dimension.


Fig.2: Backscattered electron images of the areas of the specimen.s analyzed Left: large loose stone, right: stone set in
ring.
Fig. 3: Energy dispersive spectrum of spot 1 in Fig. 2. (aluminum phosphate, such as variscite)


             @soulbodygems


Fig. 4: Energy dispersive spectrum of spot 2 in Fig. 2 (pyrite)


Table 1: Trace and minor elemenys in the phosphate, in wt. %.

 Chromium                                              0.08
 Iron                                                    0.25
 Vanadium                                              0.38


Summary of findings: This specimen (Fig. 1) is indeed an aluminum phosphate (Figs. 2 and 3). Variscite is the best
choice as other aluminum phosphates such as wavellite tend to be coarser-grained and often show radiating crystal
aggregates. Some pyrite was noted (Figs. 2 and 4). This is very reminiscent of the variscite/wavellite occurrences in
Arkansas such as near Avant. A deep-sea sediment, dark color and rich in vanadium and sulfides was present there and
these phosphates were colored green to blue from trivalent vanadium derived from the deep-sea sediments. This
material; may have been derived from a very similar environment elsewhere.


Date:  11-16-2024            Signature
Chrysocolla Malachite Various Polished Shapes · Soul Body Gems, November 2024.
Blue-green chrysocolla and green malachite occur together in copper-rich material, creating the contrasting patterns seen in polished collection pieces.
Two minerals together
Chrysocolla is a hydrated copper-bearing silicate associated with blue, blue-green and green colors. Malachite is a copper carbonate hydroxide, often deep green and banded. Chrysocolla Malachite is a name for their combination rather than a separate mineral species.
The Congo connection
Both occur in oxidized copper deposits and are documented in the Democratic Republic of the Congo. The Handbook of Mineralogy records chrysocolla associated with malachite and lists Congolese localities including Lubumbashi, Likasi and Kakanda. Malachite is also documented around Lubumbashi and Kolwezi.
Our collection
The November 2024 photograph shows various polished shapes catalogued as Chrysocolla Malachite. This is a general material profile; no specimen-specific laboratory result or exact mine attribution is attached to these photographs.
Handling
The components are relatively soft: the handbook lists chrysocolla around Mohs 2–4 and malachite at 3.5–4. Handle polished pieces gently and protect them from scratching.
Cacholong White Opal · Soul Body Gems, November 2024.
Cacholong White Opal is the trade-name entry corresponding to Opal (White). The original specimen report is reproduced below.
Chemistry fits opal. X-ray diffraction showed an amorphous component together with quartz and some tridymite and cristobalite lines, interpreted as opal progressing toward crystallinity.
Collection background: Kazakhstan. This sourcing information is supplied by Soul Body Gems.
What the testing found
Chemistry fits opal. X-ray diffraction showed an amorphous component together with quartz and some tridymite and cristobalite lines, interpreted as opal progressing toward crystallinity.
These results are the property of Soul Body Gems, Alexander Falster, and the Maine Mineral & Gem Museum. Any mention requires full acknowledgment.
Understanding the report figures
Use this guide alongside the written findings and the original report transcript. It explains the purpose of each analytical figure and preserves the laboratory’s own figure labels. The interpretations apply to the tested specimen; signals alone do not establish the identity of every similar-looking stone.
Electron microscope image: This view shows small-scale regions selected for analysis. Its brightness contrast helps distinguish regions with different compositions; it is not a photograph of their natural colors. Numbered spots connect this view to the analyses listed in the report.
Laboratory figure caption: Fig.2: Backscattered electron image of an area of the specimen.
Elemental spectrum: The peaks record characteristic X-ray signals from elements in the analyzed spot or area. This is an analysis of that location, not automatically of the entire specimen. Any mineral identification or uncertainty named in the laboratory caption is retained below.
Laboratory figure caption: Fig. 3: Energy dispersive spectrum of spot 1 in Fig. 2. (looks right for opal)
Diffraction scan: This scan helps identify crystalline minerals by comparing the measured pattern with reference patterns. The laboratory interpretation explains which minerals the comparison supports.
Laboratory figure caption: Fig. 4: X-ray diffraction scan of the specimen with matching stick patterns for quartz, cristobalite and tridymite.
Read the complete report as text
Analytical Result Report
Sample id: 1151 (#6 opal)
Submitted by: Soul Body Gems
Date completed: 3-26-2025
Operating conditions: An AMRAY 1830 SEM operated at 25 kV acceleration potential, 24 mm working distance, 0 degrees sample tilt, coated with 250 Å carbon, and also using the attached XRF unit operated at 30 kV.
A Bruker D2 Phaser X-ray diffractometer was also used in the study and operated at 30 kV and 10 mA.
Photograph of the specimen. Approximately 2.8 cm maximum dimension,
11
1
1
Fig.2: Backscattered electron image of an area of the specimen.
Fig. 3: Energy dispersive spectrum of spot 1 in Fig. 2. (looks right for opal)
Fig. 4: X-ray diffraction scan of the specimen with matching stick patterns for quartz, cristobalite and tridymite.
Summary of findings: This specimen (Fig. 1) is a pretty one, very clean white. Chemically, it fits opal (Figs. 2 and 3). An X-ray diffraction scan has also been run, and it shows the amorphous hump plus some quartz lines as well. Opal will crystallize fairly rapidly, geologically speaking, it usually goes via a cristobalite and tridymite type and then to quartz. This specimen shows some of the tridymite lines and less intensely, some cristobalite lines. Thus, it is opal that is on its way to become crystalline.
Date: 3-26-2025 Signature
Read the original laboratory report as text
The following text and tables are transcribed from the original laboratory document. Figure captions identify the report images; the laboratory interpretations and limitations are preserved.
Laboratory report 1
Analytical Result Report
Sample id: 1151 (#6 opal)
Submitted by: Soul Body Gems
Date completed: 3-26-2025
Operating conditions: An AMRAY 1830 SEM operated at 25 kV acceleration potential, 24 mm working distance, 0 degrees sample tilt, coated with 250 Å carbon, and also using the attached XRF unit operated at 30 kV.
A Bruker D2 Phaser X-ray diffractometer was also used in the study and operated at 30 kV and 10 mA.
Photograph of the specimen. Approximately 2.8 cm maximum dimension,
11
Fig.2: Backscattered electron image of an area of the specimen.
Fig. 3: Energy dispersive spectrum of spot 1 in Fig. 2. (looks right for opal)
Fig. 4: X-ray diffraction scan of the specimen with matching stick patterns for quartz, cristobalite and tridymite.
Summary of findings: This specimen (Fig. 1) is a pretty one, very clean white. Chemically, it fits opal (Figs. 2 and 3). An X-ray diffraction scan has also been run, and it shows the amorphous hump plus some quartz lines as well. Opal will crystallize fairly rapidly, geologically speaking, it usually goes via a cristobalite and tridymite type and then to quartz. This specimen shows some of the tridymite lines and less intensely, some cristobalite lines. Thus, it is opal that is on its way to become crystalline.
Blue Sieber Agate Pendants · Soul Body Gems, November 2024.
Blue Sieber Agate is a familiar trade name for blue decorative slag associated with the Sieber valley in Germany’s Harz region.
What the name describes
The Grube Samson museum identifies Sieberachat as rapidly cooled blast-furnace slag from the historic Steinrenner ironworks. It is a by-product of metal production rather than natural agate. Its blue color and banding have made it a distinctive decorative and jewelry material.
Our collection
The main photograph shows our Blue Sieber Agate pendants from November 2024. This page explains the trade name; no individual laboratory result is attached to these pendants.
Sapphire associated with Winza in central Tanzania.
Geology and color
GIA’s published study describes ruby and sapphire mined at Winza from primary and eluvial deposits beginning in late 2007. The corundum is associated with amphibolitic rocks of the Usagaran Belt. Sapphires studied from this locality include pink, purple and blue colors, often with pronounced color zoning.
Our collection
The photographs show material catalogued as Winza Sapphire in our November 2024 collection. The name records the supplied locality; photographs alone do not independently establish origin or treatment history. No specimen-specific laboratory report is attached here.
Serpentine (Russia) · Soul Body Gems, November 2024.
Our Russian serpentine collection, shown in the November 2024 main photograph.
What serpentine means
Serpentine is a mineral-group name. Common members include antigorite, lizardite and chrysotile. Serpentinite is a rock composed predominantly of serpentine minerals; the two terms describe different levels of identification.
Source and identification
Russia is the origin supplied for this collection. An exact Russian locality and the serpentine species in the pictured material have not been specified. This general profile does not assign a laboratory identification to the photographed pieces.
Simbersite Carvings from Russia · Soul Body Gems, November 2024.
Russian ornamental material commonly written as Simbircite or Simbirskite, catalogued in our collection as Simbersite.
The material and its name
The Simbircite museum and stone-carving centre in Ulyanovsk describes a calcite-rich decorative material associated with aragonite, pyrite, marl and fossil shell material. The name refers to historic Simbirsk, now Ulyanovsk, in Russia.
Fossils and mineral patterns
The museum distinguishes vein material from material filling ancient ammonite shells. The combination of carbonate minerals, fossil remnants and contrasting inclusions gives the stone its decorative character. This is an ornamental-material name rather than a separate approved mineral species.
Our collection
The November 2024 photograph shows our Simbersite carvings from Russia. An exact locality and specimen-specific laboratory analysis were not supplied for these pictured carvings.
A general introduction to fluorite, illustrated with our November 2024 bangle collection.
What it is
Fluorite is calcium fluoride, CaF2. It has a Mohs hardness of 4 and is known for a wide range of colors. Its mineral properties make gentle handling appropriate for polished jewelry.
Our collection
The photograph shows our Fluorite bangles. The archive label does not specify a locality or an individual laboratory report for these pieces. Our other Fluorite profiles cover particular localities, associated minerals and tested specimens.
Paraiba Blue Apatite Faceted Gems · Soul Body Gems, October 2024.
Blue apatite faceted gems from the October 2024 Soul Body Gems collection. Also indexed as Paraiba Blue Apatite.
Blue apatite
Apatite is a group of phosphate minerals. GIA documents blue apatite, including vivid neon blue examples. This collection is labeled Paraiba Blue Apatite; the name here is retained as supplied for these faceted gems.
Wild Horse Jasper SS Rings · Soul Body Gems, February 2024.
Wild Horse Jasper sterling silver rings from the February 2024 Soul Body Gems collection.
The collection name is retained here as supplied. The white-and-black pendant photograph previously assigned to this guide has been moved to White Buffalo Turquoise.
Spiderweb Obsidian Various Shapes · Soul Body Gems, October 2024.
Spiderweb Obsidian from the October 2024 Soul Body Gems collection, shown in towers, palms, hearts, and various shapes.
Collection forms
The towers are the main collection photograph. Additional photographs show palms, hearts, and various polished shapes sold under the Spiderweb Obsidian collection name.
Spiralite Shells India · Soul Body Gems, September 2024.
Spiralite shells from India in the September 2024 collection.
Collection material
Spiralite is a trade name used for fossilized, quartz-encrusted gastropod shells from India. GIA has documented this material as Spiralite Gemshells. The photograph shows the shells in our September collection.
Persian Turquoise Palms · Soul Body Gems, September 2024.
Persian Turquoise palms from our September 2024 collection. Also indexed as Turquoise (Persia).
Collection photograph
Iran is a historic source of turquoise, with the Neyshabur mine particularly well known. This page brings together our Persian Turquoise collection under both commonly used name orders.
Pyrite in Fluorite Stretch Bracelets · Soul Body Gems, September 2024.
Pyrite in Fluorite stretch bracelets from our September 2024 collection. Also indexed as Fluorite (Pyrite).
Collection photograph
Fluorite is calcium fluoride; pyrite is an iron sulfide with a metallic luster. These minerals can occur together. Our collection is labeled Pyrite in Fluorite, with the bracelet photograph serving as the main reference image under both name orders.
Aquamarine with Biotite Stretch Bracelets · Soul Body Gems, September 2024.
Aquamarine with Biotite stretch bracelets from our September 2024 collection.
Collection material
Aquamarine is a variety of beryl. Biotite inclusions have been documented in aquamarine by GIA. This dedicated profile documents our Aquamarine with Biotite collection and its bracelet form; also searchable as Aquamarine Biotite.
Lapis Lazuli Stretch Bracelet · Soul Body Gems, September 2024.
Lapis Lazuli stretch bracelets from our September 2024 collection.
Collection photograph
Lapis lazuli is a rock composed of several minerals, commonly including lazurite, calcite and pyrite. The first bracelet photograph is the main reference image; the second shows an additional view.
Russian Chalcedony Towers · Soul Body Gems, September 2024.
A green-and-brown tumbled stone supplied from Russia.
Finding: Sample 9144, completed July 16, 2020, is predominantly quartz with minor iron- and chromium-bearing muscovite. The report found no phosphorus or copper and concluded the specimen is not turquoise.
The researcher linked the green/brown differences to iron oxidation state and possibly chromium-bearing mica. That interpretation applies to this one sample.
View the original report
Select a page to enlarge it. 3 pages; findings are summarized in accessible text above.
Use this guide alongside the written findings and the original report transcript. It explains the purpose of each analytical figure and preserves the laboratory’s own figure labels. The interpretations apply to the tested specimen; signals alone do not establish the identity of every similar-looking stone.
Electron microscope image: This view shows small-scale regions selected for analysis. Its brightness contrast helps distinguish regions with different compositions; it is not a photograph of their natural colors. Numbered spots connect this view to the analyses listed in the report.
Laboratory figure caption: Fig. 1: Backscattered electron image (Russian tumble green/brown, brown area)
Elemental spectrum: The peaks record characteristic X-ray signals from elements in the analyzed spot or area. This is an analysis of that location, not automatically of the entire specimen. Any mineral identification or uncertainty named in the laboratory caption is retained below.
Laboratory figure caption: Fig. 2: Energy dispersive spectrum of spot 1 in Fig. 1. (quartz).
Elemental spectrum: The peaks record characteristic X-ray signals from elements in the analyzed spot or area. This is an analysis of that location, not automatically of the entire specimen. Any mineral identification or uncertainty named in the laboratory caption is retained below.
Laboratory figure caption: Fig. 2: Energy dispersive spectrum of spot 2 in Fig. 1. (chromium-bearing muscovite).
Electron microscope image: This view shows small-scale regions selected for analysis. Its brightness contrast helps distinguish regions with different compositions; it is not a photograph of their natural colors. Numbered spots connect this view to the analyses listed in the report.
Laboratory figure caption: Fig. 3: Backscattered electron image (Russian tumble green/brown, green area)
Elemental spectrum: The peaks record characteristic X-ray signals from elements in the analyzed spot or area. This is an analysis of that location, not automatically of the entire specimen. Any mineral identification or uncertainty named in the laboratory caption is retained below.
Laboratory figure caption: Fig. 4: Energy dispersive spectrum of spot 1 in Fig. 4
Read the original laboratory report as text
The following text and tables are transcribed from the original laboratory document. Figure captions identify the report images; the laboratory interpretations and limitations are preserved.
Laboratory report 1
Analytical Result Report
Sample id: 9144 (#1green brown Russian tumble)
Submitted by: K. Bitner
Date submitted: July 13, 2020
Date completed: July 16, 2020
Operating conditions: JEOL JSM-6400 operated at 25 kV acceleration potential, 15 mm working distance, 15 degrees sample tilt, coated with 250 Å carbon. Using the X-ray fluorescence attachment with 35kv potental in conjunction with the EDS system.
Fig. 1: Backscattered electron image (Russian tumble green/brown, brown area)
Fig. 2: Energy dispersive spectrum of spot 1 in Fig. 1. (quartz).
Fig. 2: Energy dispersive spectrum of spot 2 in Fig. 1. (chromium-bearing muscovite).
Fig. 3: Backscattered electron image (Russian tumble green/brown, green area)
Fig. 4: Energy dispersive spectrum of spot 1 in Fig. 4
Summary of findings: Interesting stone! Compositionally, it is made up dominantly of quartz with minor muscovite which is iron bearing as well as chromium bearing. XF trace element analysis yields similar results for the brown and green areas: Fe 9300 ppm in the brown and 9100 ppm in the green areas, Chromium and titanium are both in the 1300 ppm range in both areas. What is not present is phosphorus! Nor is there any cooper and insufficient aluminum present! Thus, it can’t be turquoise! The color difference is likely related to the oxidation state of iron, trivalent results in brown color, divalent in green color, possibly supported by the green chromium muscovite.
Date: July 16 ,2020 Signature
Now indexed in our collection as Russian Chalcedony; formerly Mystery Stone 7 (Russia). The original specimen report remains available above.
Watermelon Tourmaline · Soul Body Gems, August 2024.
Watermelon tourmaline brings pink and green together within the same crystal. The classic pattern has a pink center enclosed by a green rim, especially striking in slices cut across a crystal.
Color within a crystal
The name describes color zoning rather than a separate mineral species. Tourmaline is a mineral group with a broad color range. Changes during crystal growth can produce contrasting zones; the balance and arrangement of pink and green vary from piece to piece.
Our collection
These photographs show our Watermelon Tourmaline and sterling silver rings from August 2024. They document the collection rather than a specimen-specific laboratory analysis.
Orange Kyanite SS Rings · Soul Body Gems, August 2024.
Kyanite is familiar in blue, but natural orange material is also known. These warm orange stones are shown in sterling silver rings from our August 2024 collection.
A less familiar color
GIA documented orange kyanite from Tanzania in its Summer 2009 Gem News International. The report discusses manganese in the material examined. That research provides background on the variety; it does not establish the locality or treatment status of every orange stone.
Collection photographs
The images here are our collection record. A photograph alone cannot establish mineral identity, locality or treatment.
Smoked Ethiopian Opal · Soul Body Gems, August 2024.
Smoked Ethiopian opal is natural opal whose body color has been darkened through treatment. The darker background can make its play-of-color appear more pronounced.
How smoke treatment works
Some Ethiopian opal is hydrophane: its porous structure can absorb liquids and other substances. Smoke treatment introduces carbon-bearing residues into this structure, darkening the body. Stone Group Laboratories reproduced the effect experimentally and detected carbon-related signals in the treated samples.
What the name means
Smoke-treated opal should be described as treated. It remains opal, but its dark body color has been altered. The term does not mean that every Ethiopian opal is treated, and dark appearance alone is insufficient to determine a stone’s treatment history.
Different darkening processes
Smoke treatment and sugar-acid treatment are distinct methods. Both can darken porous opal; sellers should identify the treatment when it is known. Our August 2024 photograph is catalogued as Smoked Ethiopian Opal and serves as the collection image for this profile.
Quartz with Star Rutile Flowers · Soul Body Gems, August 2024.
Star Gold Flower Rutile is our collection name for quartz displaying golden rutile in striking star-like or flower-like arrangements.
Patterns inside quartz
Rutile needles can form intersecting or radiating groups within quartz. GIA has documented star-shaped arrangements and rose-like clusters of rutile inclusions. The visible inclusion pattern is distinct from an optical star that moves across the surface under a light.
Our August 2024 piece
The main photograph shows the Quartz with Star Rutile Flowers from this month’s collection. This trade-style name describes its appearance; it is not a separate mineral species or a specimen-specific laboratory finding.
Sillimanite is an aluminum silicate mineral, shown here by the White Sillimanite photograph from our August 2024 collection.
Mineral background
Its chemical formula is Al2SiO5. It shares that composition with kyanite and andalusite, while having a different crystal structure. Sillimanite commonly occurs in rocks formed under high-grade metamorphic conditions and can grow as prismatic crystals or fibrous aggregates.
Appearance
White and colorless material are among its natural colors; other examples may be gray, brown, yellow, green or blue. The photograph is a collection record, with no specimen-specific laboratory report attached.
Stick Agate from Turkey · Soul Body Gems, July 2024.
Turkish stick agate takes its collection name from the bar-like forms preserved within the stone.
Silica with a distinctive pattern
Agate is a fine-grained silica material. Research on agates from the Çubuk–Ankara region distinguishes nodular material from block-shaped agates containing bar-like pseudomorphic inclusions. A pseudomorph preserves an earlier crystal’s form as its material changes.
Our July collection
The photograph records our Stick Agate from Turkey. The name describes its appearance and recorded provenance; the original mineral behind each individual stick is not established by this photograph.
Spanish Green Aragonite · Soul Body Gems, July 2024.
Spanish Green Aragonite from our July 2024 collection.
A calcium carbonate mineral
Aragonite has the composition CaCO₃, shared with calcite but arranged in a different crystal structure. It can form slender crystals, radiating aggregates, banded masses and stalactitic shapes. Its name recalls Aragón in Spain.
Color and collection record
Green is among the colors recorded for aragonite. Our photograph is catalogued as Spanish Green Aragonite; it does not establish the cause of its color or a specific mine.
Nigerian phenakite, with the published account of the 2009 gem-quality find.
The paper on this find
Brendan M. Laurs reported “Phenakite from Nigeria” in the Winter 2009 issue of Gems & Gemology, pages 301–302. The account describes colorless crystals reportedly found in August 2009 in the Jos region of central Nigeria, noted for transparency, luster and complex surface etching.
Mineral and gemstone
Phenakite is beryllium silicate, Be₂SiO₄. Some material described in the report was kept as crystals and some was faceted. The paper is background on Nigerian production, rather than a laboratory report on our photographed piece.
Quantum Quattro (Africa) · Soul Body Gems, July 2024.
Our African collection material sold under the trade name Quantum Quattro.
A trade name needs context
Quantum Quattro is a market name, not a mineral species. It is used for visually mixed blue-green material, so the name alone does not establish a fixed recipe of minerals. Our July record identifies these pieces as African material; no more specific mine locality is supplied here.
Compare our separate reports
This collection profile stays separate from our tested Peruvian material. A test on a different specimen cannot establish the composition of these pieces. See Quantum Quattro (Incorrect) and Quantum Quattro (Peru) for the distinct specimen records.
Blueberry is a trade-style name rather than a separate mineral species. Fluorite is calcium fluoride, CaF₂, and naturally occurs in blue, purple and many other colors. It can form cubes and octahedra as well as rounded or botryoidal aggregates.
Enjoying the detail
The collection photograph documents the material sold under this name. Its trade name alone does not specify a mine, treatment or chemical cause of color. Fluorite has Mohs hardness 4 and perfect cleavage, so protect it from knocks and abrasion.
Malachite Stalactites · Soul Body Gems, July 2024.
Malachite stalactites from the Congo, photographed in our July collection.
Growth in layers
Malachite is a green copper carbonate hydroxide mineral. It commonly grows in stalactitic and rounded botryoidal forms with a fibrous internal structure. Sections through layered growth can reveal concentric green bands.
Congo material
The Congo is an important documented source of malachite. Our photograph is recorded as Congo material, without assigning an unrecorded mine. The stalactitic form describes the mineral’s growth habit; cutting and polishing can expose its internal patterns.
Irnimite Jasper from Russia, with contrasting blue and earth-toned patterning.
A named jasper variety
The Moscow Gemological Center describes irnimite as a banded and spotted jasper variety named for a deposit in the Ir and Nimi river basins of Russia’s Khabarovsk Territory. Its account relates the blue areas to rhodusite-bearing material.
Our collection
Our July photograph is catalogued as Russian Irnimite Jasper. The published description explains the variety; it does not measure the mineral proportions within our particular piece.
Ethiopian opal in cabochons and gems from our July 2024 collection.
Play-of-color and hydrophane material
Ethiopia produces opal in a range of body colors and patterns. GIA’s study of the Wegel Tena deposit in Wollo documents predominantly white material as well as brown, fire and crystal opal. Some is hydrophane: its porous structure absorbs water, which can temporarily change its transparency and appearance.
Natural material and treatments
Ethiopian origin does not automatically mean treated opal. Treatments such as dyeing and smoke darkening are separate disclosures. See our Smoked Ethiopian Opal and Ethiopian Water Opal profiles. These collection photos do not establish treatment status by themselves.
Two names, one guide
Ethiopian Opal and Opal (Ethiopia) both lead to this material guide.
Volcanic Agate Skulls · Soul Body Gems, July 2024.
Indonesian Volcanic Agate shown in skull carvings from July 2024.
A collection name and a geological setting
Agate is a silica material built largely from very fine quartz. Agate deposits are often associated with cavities and fractures in volcanic rocks, where silica-bearing fluids deposit layers over time. Volcanic Agate is our collection name for this Indonesian material, rather than a separate mineral species.
Pattern through carving
A skull carving cuts across the stone’s internal pattern, revealing different sections on the forehead, cheeks and jaw. Our photographs record the carvings and their supplied Indonesian provenance. They do not establish an exact formation age, mine or fluorescence response.
Treated-color pink topaz in sterling silver rings from our July collection.
The pink color in these pieces
Our collection records identify these pink topaz pieces as having an enhanced color. Coating is one commercial method: a thin deposited film changes the color seen through the cut gemstone. The underlying topaz and the added surface color should be described separately.
The American coating company
Azotic lists Pure Pink™ among its gemstone coatings. Its published US patents, including US7526928B1, describe thin-film coating technology for altering gemstone appearance. This is a documented example of the process, not confirmation that Azotic treated these particular rings.
Naturally pink topaz also exists
GIA documents natural pink topaz as well as treated colors. Pink appearance alone cannot distinguish them. The treatment disclosure here concerns our catalogued collection pieces, rather than every pink topaz.
Crystal skulls as contemporary stone carvings, with history and symbolism in context.
Stone shaped into a human form
Crystal skull is a carving description, not a mineral name. Quartz and many other stones can be shaped into skulls. The sculptor’s proportions, polishing and use of natural color or pattern give each carving its character.
History and the famous crystal skulls
Some famous quartz skulls were once attributed to ancient Mesoamerica. Smithsonian researchers examined their museum’s skull with scanning electron microscopy and found evidence of modern stone-carving tools. An ancient-looking shape or a dramatic story does not establish archaeological provenance.
Meaning today
For some modern collectors, skulls symbolize mortality, remembrance or transformation; some contemporary spiritual practices associate them with meditation. These are interpretations and beliefs, rather than scientific properties of the stone. Our July pieces are presented as collection carvings.
Two directory names
Skull Carvings and Crystal Skulls open this same guide.
Malipo Emerald from China · Soul Body Gems, July 2024.
Emerald from Malipo County, Yunnan, China, with the GIA research on this deposit.
A Chinese emerald source
Emeralds were discovered near Dayakou in Malipo County in the late 1980s, associated with tungsten deposits. The material has supplied mineral specimens, carvings and some cut gemstones.
What makes the color distinctive
Yang Hu and Ren Lu’s 2019 study found abundant vanadium to be the main coloring element in the samples they examined, alongside relatively low chromium. The authors describe yellowish green color and distinctive inclusion features. Those measurements apply to their studied samples.
The surrounding minerals
The paper illustrates emerald in quartz, feldspar and dark mica matrix, and identifies associated microcline, scheelite, phlogopite and pyrrhotite among other minerals. Our July photograph is the collection image for this locality. The study is linked below for the full geology and analytical results.
Amazonite Smoky Quartz Spheres · Soul Body Gems, July 2024.
Amazonite with smoky quartz, shown in polished spheres.
Two minerals together
Amazonite is the blue-green variety of microcline feldspar; smoky quartz is a brown to gray variety of quartz. Their contrasting colors can remain visible when the associated rock is polished into a sphere. Microcline commonly occurs in granitic rocks and pegmatites and is associated with quartz.
Localities and our collection
Our collection notes list Madagascar, Pakistan and Brazil as sources for material sold in this combination. That list does not assign all three origins to the photographed spheres. A specific piece’s provenance follows its individual collection record.
Star Rose Quartz SS Pendants · Soul Body Gems, July 2024.
Rose quartz with asterism, shown in sterling silver pendants.
Why a star appears
Asterism is a star-shaped optical effect created when light interacts with well-oriented inclusions. Cutting and polishing the stone as a rounded cabochon can reveal the effect. A small, direct light usually shows it more clearly than broad diffuse illumination.
Color and light
The apparent position and visibility of a star change as the stone or light moves. The effect is distinct from fixed star-shaped inclusions such as the visible rutile flowers in some quartz. Star Rose Quartz and Rose Quartz (Stars) both open this profile.
Opal from Andamooka, South Australia, and the treatment used on some matrix material.
An Australian opal field
South Australia’s mining department records opal discovery at Andamooka in 1930. The district produces precious opal, including material dispersed through a host rock known as matrix opal.
Sugar and acid treatment
Porous matrix material may be impregnated with sugar and then treated with acid to deposit dark carbon. The darker background increases contrast with the opal’s play-of-color. GIA also documents a sugar/heat variation. These are treatments and should be disclosed; Andamooka origin alone does not mean every piece is treated.
Our July photograph
This is our collection image for Andamooka Opal. Its appearance alone does not identify the exact treatment history of the photographed material.
Scolecite, a zeolite mineral known for fine crystals and radiating growth.
A hydrated silicate
Scolecite is a calcium aluminum silicate containing water in its structure, with formula CaAl₂Si₃O₁₀·3H₂O. It commonly forms slender crystals, fibrous masses and radiating sprays, often in cavities within basalt.
Collection and related material
Our July photograph serves as this general mineral profile’s main image. It is separate from the Pink Scolecite material record. A trade color name on another specimen does not establish the composition of every scolecite-labelled item.
Guatemalan Jade Dragons · Soul Body Gems, July 2024.
Dragon carvings in jade and other stones, with a focus on Chinese cultural history.
Dragons in Chinese art
Chinese dragons have carried several meanings across time, rather than one universal interpretation. The Metropolitan Museum of Art describes associations with water, rivers and lakes, protection, happiness and fertility. Dragons also became powerful signs of imperial authority, including five-clawed designs made for court use.
From motif to stone carving
A carved dragon may emphasize a flowing body, curling claws, scales or clouds. The stone’s own color zones and texture become part of the design. Our collection includes Guatemalan jade and labradorite dragon carvings; the Chinese history of the motif does not imply that their raw material came from China or that the carvings are ancient.
Material and meaning
Dragon Carvings is a guide to a sculptural subject, separate from mineral identity. See Guatemalan Jade, also listed as Jade (Guatemala), for the material’s background. Modern collectors may choose dragons for personal ideas of strength or protection; these are symbolic associations.
Naica Selenite with Enhydros · Soul Body Gems, June 2024.
Selenite from Naica, Mexico, with fluid inclusions in our June 2024 collection.
Gypsum from a remarkable locality
Selenite is the clear crystalline variety of gypsum, a hydrated calcium sulfate. Naica in Chihuahua, Mexico, is famous for caves containing exceptionally large gypsum crystals. Research on those crystals describes growth from warm, low-salinity water under unusually steady conditions.
Water preserved inside
Fluid inclusions are small pockets of fluid enclosed within a mineral. Our collection labels these specimens Naica Selenite with Enhydros. Researchers have studied fluid inclusions in Naica gypsum to reconstruct its growth conditions. Those studies provide geological context; a still photograph does not show whether an individual bubble moves.
Russian Seraphinite slabs, displaying green color and feathery, silvery patterning.
The mineral behind the name
Seraphinite is the ornamental name used for feathery-looking clinochlore. Clinochlore is a layered silicate in the chlorite group. The Handbook of Mineralogy describes fibrous and foliated forms, a pearly luster and perfect cleavage.
Our Russian collection
These slabs are catalogued as Russian Seraphinite. Their polished faces make the radiating pale areas easy to compare. This guide is separate from Seraphinite (NOT), the report on a different material sold under that name.
Care
Clinochlore is relatively soft. Protect polished pieces from abrasion and sharp impacts.
Indicolite Tourmaline · Soul Body Gems, June 2024.
Raw blue tourmaline from the Shabrovskoye deposit in the Middle Urals, Russia.
Blue within the tourmaline family
Indicolite is a color name for blue to violetish-blue or greenish-blue tourmaline. It is not a separate mineral species. Tourmaline is a chemically varied mineral group, and its color alone does not determine a particular species.
Collection locality
Our sourcing record identifies the Indicolite mine at the Shabrovskoye deposit, Yekaterinburg, Sverdlovsk region, Middle Urals, Russia. These two June photographs document the raw collection material from that source. See also our general Indicolite Tourmaline guide.
Symbolism
In contemporary crystal traditions, indicolite is associated with communication, empathy and open-mindedness, often linked with the throat chakra. These are spiritual associations, rather than established medical effects.
Swiss Blue Topaz SS Pendants · Soul Body Gems, June 2024.
Swiss Blue Topaz in sterling silver pendants from June 2024.
A color name, rather than an origin
Swiss Blue is a trade name for a bright blue shade of topaz. It does not mean the stone was mined in Switzerland.
How the blue is produced
Strong blue topaz in the jewelry market is generally produced by irradiation, often followed by heat treatment of initially pale or colorless topaz. GIA documents how these treatments make a range of blue hues available. The Swiss Blue name describes the resulting color range, rather than a separate mineral species.
Our pendants
The main photograph shows our June sterling silver pendants, with the second photograph retained below. A collection image records their appearance; it does not identify the individual treatment facility.
Gel Silica SS Pendants · Soul Body Gems, June 2024.
Gel Silica from Indonesia, shown in sterling silver pendants.
Our collection record
Gel Silica is the supplied collection name for this Indonesian material. The June photograph shows polished, patterned stones set in sterling silver.
Understanding the name
The collection name and supplied origin are recorded here without assigning a fixed mineral composition or a specific mine. A mineral analysis of these pieces has not been added to this profile.
Ukrainian Phenakite from our June 2024 collection.
A beryllium silicate
Phenakite is a beryllium silicate with the formula Be₂SiO₄. GIA records phenakite among the minerals produced by the Volyn pegmatite field in northwestern Ukraine, a region also known for topaz, beryl and fluorite.
Provenance and the photograph
Our collection notes identify these crystals as Ukrainian Phenakite. The regional publication gives background on Ukrainian production; it does not establish the exact pocket or mine of the photographed pieces. This locality guide stays separate from our Nigerian and Brazilian Phenakite records.
Tentadora Chrysocolla · Soul Body Gems, June 2024.
Chrysocolla specimens from the Tentadora Mine, Huancavelica, Peru.
A distinctive Peruvian locality
Tentadora specimens are known in mineral collections for blue-green chrysocolla associated with quartz. The Dynamic Earth Collection documents this combination from the mine. Our collection includes nodular and layered surfaces, with a close view as the main photograph and the wider group retained below.
Our collection notes
Our sourcing notes describe material that can contain quartz, chrysocolla, gem silica, calcite, copper and iron-bearing minerals such as goethite and limonite. They also describe successive generations of chrysocolla growth. These are collection observations; they are not a laboratory inventory of every pictured specimen.
Meaning for collectors
In modern crystal traditions, chrysocolla is associated with communication, inner calm and connection with nature. Some collectors link it with the throat chakra. These meanings belong to spiritual practice, rather than demonstrated treatment of physical ailments.
Swallowtail Selenite aka Golden Selenite · Soul Body Gems, June 2024.
Golden Selenite, also called Swallowtail Selenite, from Salinas de Otuma in Paracas, Pisco Province, Ica, Peru.
Golden color and a distinctive twin
These translucent gypsum crystals combine warm honey and orange-gold tones with bright faces and well-defined edges. Gypsum is hydrated calcium sulfate, CaSO₄·2H₂O. The swallowtail or fishtail name describes a twinned growth pattern in which joined crystals form a branching, often V-shaped outline.
From the salt fields of Peru
Salinas de Otuma is also recorded as Las Salinas or Salinas de Paracas. Golden gypsum from this locality occurs with halite in a salt-rich setting. The name Golden Selenite emphasizes the color, while Swallowtail Selenite emphasizes the crystal form; both names lead to this shared material guide.
Light, luster and fluorescence
Light passing through the crystals brings out their golden translucency. Gypsum can show a glasslike to pearly luster; fibrous gypsum, often sold as satin spar, has a silkier appearance. The Fluorescent Mineral Society documents golden twinned selenite from this Peruvian locality that glows under longwave ultraviolet light and retains a brief afterglow. The strength and color of the response can vary between specimens.
Symbolism and personal meaning
In contemporary crystal traditions, selenite is associated with releasing attachments and marking a fresh beginning. Golden and orange varieties are sometimes connected with balancing opposing feelings, exploring identity, and reflecting on emotions, sexuality and creativity. These are spiritual interpretations and personal practices, rather than scientifically established effects of the mineral.
Care
Gypsum is soft and cleaves easily, so handle the crystal edges gently and protect them from abrasion.
Pyrite in Golden Healer · Soul Body Gems, May 2024.
Background
Metallic sparkle meets the warm yellow and honey tones associated with Golden Healer quartz. Our May 2024 collection shows the two textures together in a decorative specimen.
Science / Origin / Testing
Quartz is silicon dioxide; pyrite is iron sulfide, FeS₂. Golden Healer is a trade name commonly applied to quartz with yellow to brown iron-bearing coloration, rather than a separate mineral species. The collection name describes this piece; identifying each inclusion and color-bearing phase requires examination of the specimen. A test of a different pyrite or quartz sample does not establish the composition of this one.
Metaphysical Meaning
In contemporary crystal practice, pyrite is associated with confidence and purposeful action, while Golden Healer quartz symbolizes warmth, renewal, and personal growth. Together they can serve as a focus for setting intentions and directing energy toward meaningful goals. These are spiritual interpretations, rather than measured mineral properties.
Carnelian is loved for its orange, red, and reddish-brown colors and its soft, glowing translucency. The May 2024 photograph features carnelian set in sterling silver rings.
Science / Origin / Testing
Carnelian belongs to the chalcedony family: very fine-grained silica related to quartz. It is a traditional ornamental gem used in cabochons, beads, and carvings. Treatments can change the appearance of chalcedony, so a natural-looking color alone is not proof of an untreated stone. This guide is dedicated to carnelian and is separate from our Papaya Quartz page.
Metaphysical Meaning
Carnelian meaning in modern crystal traditions centers on courage, creativity, motivation, and the energy to begin. Its warm color makes it a popular symbol of vitality and self-expression, often associated with sacral-chakra practice. These associations describe personal and spiritual uses, not laboratory findings.
Deerfawn Jasper SS Adjustable Rings · Soul Body Gems, May 2024.
Background
Deerfawn Jasper is the collection name for this patterned ornamental material from India. Our May 2024 photograph shows it in adjustable sterling silver rings, where each stone brings its own arrangement of colors and markings.
Science / Origin / Testing
Deerfawn Jasper is a trade name, rather than a formally defined mineral species. India is the origin recorded for these pieces; a specific mine and a laboratory determination have not been established here. Jasper generally refers to opaque, fine-grained silica, but a trade label should not substitute for analysis of an individual material.
Metaphysical Meaning
For a personal metaphysical meaning, its natural patterns can represent steadiness, patience, and a connection to the landscape. It can be used as a reminder to slow down and notice small details. These are symbolic ways of working with a stone, not claims about scientifically demonstrated energy.
Lemurian quartz is a modern crystal-trade name associated with quartz points bearing noticeable horizontal surface markings. Our May 2024 collection photograph records an old-stock group offered under that name.
Science / Origin / Testing
The mineral is quartz, SiO₂. Quartz crystals can develop natural striations on their prism faces as they grow; such markings do not establish an ancient civilization or prove a special geological age. Lemurian is not a separate mineral species, and old stock describes the collection history rather than a laboratory date. No specific mine is assigned to this group in our records.
Metaphysical Meaning
In contemporary metaphysical traditions, Lemurian quartz symbolizes remembrance, intuition, and connection. Stories of stored wisdom belong to spiritual belief. Some people use the ridged surfaces as a tactile focus during quiet reflection or meditation.
Rainforest Jasper Spheres from Australia · Soul Body Gems, May 2024.
Background
Australian Rainforest Jasper is admired for an earthy mix of green, brown, and cream patterns. Our May 2024 collection features polished spheres that reveal the material from every direction.
Science / Origin / Testing
Rainforest Jasper is a commercial name used for patterned rhyolitic material, rather than a distinct mineral species. Rhyolite is a volcanic rock, while jasper is a silica material, so these terms describe different geological categories. The collection record supplies Australia as the origin; it does not establish the mine or the exact phases present in every sphere. This page is separate from our Rainforest Jasper (India) entry.
Metaphysical Meaning
Its landscape-like patterns invite associations with nature, grounding, and appreciation of life’s variety. In metaphysical practice, it may be used as a focus for balance, patience, and reconnecting with the outdoors. These meanings are symbolic and personal.
Pink Tourmaline in Albite Bowl Carvings · Soul Body Gems, May 2024.
Background
Pink tourmaline and pale albite create a vivid contrast of color and texture. The carved bowls in our May 2024 collection turn this mineral association into functional sculptural forms.
Science / Origin / Testing
Tourmaline is a group of boron-bearing silicate minerals; albite is a sodium-rich feldspar. Both occur in granitic pegmatites, where evolving melts and fluids can produce striking mineral associations. Pink color alone does not determine the tourmaline species. The collection label identifies the material shown; no mine or specimen-specific analytical result is assigned here.
Metaphysical Meaning
Pink tourmaline is commonly associated with compassion, emotional openness, and kindness. Paired with the pale matrix, it can symbolize holding tenderness within a steady foundation. A carved bowl may serve as a place for meaningful keepsakes or intention-setting, with these meanings understood as spiritual symbolism.
Peanut Obsidian Towers · Soul Body Gems, May 2024.
Background
Peanut Obsidian from Mexico is recognized by rounded reddish-orange patterns against a darker background. Our May 2024 collection shows this distinctive material carved into polished towers.
Science / Origin / Testing
A 1968 Journal of Gemmology study of material from near Álamos, Sonora, described it as spherulitic perlite: hydrated volcanic glass containing radiating feldspar aggregates stained by hematite. The study also reported silica phases between the feldspar fibers. The familiar name refers to this spotted appearance, not literal peanuts or a separate mineral species. This guide covers the classic material and is separate from our dark Mexican obsidian entry; the published analysis is geological context, not a test of these particular towers.
Metaphysical Meaning
In metaphysical practice, obsidian often symbolizes grounding, protection, and honest self-reflection. The contrasting patterns of Peanut Obsidian can represent staying rooted while making room for fresh ideas. It may be used as a reminder to communicate confidently and let go of resentment, fear, or anger through reflective practice.
Fairy Matrix Opal from Queensland, Australia · Soul Body Gems, May 2024.
Background
Fairy Matrix Opal is a trade name that evokes small flashes of opal color scattered through a surrounding rock. The May 2024 collection labels this piece as coming from Queensland, Australia.
Science / Origin / Testing
In matrix opal, precious opal occurs within the host material rather than forming only a free-standing gem. Queensland opal fields produce opal associated with ironstone, including material collected as matrix fragments. Fairy Matrix is not a mineral species or a guarantee of a particular mine, composition, or treatment. The treatment history of this piece is not established here; processes described for Andamooka material should not automatically be assigned to a Queensland specimen.
Metaphysical Meaning
The tiny flashes of color can symbolize wonder, imagination, and finding possibility in ordinary moments. In contemporary crystal practice, opal is often associated with creativity and emotional expression. These metaphysical meanings offer a personal focus rather than a scientific explanation of the stone’s energy.
Obsidian Dark Rhyolite (Mexico) · Soul Body Gems, May 2024.
Two specimens from a special, limited Mexican pocket find, examined to understand their volcanic composition and contrasting textures.
Locality: Mexico. Soul Body Gems obtained a limited amount of this find; the shared-pocket history comes from our sourcing records.
Specimen 1 — quartz-filled cavities in rhyolitic material
Sample: 10512 (recent package #4) · Completed: March 20, 2024.
Finding: Quartz-filled rounded cavities in surrounding material of rhyolitic composition, possibly still partly glassy obsidian.
The researcher interprets the rounded cavities as likely filled lithophysae, described in the report as essentially gas bubbles. Trace and alkali elements fit a rhyolite/obsidian composition.
These results are the property of Soul Body Gems, Alexander Falster, and the Maine Mineral & Gem Museum. Any mention requires full acknowledgment.
Understanding the report figures
Use this guide alongside the written findings and the original report transcript. It explains the purpose of each analytical figure and preserves the laboratory’s own figure labels. The interpretations apply to the tested specimen; signals alone do not establish the identity of every similar-looking stone.
Electron microscope image: This view shows small-scale regions selected for analysis. Its brightness contrast helps distinguish regions with different compositions; it is not a photograph of their natural colors. Numbered spots connect this view to the analyses listed in the report.
Laboratory figure caption: Fig.2: Backscattered electron image of an area of the specimen.
Elemental spectrum: The peaks record characteristic X-ray signals from elements in the analyzed spot or area. This is an analysis of that location, not automatically of the entire specimen. Any mineral identification or uncertainty named in the laboratory caption is retained below.
Laboratory figure caption: Fig. 3: Energy dispersive spectrum of spot 1 in Fig. 2 (quartz)
Elemental spectrum: The peaks record characteristic X-ray signals from elements in the analyzed spot or area. This is an analysis of that location, not automatically of the entire specimen. Any mineral identification or uncertainty named in the laboratory caption is retained below.
Laboratory figure caption: Fig. 4: Energy dispersive spectrum of spot 2 in Fig. 2 (rhyolite composition)
Electron microscope image: This view shows small-scale regions selected for analysis. Its brightness contrast helps distinguish regions with different compositions; it is not a photograph of their natural colors. Numbered spots connect this view to the analyses listed in the report.
Laboratory figure caption: Fig.5: Backscattered electron image of another area of the specimen.
Elemental spectrum: The peaks record characteristic X-ray signals from elements in the analyzed spot or area. This is an analysis of that location, not automatically of the entire specimen. Any mineral identification or uncertainty named in the laboratory caption is retained below.
Laboratory figure caption: Fig. 6: Energy dispersive spectrum of spot 1 in Fig. 5 (quartz)
Elemental spectrum: The peaks record characteristic X-ray signals from elements in the analyzed spot or area. This is an analysis of that location, not automatically of the entire specimen. Any mineral identification or uncertainty named in the laboratory caption is retained below.
Laboratory figure caption: Fig. 7: Energy dispersive spectrum of spot 2 in Fig. 5 (rhyolite composition)
Element map: This map shows where the named elements occur within the analyzed area. Its colors represent the laboratory’s selected element channels, rather than the specimen’s visible colors. The caption below preserves any color key or distribution noted by the laboratory.
Laboratory figure caption: Fig. 8: X-ray maps of the area shown in Fig. 5. Silicon: yellow, potassium: red, aluminum: purple.
Elemental spectrum: The peaks record characteristic X-ray signals from elements in the analyzed spot or area. This is an analysis of that location, not automatically of the entire specimen. Any mineral identification or uncertainty named in the laboratory caption is retained below.
Laboratory figure caption: Fig. 3: Energy dispersive spectrum of spot 1 in Fig. 2 (rhyolite composition)
Electron microscope image: This view shows small-scale regions selected for analysis. Its brightness contrast helps distinguish regions with different compositions; it is not a photograph of their natural colors. Numbered spots connect this view to the analyses listed in the report.
Laboratory figure caption: Fig. 5: Backscattered electron image of another area of the specimen.
Elemental spectrum: The peaks record characteristic X-ray signals from elements in the analyzed spot or area. This is an analysis of that location, not automatically of the entire specimen. Any mineral identification or uncertainty named in the laboratory caption is retained below.
Laboratory figure caption: Fig. 6: Energy dispersive spectrum of spot 1 in Fig. 5 (kaolinite)
Read sample 10512 findings and table as text
Sample 10512 (recent package #4), submitted by Soul Body Gems, completed March 20, 2024. An AMRAY 1830 SEM operated at 25 kV acceleration potential, 24 mm working distance, and 0 degrees sample tilt. The specimen was coated with 250 Å carbon; the attached XRF unit operated at 30 kV. A BRUKER Titan X-ray fluorescence spectrometer also operated for 30 seconds at 50, 25, and 10 kV.
Figure 1: Photograph, approximately 55 mm maximum dimension.
Table 1: Minor and trace elements in potassium feldspar, in wt.%
Element
Wt.%
Barium
0.05
Iron
0.33
Manganese
0.01
Sodium
2.54
Potassium
4.11
Summary: Rounded areas, likely filled lithophysae, are filled with quartz. Surrounding material has rhyolitic composition and may still be partly glassy, hence obsidian. Trace and alkali elements fit rhyolite/obsidian. Aluminum compounds trapped in the mapped area suggest polishing with corundum. The report ends with the March 20, 2024 date and signature.
Specimen 2 — rhyolitic composition with kaolinite alteration
Sample: 10513 (recent package #5) · Completed: March 20, 2024.
Finding: Rhyolitic composition, with some areas altered to kaolinite.
The second piece resembles the first compositionally but is described as wholly converted to rhyolitic material. It is very fine-grained and more homogeneous under the microscope than its visible surface pattern suggests.
These results are the property of Soul Body Gems, Alexander Falster, and the Maine Mineral & Gem Museum. Any mention requires full acknowledgment.
Read sample 10513 findings and table as text
Sample 10513 (recent package #5), submitted by Soul Body Gems, completed March 20, 2024. An AMRAY 1830 SEM operated at 25 kV acceleration potential, 24 mm working distance, and 0 degrees sample tilt. The specimen was coated with 250 Å carbon; the attached XRF unit operated at 30 kV. A BRUKER Titan X-ray fluorescence spectrometer operated for 30 seconds at 50, 25, and 10 kV.
Figure 1: Photograph, approximately 55 mm maximum dimension.
Figure 2: Backscattered electron image.
Figures 3 and 4: Rhyolitic-composition spectra.
Figure 5: Backscattered image of another area.
Figure 6: Kaolinite spectrum.
Table 1: Minor and trace elements in potassium feldspar, in wt.%
Element
Wt.%
Barium
0.07
Iron
0.55
Manganese
0.01
Sodium
3.04
Potassium
2.65
Summary: Similar in composition to package sample #4, but described as wholly converted into rhyolitic composition, with local kaolinite alteration. The material is homogeneous and very fine-grained; irregularities visible to the eye are less obvious in backscattered images. The report’s comparative sentence about iron and potassium contains a sample-number inconsistency; the measurements above reproduce its table unchanged. The report ends with the March 20, 2024 date and signature.
Read the original laboratory report as text
The following text and tables are transcribed from the original laboratory document. Figure captions identify the report images; the laboratory interpretations and limitations are preserved.
Laboratory report 1
Analytical Result Report
Sample id: 10512 (recent package #4)
Submitted by: Soul Body Gems
Date completed: 3-20-2024
Operating conditions: An AMRAY 1830 SEM operated at 25 kV acceleration potential, 24 mm working distance, 0 degrees sample tilt, coated with 250 Å carbon, and also using the attached XRF unit operated at 30 kV.
A BRUKER Titan X-ray fluorescence spectrometer was also used and operated for 30 seconds at 50, 25, and 10 kV.
Fig. 1: Photograph of the specimen. Approximately 55 mm maximum dimension.
Fig.2: Backscattered electron image of an area of the specimen.
Fig. 3: Energy dispersive spectrum of spot 1 in Fig. 2 (quartz)
Fig. 4: Energy dispersive spectrum of spot 2 in Fig. 2 (rhyolite composition)
Fig.5: Backscattered electron image of another area of the specimen.
Fig. 6: Energy dispersive spectrum of spot 1 in Fig. 5 (quartz)
Fig. 7: Energy dispersive spectrum of spot 2 in Fig. 5 (rhyolite composition)
Fig. 8: X-ray maps of the area shown in Fig. 5. Silicon: yellow, potassium: red, aluminum: purple.
Table 1: minor and trace elements in the potassium feldspar. (in wt. %)
Laboratory data as recorded in the report
Element
Reported value
Barium
0.05
Iron
0.33
Manganese
0.01
Sodium
2.54
Potassium
4.11
Summary of findings: This specimen (Fig. 1) very interesting. The spherical parts (likely filled lithophysae, essentially gas bubbles) are filled with quartz (Figs. 2,3, 5, and 7 and 8) whereas the surrounding area has a rhyolitic composition (Figs, 2,4,5,7,and 8) or it may even be partially still glassy and thus be an obsidian. Trace and alkali elements fit the overall composition of a rhyolite/obsidian. Incidentally, it appears that the specimen was polished with corundum as the aluminum X-ray maps shows trapped aluminum compounds in Fig.8.
Date: March 20, 2024 Signature
Laboratory report 2
Analytical Result Report
Sample id: 10513 (recent package #5)
Submitted by: Soul Body Gems
Date completed: 3-20-2024
Operating conditions: An AMRAY 1830 SEM operated at 25 kV acceleration potential, 24 mm working distance, 0 degrees sample tilt, coated with 250 Å carbon, and also using the attached XRF unit operated at 30 kV.
A BRUKER Titan X-ray fluorescence spectrometer was also used and operated for 30 seconds at 50, 25, and 10 kV.
Fig. 1: Photograph of the specimen. Approximately 55 mm maximum dimension.
Fig.2: Backscattered electron image of an area of the specimen.
Fig. 3: Energy dispersive spectrum of spot 1 in Fig. 2 (rhyolite composition)
Fig. 4: Energy dispersive spectrum of spot 2 in Fig. 2 (rhyolite composition)
Fig. 5: Backscattered electron image of another area of the specimen.
Fig. 6: Energy dispersive spectrum of spot 1 in Fig. 5 (kaolinite)
Table 1: minor and trace elements in the potassium feldspar. (in wt. %)
Laboratory data as recorded in the report
Element
Reported value
Barium
0.07
Iron
0.55
Manganese
0.01
Sodium
3.04
Potassium
2.65
Summary of findings: This specimen (Fig. 1) very attractive! There is a similarity in composition to sample 4 but it appears to wholly converted into rhyolitic composition (Figs 2-4) with a few areas where alteration to kaolinite has occurred (Figs. 5 and 6). The compositional data also fit a rhyolitic composition but this sample has a little more iron and potassium than sample 5. They are still very similar and may present individual events spaced spatially very closely. An X-ray map of this sample is much more homogeneous and very fine-grained, the irregularities that are visible with the nakked eye are far lless obvious in backscattered electron images, suggesting homogeneity.
Nundoorite, also sold as Nunderite and described in geological literature as nundorite, is an Australian ornamental rock with green crystals set in an earthy matrix. Our April 2024 collection includes wands, spheres, hearts and palms.
Science / Origin / Testing
Its geology is more complex than a simple mixture of aegirine and orthoclase. A 2024 study of material from the Mount Arrowsmith Volcanics in northwestern New South Wales describes conspicuous aegirine within a matrix dominated by sodic zeolites, including natrolite and analcime, with feldspar and accessory phases. Nundorite is a rock name, not an individual mineral species. The published study supplies geological context; it is not an analysis of these collection pieces, and we do not assign them a specific quarry or claim that the deposit has been exhausted.
Metaphysical Meaning
Nundoorite meaning in contemporary metaphysical practice centers on feeling rooted while remaining emotionally open. Its green and earthy tones can serve as a focus for heart-centered reflection, boundaries and reconnecting with nature. References to grounding energy describe spiritual symbolism rather than measured mineral properties.
Purple scapolite brings violet color to a less familiar family of gems. This guide features the material from our April 2024 collection and keeps it distinct from our other scapolite entries.
Science / Origin / Testing
Scapolite comprises related aluminosilicates whose principal end members are sodium-rich marialite and calcium-rich meionite. The Smithsonian documents purple gem scapolite from Tanzania, but color alone cannot determine composition or locality. Scapolite geology commonly involves metamorphic environments. No specimen-specific analytical report or confirmed mine is attached to the April photograph; the collection name should not be read as a laboratory identification of an end member.
Metaphysical Meaning
Purple scapolite meaning is often connected with insight, independence and making considered choices. In metaphysical practice, it can be a reminder to pause, reflect and direct personal energy toward a clear intention. These associations are interpretive rather than scientific findings.
Blue Tiger Eye, also known as hawk’s eye, is valued for a silky band of reflected light against a blue to blue-gray background. Our April 2024 photograph records material offered under this familiar lapidary name.
Science / Origin / Testing
The tiger’s-eye family combines quartz with aligned fibrous mineral structures associated with crocidolite. Light interacting with this alignment produces chatoyancy. Modern research describes quartz growing around fibers during repeated fracture opening, rather than treating every example as a simple replacement. The geology explains the optical effect, but a photograph does not establish a specimen’s origin, treatment history or exact mineral proportions. Those details are not independently documented for this collection piece.
Metaphysical Meaning
Blue Tiger Eye meaning often emphasizes perspective, patient observation and calm communication. Its moving sheen can provide a visual focus during meditation or a reminder to consider a situation from more than one angle. Metaphysical references to protective energy express tradition and personal meaning, not measured physical protection.
Utah Variscite Spheres · Soul Body Gems, April 2024.
Background
Utah variscite is admired for its greens and contrasting natural patterns. Spheres lead this April 2024 gallery, followed by palms, hearts and towers.
Science / Origin / Testing
Variscite is a hydrated aluminum phosphate, AlPO₄·2H₂O. Its geology involves phosphate-bearing water reacting with aluminum-rich rocks, often producing fine-grained masses, nodules and veinlets. Documented Utah occurrences include Clay Canyon and the Lucin area. Utah is the supplied origin for these collection pieces; we have not established a particular mine or analytical result for them. This regional guide remains separate from variscite offered from other origins.
Metaphysical Meaning
Variscite meaning in modern metaphysical traditions often concerns compassion, patience and emotional balance. Its green palette can be used as a reminder to approach oneself and others with care. Grounding or heart energy is a symbolic interpretation, separate from the mineral’s chemistry and geology.
Astrophyllite Polished Towers · Soul Body Gems, April 2024.
Background
Astrophyllite is admired for bronze to golden-brown blades that can form radiating patterns. The polished towers in our April 2024 collection provide the opening image for this guide.
Science / Origin / Testing
Astrophyllite is a complex titanium-bearing silicate containing potassium, sodium, iron and manganese. It occurs in alkaline rocks such as nepheline syenites and alkali granites, as well as associated pegmatites and altered rocks. Its bladed crystals may form star-like groups, giving the mineral its name. This geology is general background: polished rock can contain several minerals, and neither the precise assemblage nor the locality of these towers is established by a photograph. No collection-specific laboratory report is attached here.
Metaphysical Meaning
Astrophyllite meaning is often associated with self-knowledge, change and recognizing patterns in one’s life. In metaphysical practice, its radiating appearance can symbolize bringing scattered energy into a purposeful direction. These are reflective associations rather than mineralogical evidence of spiritual effects.
Blue Calcite Old Stock Spheres · Soul Body Gems, April 2024.
Background
Blue calcite is enjoyed for its soft blue appearance and gentle visual texture. Our April 2024 collection photograph shows old-stock spheres; old stock describes their collection history, not a measured geological age.
Science / Origin / Testing
Calcite is calcium carbonate, CaCO₃, a widespread mineral found in sedimentary rocks, marble and mineral veins. It has Mohs hardness 3 and strong cleavage, so polished pieces benefit from gentle handling. Blue is a color description within calcite, not a separate species. Its geology and color-bearing components vary by deposit; no particular color mechanism, mine or specimen-specific analytical result has been established for these spheres.
Metaphysical Meaning
Blue calcite meaning in contemporary metaphysical practice often concerns calm expression, rest and thoughtful listening. A sphere can serve as a visual reminder to slow down and create space for reflection. References to soothing energy are spiritual interpretations rather than demonstrated therapeutic properties.
Kazakhstani Chrysoprase · Soul Body Gems, April 2024.
Background
Chrysoprase is a green chalcedony prized for its fresh color and polished glow. This page records the Kazakhstani material in our April 2024 collection and keeps its supplied origin separate from our other chrysoprase guides.
Science / Origin / Testing
Chalcedony is fine-grained silica, and chrysoprase owes its characteristic green appearance to nickel-bearing constituents. Published research describes chrysoprase associated with the alteration of nickel-bearing rocks; gemological measurements help distinguish it from similarly colored materials such as prase opal. That research explains general chrysoprase geology, not the provenance of this piece. Kazakhstan is the collection’s supplied locality; no specific deposit, treatment history or specimen-specific test report is established here.
Metaphysical Meaning
Chrysoprase meaning commonly centers on hope, generosity and openness to fresh possibilities. In metaphysical practice, its green color is associated with the heart and the energy of renewal. These meanings offer a personal focus and remain separate from analytical identification.
Black Aventurine is the collection name for this dark, reflective material in our April 2024 photograph. It is also sold under the trade name Black Sunstone (India); both entries share the same material information and image.
Science / Origin / Testing
The supplier’s material name is Black Aventurine; the same material is also marketed as Black Sunstone (India). SBG was told that third-party testing identified hematite, goethite and pyrite in quartz, but we do not have a copy of that report and cannot verify its methods, sample or conclusions. This is not an MMGM test. Quartz and feldspar are distinct mineral families: true sunstone is a feldspar gem, so a quartz-hosted material would not be true sunstone. The reported geology is recorded provisionally, without implying that every inclusion in the photographed material has been independently identified.
Metaphysical Meaning
Its metaphysical meaning can be approached through themes of steadiness, resilience and noticing light within darker experiences. Reflective inclusions may serve as a focus for intention-setting or grounding energy in meditation. These symbolic interpretations are separate from mineral identification and do not validate the reported testing.
Black Sunstone (India) is a trade label used for the same material featured in our Black Aventurine guide. The April 2024 photograph is shared between these entries; the word sunstone here is a market name rather than an established feldspar identification.
Science / Origin / Testing
The supplier’s material name is Black Aventurine; the same material is also marketed as Black Sunstone (India). SBG was told that third-party testing identified hematite, goethite and pyrite in quartz, but we do not have a copy of that report and cannot verify its methods, sample or conclusions. This is not an MMGM test. Quartz and feldspar are distinct mineral families: true sunstone is a feldspar gem, so a quartz-hosted material would not be true sunstone. The reported geology is recorded provisionally, without implying that every inclusion in the photographed material has been independently identified.
Metaphysical Meaning
Its metaphysical meaning can be approached through themes of steadiness, resilience and noticing light within darker experiences. Reflective inclusions may serve as a focus for intention-setting or grounding energy in meditation. These symbolic interpretations are separate from mineral identification and do not validate the reported testing.
Polyhedral Pyrite · Soul Body Gems, February 2024.
Background
Polyhedral Pyrite highlights the crisp, many-faced geometry of pyrite crystals. Its metallic surfaces make the relationship between crystal growth and natural form especially easy to appreciate.
Science / Origin / Testing
Pyrite is iron disulfide, FeS₂, with cubic symmetry. Cubes, octahedra and pyritohedra, sometimes combined on one crystal, are familiar expressions of its geology; polyhedral describes shape rather than a separate mineral species. A photograph alone cannot establish a specimen’s locality or treatment history. No individual laboratory report is attached to this collection photograph.
Metaphysical Meaning
In contemporary metaphysical practice, pyrite’s meaning often centers on confidence, boundaries and purposeful action. Its reflective geometry can be used as a focus for visualizing steady energy; these are symbolic interpretations, not measured mineral properties.
Yellow Purple Fluorite from France · Soul Body Gems, February 2024.
Background
This yellow and blue-zoned fluorite is recorded in our collection as material from Valzergues, Aveyron, Occitanie, France. The contrast between its colored growth zones gives each specimen a distinctive visual rhythm.
Science / Origin / Testing
Fluorite is calcium fluoride, CaF₂. Valzergues is a documented French fluorite locality; the collection provenance supplied to Soul Body Gems places this material there. Color zoning records differences during crystal growth and does not require a separate mineral species for each color. The geology of a locality provides context, but color alone cannot verify origin, and this photograph is not a laboratory identification.
Metaphysical Meaning
Fluorite’s metaphysical meaning is often associated with clarity and organizing scattered thoughts. The contrasting zones can serve as a visual reminder to balance different priorities and approach one’s energy with intention, rather than as evidence of a scientific effect.
Amethyst Phantom celebrates Brazilian amethyst with visible outlines of earlier crystal growth inside the present crystal. These internal forms give the impression of a smaller crystal held within a larger one.
Science / Origin / Testing
Amethyst is the purple variety of quartz. A phantom preserves an earlier growth outline, which can be marked by inclusions, a pause in growth or a contrast in color or opacity before more quartz forms around it. This growth history is the relevant geology; a phantom is not a separate mineral species. Brazil is the collection origin supplied for the photographed material, not a mine identification established by its appearance.
Metaphysical Meaning
The metaphysical meaning of phantom amethyst is often framed around personal growth and integrating earlier experiences. Its internal layers offer a symbolic focus for reflection, patience and renewed energy; these interpretations remain separate from the crystal’s geological history.
Golden Pinolite is the collection name for this Canadian material, admired for its contrasting mineral patterns. The locality name distinguishes it from other pinolite offerings without treating it as a separate mineral species.
Science / Origin / Testing
Pinolite, also written pinolith, is a rock name commonly used for a magnesite-rich aggregate with contrasting dolomite and dark graphitic material. Pinolitic magnesite is documented at Quartz Creek in British Columbia. Golden is retained here as a trade descriptor; the precise phases, color mechanism and provenance of this individual piece are not established by a photograph or by the trade name alone.
Metaphysical Meaning
In metaphysical use, its meaning can be explored through the contrast between pale and dark areas: balance, grounding and patient change. Working with its energy is a personal symbolic practice, not a laboratory finding about the rock.
Blue Sugilite Richterite Beaded Necklace · Soul Body Gems, February 2024.
Background
Blue Sugilite is preserved here as the familiar trade name for the richterite material in our necklace collection. Keeping the sales name searchable helps connect the jewelry with its more precise mineral description.
Science / Origin / Testing
For this collection, Soul Body Gems identifies the material as richterite, rather than blue-colored sugilite. Richterite belongs to the amphibole group and is distinct from sugilite; published gemological work documents rocks containing both minerals, so the trade name should not be generalized to every blue stone. Mineral composition, rather than color, resolves that distinction. No specimen-specific laboratory report is presented for these necklaces. Their geology and mineral identification should not be inferred solely from photographs.
Metaphysical Meaning
Collectors may give this blue material a metaphysical meaning associated with composed communication and emotional perspective. A necklace can serve as a reminder to pause and direct one’s energy thoughtfully. These are contemporary symbolic associations, not scientific effects of richterite.
Rainbow Scapolite · Soul Body Gems, February 2024.
Background
Rainbow Scapolite is the trade name used for this collection’s colorful material. This guide keeps that name distinct from the narrower mineralogical terminology needed to describe scapolite accurately.
Science / Origin / Testing
Scapolite generally refers to the marialite–meionite series, whose compositions vary between sodium-rich and calcium-rich end members. Rainbow is not a mineral species or a standardized composition. Color and apparent shimmer alone cannot establish the precise member, inclusions, treatment status or locality of a piece. Those questions require specimen-specific testing; general scapolite geology does not supply an identification for every stone sold under this name.
Metaphysical Meaning
Its metaphysical meaning can be approached through adaptability and making room for different perspectives. The rainbow trade name lends itself to reflection on varied experiences and balanced energy, as personal symbolism rather than established mineral science.
These Russian Azurite pieces are recorded by Soul Body Gems as old stock from the Poteryaevskoe Mine, also known as the Rubtsovsk Mine, in Altai Krai, Russia. Their deep blue color and intricate internal patterns are central to their appeal.
Science / Origin / Testing
Azurite is a copper carbonate hydroxide that commonly develops in oxidized copper deposits. The Rubtsovsk locality is documented for azurite, consistent with the supplied provenance. Internal banding and changing reflections may produce a shimmering appearance, but the precise optical mechanism cannot be established from a photograph. Claims that its blue is unique to one locality, or that a particular piece is exceptionally rare, require more evidence than appearance. This guide records the collection’s origin separately from laboratory verification.
Metaphysical Meaning
Azurite’s metaphysical meaning is often connected with contemplation, intuition and a sense of inner depth. Its saturated blue can provide a focus for quiet reflection and intentional energy practices; these interpretations are not scientific findings about copper minerals.
Red Fox Agate from Patagonia · Soul Body Gems, February 2024.
Background
Red Fox Agate is a trade name associated with Patagonian agate, also called Crater Agate in specimen collections. Its striking red areas and translucent chalcedony make the natural contrasts a central part of its appeal.
Science / Origin / Testing
Agate is a banded form of chalcedony, a microcrystalline silica material. Documented Red Fox or Crater Agate specimens from Patagonia combine chalcedony with hematite. Iron-bearing mineral material can contribute the red appearance, although the precise composition of this collection piece has not been established by an individual report. Patagonia is the supplied regional origin; geology and trade descriptions alone cannot verify a specific mine.
Metaphysical Meaning
In metaphysical practice, its meaning is often expressed through resilience, warmth and grounded creativity. Its contrasting red and translucent regions can be used as a focus for gathering one’s energy and approaching change deliberately; these are spiritual interpretations rather than analytical results.
Carved crystal daggers are explored here as symbolic objects used in contemporary spiritual practice. The obsidian carvings in our collection illustrate the shape’s meaning without any association with violence.
Science / Origin / Testing
A dagger is a carved form, not a mineral species. The photographed pieces are sold as obsidian, a volcanic glass; the shape itself does not identify composition or change the material’s geology. There is no scientific evidence that a carving can sever an invisible energetic attachment. Symbolic cord-cutting is a reflective practice, not a measured physical process.
Metaphysical Meaning
In nonviolent metaphysical ritual, a dagger shape can represent releasing an unhealthy attachment, setting a boundary or completing a chapter. A practitioner may place the carving nearby while journaling or visualizing a cord being released, directing intention and energy toward moving forward. No contact with the body or another person is needed; the meaning lies in the symbolism.
Polished Elite Shungite SS Pendants · Soul Body Gems, February 2024.
Background
Elite Shungite, also called noble shungite in the trade, is a name used for lustrous, carbon-rich material. This collection photograph shows polished pieces set in sterling silver pendants.
Science / Origin / Testing
Shungite terminology can refer both to carbon-rich natural matter and to the rocks containing it, with variable composition. Elite is a commercial grade description, not a separate mineral species or a guaranteed carbon percentage. Shungite is associated with Karelia, Russia, but a pendant’s origin and composition require documentation. Published geology and research on shungite carbon do not establish that every retail piece has the same fullerene content or composition. No individual carbon assay is presented for these pendants.
Metaphysical Meaning
Its metaphysical meaning is commonly framed around grounding and personal boundaries. Wearing a pendant can act as a reminder to pause and manage one’s energy intentionally. Claims of healing or protection from everyday electromagnetic exposure are not established by this collection photograph or by the material’s carbon content.
Tiger Eye SS Rings · Soul Body Gems, February 2024.
Background
Tiger Eye is admired for a moving band of reflected light that shifts as a polished stone is turned. Our sterling silver rings show how a curved cut brings this optical effect into jewelry.
Science / Origin / Testing
Tiger Eye is a quartz-rich gem material with a fibrous internal structure. GIA describes crocidolite fibers encapsulated by quartz and iron oxides contributing golden color in its museum specimen; the aligned inclusions are central to the moving optical band called chatoyancy. This geology explains the effect without assigning a new species to the trade name. A photograph cannot establish treatment history or locality for an individual ring.
Metaphysical Meaning
Its metaphysical meaning often centers on courage, focus and practical confidence. The moving band can serve as a visual focus for steady energy and clear intention. These symbolic associations are separate from the physical optics of chatoyancy.
White Buffalo Turquoise white-and-black SS pendants · Soul Body Gems, October 2024.
Background
White Buffalo Turquoise is retained as a searchable trade name for the white-and-black pendant collection formerly placed under Wild Horse Jasper. The corrected placement keeps the two collection identities separate.
Science / Origin / Testing
White Buffalo is a trade material name and should not be read as proof of the mineral turquoise. Published discussions describe white materials sold under turquoise-related labels as mixtures that may include quartz, calcite and other phases; names and appearances do not establish the composition of these particular pendants. No specimen-specific identification is attached here. The geology and mineral content of a trade material must be evaluated through documentation and testing.
Metaphysical Meaning
Its metaphysical meaning may be explored through contrast, balance and a sense of renewal. The white-and-black pattern can be a reminder to make space for rest and direct one’s energy deliberately. Such symbolism is distinct from mineral identification.
Ruby Zoisite SS Rings · Soul Body Gems, February 2024.
Background
Ruby Zoisite is the collection name for jewelry combining ruby-colored areas with a contrasting green host. This guide records the name supplied for our February 2024 sterling silver rings.
Science / Origin / Testing
Ruby is corundum, while zoisite is a distinct calcium aluminum silicate. Ruby-bearing zoisite rock is often called anyolite and is documented from Tanzania; its contrasting colors reflect different mineral components. General geology does not identify the host of every red-and-green carving or cabochon. These rings are shown as collection photographs, without a specimen-specific laboratory report or a mine attribution.
Metaphysical Meaning
Its metaphysical meaning often combines the symbolism of vitality with patient growth. The contrasting colors can be used as a focus for balancing active and restful energy. These are spiritual interpretations rather than laboratory findings.
Manganese Calcite SS Bracelets · Soul Body Gems, February 2024.
Cobalto Calcite (Not) is an alternate listing for our Mangano Calcite (Africa) material.
The photographed material was sold under a cobalto calcite label. The report for sample 10505 instead documents predominantly calcite with low cobalt and manganese contents; it does not justify applying the trade name to every pink stone. The possible roselite inclusion remains tentative.
A pink calcite specimen with low manganese and cobalt contents.
Sample 10505 · February 26, 2024.
Locality uncertain: Congo or Morocco.
What the testing revealed
The specimen is predominantly calcite. The measured trace and minor elements include manganese at 0.15 wt.% and cobalt at 0.07 wt.%. The report suggests manganese may contribute to the pink color alongside cobalt; the color mechanism was not conclusively established.
A small calcium-cobalt arsenate inclusion was also found, with roselite proposed as a possible identity. This is not a confirmed roselite identification. The specimen was originally described as cobaltocalcite.
Use this guide alongside the written findings and the original report transcript. It explains the purpose of each analytical figure and preserves the laboratory’s own figure labels. The interpretations apply to the tested specimen; signals alone do not establish the identity of every similar-looking stone.
Electron microscope image: This view shows small-scale regions selected for analysis. Its brightness contrast helps distinguish regions with different compositions; it is not a photograph of their natural colors. Numbered spots connect this view to the analyses listed in the report.
Laboratory figure caption: Fig.2: Backscattered electron image of an area of the specimen.
Elemental spectrum: The peaks record characteristic X-ray signals from elements in the analyzed spot or area. This is an analysis of that location, not automatically of the entire specimen. Any mineral identification or uncertainty named in the laboratory caption is retained below.
Laboratory figure caption: Fig. 3: Energy dispersive spectrum of spot 1 in Fig. 2 (calcium cobalt arsenate)
Elemental spectrum: The peaks record characteristic X-ray signals from elements in the analyzed spot or area. This is an analysis of that location, not automatically of the entire specimen. Any mineral identification or uncertainty named in the laboratory caption is retained below.
Laboratory figure caption: Fig. 4: Energy dispersive spectrum of spot 2 in Fig. 2 (calcite)
Element map: This map shows where the named elements occur within the analyzed area. Its colors represent the laboratory’s selected element channels, rather than the specimen’s visible colors. The caption below preserves any color key or distribution noted by the laboratory.
Laboratory figure caption: Fig. 5: X-ray maps of the area shown in Fig. 2. Arsenic: violet, calcium: yellow.
Read the complete report as text
Analytical Result Report
Sample id: 10505 (recent package #1)
Submitted by: Soul Body Gems
Date completed: 2-26-2024
Operating conditions: An AMRAY 1830 SEM operated at 25 kV acceleration potential, 24 mm working distance, 0 degrees sample tilt, coated with 250 Å carbon, and also using the attached XRF unit operated at 30 kV.
A BRUKER Titan X-ray fluorescence spectrometer was also used and operated for 30 seconds at 50, 25, and 10 kV.
Fig. 1: Photograph of the specimen. Approximately 20 mm maximum dimension.
Fig.2: Backscattered electron image of an area of the specimen.
Fig. 3: Energy dispersive spectrum of spot 1 in Fig. 2 (calcium cobalt arsenate)
Fig. 4: Energy dispersive spectrum of spot 2 in Fig. 2 (calcite)
Fig. 5: X-ray maps of the area shown in Fig. 2. Arsenic: violet, calcium: yellow.
Table 1: minor and trace elements in the calcite.
Laboratory data as recorded in the report
Element
Reported value
Arsenic
nd
Cobalt
0.07
Iron
0.15
Magnesium
0.14
Manganese
0.15
Summary of findings: This specimen (Fig. 1) is peculiar. It was said to be cobaltocalcite. Cobaltocalcite is CoCO3. Compositionally, it is calcite (Figs. 2 and 4). A small inclusion was spotted on the back of the specimen which is a calcium cobalt arsenate. The mineral roselite would be a potential choice for this little inclusion. This specimen is essentially just calcite, even calling it contain calcite is pushing it in my opinion when the low quantity of cobalt in it is considered. Maybe one could call it low cobalt-bearing calcite? I am actually amazed about the pink color, is so little cobalt could cause this? Maybe the manganese helped with that, there is about double the amount than cobalt (Table 1).
Date: February 26, 2024 Signature
Read the original laboratory report as text
The following text and tables are transcribed from the original laboratory document. Figure captions identify the report images; the laboratory interpretations and limitations are preserved.
Laboratory report 1
Analytical Result Report
Sample id: 10505 (recent package #1)
Submitted by: Soul Body Gems
Date completed: 2-26-2024
Operating conditions: An AMRAY 1830 SEM operated at 25 kV acceleration potential, 24 mm working distance, 0 degrees sample tilt, coated with 250 Å carbon, and also using the attached XRF unit operated at 30 kV.
A BRUKER Titan X-ray fluorescence spectrometer was also used and operated for 30 seconds at 50, 25, and 10 kV.
Fig. 1: Photograph of the specimen. Approximately 20 mm maximum dimension.
Fig.2: Backscattered electron image of an area of the specimen.
Fig. 3: Energy dispersive spectrum of spot 1 in Fig. 2 (calcium cobalt arsenate)
Fig. 4: Energy dispersive spectrum of spot 2 in Fig. 2 (calcite)
Fig. 5: X-ray maps of the area shown in Fig. 2. Arsenic: violet, calcium: yellow.
Table 1: minor and trace elements in the calcite.
Laboratory data as recorded in the report
Element
Reported value
Arsenic
nd
Cobalt
0.07
Iron
0.15
Magnesium
0.14
Manganese
0.15
Summary of findings: This specimen (Fig. 1) is peculiar. It was said to be cobaltocalcite. Cobaltocalcite is CoCO3. Compositionally, it is calcite (Figs. 2 and 4). A small inclusion was spotted on the back of the specimen which is a calcium cobalt arsenate. The mineral roselite would be a potential choice for this little inclusion. This specimen is essentially just calcite, even calling it contain calcite is pushing it in my opinion when the low quantity of cobalt in it is considered. Maybe one could call it low cobalt-bearing calcite? I am actually amazed about the pink color, is so little cobalt could cause this? Maybe the manganese helped with that, there is about double the amount than cobalt (Table 1).
Black Tourmaline Erongo Namibia · Soul Body Gems, January 2024.
Background
Black tourmaline from Namibia’s Erongo region is admired for its glossy surfaces, striated prisms and sharply formed terminations. Our January 2024 collection features small specimens supplied from this celebrated mineral district.
Science / Origin / Testing
Black tourmaline is commonly called schorl, an iron-rich member of the tourmaline supergroup. Research on Erongo tourmalines documents compositional variation, so the appearance of a black crystal alone cannot distinguish every tourmaline species. The region’s geology includes granite and pegmatite cavities that provide settings for many collector specimens. The Erongo origin is our supplied collection provenance; these photographs are not a laboratory determination of composition or mine.
Metaphysical Meaning
In contemporary metaphysical practice, black tourmaline carries a meaning of protection, grounding and personal boundaries. Some people use it as a reminder of courage and steady energy; these are spiritual interpretations rather than scientifically demonstrated effects.
Isua Stone is a collection name for material supplied from Greenland, associated with a region famous for preserving very ancient rocks. Its appeal connects a tactile polished stone with the deep history of Earth’s crust.
Science / Origin / Testing
Isua is a geological region, not the name of a single mineral species. Geological Survey of Denmark and Greenland publications describe an ancient supracrustal belt containing several rock types, including metamorphosed volcanic and sedimentary rocks. Consequently, a regional age or mineral assemblage cannot automatically be assigned to every stone sold under this name. The photographed piece is recorded with supplied Greenland provenance; petrographic or mineral analysis would be needed to establish its precise composition, and dating would require appropriate geological evidence.
Metaphysical Meaning
Its metaphysical meaning is often approached through themes of endurance, grounding and connection with Earth’s long history. Using the stone to focus patient, steady energy is a personal spiritual practice, separate from its geology.
Celestine, also widely called celestite, is a strontium sulfate mineral appreciated for its delicate crystals. Pale blue examples are familiar to collectors, although the mineral also occurs in other colors.
Science / Origin / Testing
The formula is SrSO₄. Celestine belongs to the barite mineral group, with geology spanning sedimentary evaporites and mineral veins. Its crystal structure produces distinct cleavage directions, and its Mohs hardness is only about 3–3.5. These properties explain why specimen clusters benefit from gentle handling. No geographic origin or individual laboratory analysis is inferred for this January photograph.
Metaphysical Meaning
Celestine’s metaphysical meaning commonly centers on peace, reflection and gentle communication. Its soft visual character can serve as a focus for calm energy in meditation; these associations belong to spiritual tradition, not measured mineral properties.
Hermanov Spheres, also known as Heřmanov balls, are naturally layered mineral nodules from Heřmanov in the Czech Republic. A dark mica-rich center contrasts with a pale, radiating outer shell.
Science / Origin / Testing
These are mineral aggregates rather than spheres cut from one crystal species. Locality studies describe phlogopite cores with surrounding amphibole-rich reaction zones; talc or other intervening minerals may occur. Research by Majzlan and Grapes reports both anthophyllite and tremolite in these nodules, refining the older description of an anthophyllite-only rim. Their geology records mineral reactions near the contact between ultramafic rock and granitic pegmatite. The composition of our individual specimen has not been independently established. Display it intact and avoid abrasive cleaning of the fibrous rim.
Metaphysical Meaning
The layered form lends itself to a metaphysical meaning of boundaries, protection and inner stability. Collectors may use it as a symbol of keeping centered energy while adapting to change; this is an interpretive practice rather than a scientific effect.
Aksumbe Turquoise Cabs · Soul Body Gems, January 2024.
Background
Aksumbe Turquoise is the locality name supplied for these Kazakhstan cabochons. This collection highlights turquoise from a less familiar source rather than treating all turquoise localities as interchangeable.
Science / Origin / Testing
Turquoise is a hydrated copper-aluminum phosphate. Its geology reflects copper-bearing waters reacting with aluminum- and phosphorus-bearing minerals, often in weathered, dry-region deposits. The cabochons were supplied to Soul Body Gems as unstabilized; that is a collection-specific sourcing statement, not a treatment determination made from their photograph. We do not have independent evidence here to confirm a mine depletion date or to extend the treatment statement to other Aksumbe material. Mineral testing and treatment analysis address different questions, and both matter when evaluating turquoise.
Metaphysical Meaning
Turquoise has a long history of symbolic use. In modern metaphysical practice its meaning includes protection, friendship and clear expression; focusing on balanced energy is a personal interpretation, separate from evidence about origin or treatment.
Campitos Turquoise SS Rings · Soul Body Gems, January 2024.
Background
Campitos Turquoise is associated with Sonora in northern Mexico. Our January photograph shows this named turquoise collection set in sterling silver rings.
Science / Origin / Testing
Turquoise is a hydrated copper-aluminum phosphate. Its geology reflects copper-bearing waters reacting with aluminum- and phosphorus-bearing minerals, often in weathered, dry-region deposits. Campitos is a geographic trade designation, not a separate mineral species. Reporting on the locality describes blue turquoise from Sonora and discusses treatment practices. A locality name by itself cannot establish whether a particular ring stone is untreated, stabilized, dyed or otherwise enhanced. We retain the supplied Campitos provenance without assigning an undocumented treatment status to these rings.
Metaphysical Meaning
Its metaphysical meaning draws on turquoise traditions of protection and communication. Some wearers choose it as a reminder to express themselves with calm, confident energy; this symbolic use is separate from its mineral chemistry.
This guide covers green diopside supplied from Pakistan. It remains separate from our Russian chrome diopside and other locality-specific collections.
Science / Origin / Testing
Diopside is a calcium-magnesium silicate, CaMgSi₂O₆, in the pyroxene group. Its geology includes metamorphic carbonate rocks, skarns and some igneous environments. Green color can reflect different trace elements; a green appearance alone does not establish a chromium concentration or justify identifying every piece as chrome diopside. Pakistan is recorded as the supplied origin of this collection, without assigning an unreported mine or claiming a laboratory origin determination.
Metaphysical Meaning
Green diopside is associated in metaphysical practice with compassion, renewal and a connection to nature. Its meaning can be used as a personal prompt for receptive, balanced energy; these are spiritual associations rather than experimentally established properties.
Rutile Hematite brings together two contrasting oxide minerals in one collector specimen. This January example is supplied from Brazil.
Science / Origin / Testing
Rutile is titanium dioxide, TiO₂, while hematite is iron oxide, Fe₂O₃. Rutile may form slender or twinned crystals alongside metallic-looking hematite; their association is documented in mineralogical literature. Their geology includes several igneous and metamorphic settings. They are separate minerals, and a striking arrangement does not mean one is a metallic coating or that the whole piece has a single composition. Brazil is the supplied provenance here; no specific mine or individual analytical result has been established for this photographed specimen.
Metaphysical Meaning
In metaphysical interpretation, the combination suggests focused intention supported by grounding. Its meaning brings bright, purposeful energy together with steadiness; this is symbolism inspired by the mineral contrast, not a finding of laboratory testing.
Petrified Wood Madagascar · Soul Body Gems, January 2024.
Background
Petrified wood preserves the form of ancient wood through mineralization. This collection is supplied from Madagascar, with polished surfaces that reveal its visual patterns.
Science / Origin / Testing
The geology of petrified wood involves minerals filling pore spaces, replacement of organic material, or a combination of processes. Silica is common in petrified wood, and preserved cellular details can help specialists investigate the original plant. Country of origin alone does not determine geological age, tree species or exact mineral composition. Those details require the specimen’s geological context and, where appropriate, microscopic or mineral analysis; none is assigned solely from this photograph.
Metaphysical Meaning
Petrified wood’s metaphysical meaning often centers on patience, rootedness and continuity through change. Its long natural history can inspire grounding energy during reflection, while the fossilization process belongs to geology and paleontology.
Blue Apatite is the general collection guide for the blue apatite shown in this January photograph. It is separate from our other blue apatite locality guides and composite-material pages.
Science / Origin / Testing
Apatite names a mineral group of calcium phosphates, with fluorapatite, hydroxylapatite and chlorapatite distinguished by their chemistry. Fluorapatite is widespread and can be blue, but color alone does not establish the exact species or trace-element cause of color. Apatite’s geology spans igneous, metamorphic and sedimentary settings and has a Mohs hardness around 5. This general guide does not assign a country, mine or individual laboratory test to the photographed collection.
Metaphysical Meaning
Blue apatite’s metaphysical meaning is often linked to curiosity, communication and purposeful learning. It may be chosen as a reminder to direct creative energy toward understanding; this spiritual interpretation is separate from its mineralogy.
Vivianite is an iron phosphate mineral valued for its blue to green crystals and distinctive color changes. The January collection photograph introduces this material without assigning an unreported locality.
Science / Origin / Testing
Its ideal formula is Fe₃(PO₄)₂·8H₂O. Fresh material can be very pale, becoming deeper blue or green as iron oxidizes, and eventually darkening further. Vivianite’s geology includes several environments, including phosphate-bearing pegmatites and sediments associated with organic material. Its low Mohs hardness of about 1.5–2 and perfect cleavage make it a delicate display mineral. A photograph cannot establish its precise oxidation state, geographic origin or an individual specimen’s composition.
Metaphysical Meaning
Its metaphysical meaning is often interpreted through transformation, reflection and emotional depth. Using it to contemplate changing energy is a personal spiritual practice; oxidation and color development have a separate chemical explanation.
Copper Dolomite Palms · Soul Body Gems, January 2024.
Background
Copper Dolomite is the supplied collection name for these polished palms from Namibia. The guide focuses on geology and that provenance and keeps it distinct from other dolomite materials.
Science / Origin / Testing
Dolomite is the calcium-magnesium carbonate CaMg(CO₃)₂. Native copper and dolomite occur together in documented Namibian specimens, including material from Tsumeb, but that occurrence does not establish a mine or composition for every polished piece sold as Copper Dolomite. Copper is not an essential component of the dolomite formula. Mineral analysis would be needed to distinguish native copper, copper-bearing minerals, other inclusions or surface treatments in a particular palm; the photograph alone cannot settle that question.
Metaphysical Meaning
In metaphysical practice, this collection name invites themes of grounded vitality and steady action. Its meaning can be used as a focus for balanced energy, while claims about mineral constituents remain matters for testing.
Purple Aragonite is the supplied collection name for this January piece. Its color and form provide an appealing introduction to a mineral whose structure differs from calcite.
Science / Origin / Testing
Aragonite and calcite share the formula CaCO₃ but arrange their atoms differently: aragonite has an orthorhombic structure. Its geology includes caves, springs, sedimentary deposits and biological mineralization. Color alone does not identify aragonite or establish the cause of a purple hue. The collection label is retained without assigning an undocumented locality, color-producing element or treatment status; mineral identification can be checked by methods such as X-ray diffraction or Raman spectroscopy.
Metaphysical Meaning
Purple aragonite’s metaphysical meaning may be approached through balance, patience and reflective awareness. Some people choose it to focus calm energy during meditation; these are interpretive associations rather than conclusions from mineral testing.
Emerald Spheres Brazil · Soul Body Gems, January 2024.
Background
This guide covers the emerald spheres supplied from Brazil in our January collection. They are distinct from material sold as Emerald Mica or Emerald (Zimbabwe), whose shared report did not identify emerald.
Science / Origin / Testing
Emerald is the green variety of beryl, Be₃Al₂Si₆O₁₈, with color related to chromium and/or vanadium. Brazil has documented emerald deposits with differing geology and associated minerals. A sphere may include host rock as well as emerald, so its appearance does not imply that the entire object is pure beryl. We retain the supplied Brazilian provenance without asserting a specific mine, treatment status or laboratory identification of this particular sphere collection.
Metaphysical Meaning
Emerald’s metaphysical meaning often centers on growth, generosity and renewal. A sphere may serve as a symbolic focus for open-hearted energy; these associations are distinct from the evidence used to identify beryl and establish origin.
Kunzite Collector Piece · Soul Body Gems, December 2023.
Background
Our Pakistani kunzite collector pieces combine a soft lilac glow with impressive, elongated crystal forms. Their scale and natural faces make these examples especially compelling as display specimens.
Science / Origin / Testing
Kunzite is pink to violet spodumene, a lithium aluminum silicate with the formula LiAlSi2O6. Manganese contributes its color, and pleochroism means that the shade can look different as a crystal is turned. Spodumene grows in pegmatites, where slowly cooling, chemically enriched melts can produce large crystals. Pakistan is the supplied provenance of these collection pieces; an exact mine is not documented here. We value their collector quality without treating any country as a guarantee of grade. Kunzite has two perfect cleavage directions, so even a substantial specimen can split after a hard knock. Protect it from prolonged bright light and heat, which can fade its color. These pieces have no SBG laboratory report; the guide records their collection identification and provenance.
Metaphysical Meaning
In contemporary crystal traditions, kunzite is associated with compassion, emotional openness and gentle heart-centered energy. A collector crystal can serve as a reminder to meet oneself and others with patience. These meanings are spiritual interpretations, separate from mineral identification.
Dendritic Golden Healer · Soul Body Gems, December 2023.
Background
Dendrites are branching mineral patterns that can resemble ferns, moss or tiny trees. Our Dendritic Golden Healer photograph illustrates how these delicate dark branches contrast with a golden, translucent host.
Science / Origin / Testing
Dendritic describes a growth pattern rather than a single mineral species. Dissolved components carried by fluids can precipitate into branching deposits, often within thin fractures or along rock surfaces. The expanding tips divide into smaller branches as growth responds to local conditions and the supply of material. The result can look organic, but mineral dendrites are not preserved plants. Dark dendrites commonly involve manganese oxides, sometimes with iron-bearing material; their appearance alone cannot establish an exact species. Potter and Rossman’s study found several manganese-oxide minerals in dendritic deposits and challenged the widespread assumption that all such patterns are pyrolusite. Other minerals, including native metals, can also grow dendritically. Golden Healer is a trade description, not a formal mineral species. The exact composition of the branches and golden color in this photographed piece has not been established by an SBG laboratory report.
Metaphysical Meaning
Dendritic stones are often used symbolically for connection, patience and personal growth. Their branching shapes invite reflection on the ways a life develops through many small choices. This meaning comes from their visual symbolism and contemporary spiritual practice.
Epidote Quartz Turkey · Soul Body Gems, December 2023.
Background
Bright green epidote gives these Turkish quartz specimens their distinctive contrast and sparkling texture. Our collection locality is supplied as Şemdinli, Hakkâri Province, Turkey.
Science / Origin / Testing
Epidote is a calcium aluminum iron silicate hydroxide, while quartz is silicon dioxide. They are separate mineral phases in this association. Epidote commonly occurs in metamorphic and altered rocks and can be associated with quartz. Its crystals may be prismatic, fibrous or granular, and its color ranges through yellow-green, pistachio and darker green tones. The title Epidote on Quartz describes the supplied identification and visible association; it does not establish the detailed sequence of crystal growth. An exact pocket or mine and a specimen-specific SBG laboratory report are not documented for these pieces. The locality is collection provenance, not a laboratory determination.
Metaphysical Meaning
In contemporary crystal practice, epidote is associated with renewal, grounded optimism and awareness of repeated patterns. Paired with quartz, it is often used as a symbol of clarity and intentional change. These are metaphysical interpretations rather than established effects on circulation, immunity or thyroid function.
Sagenite Rutile highlights fine rutile needles arranged in a striking network. The coppery, crossing inclusions in our collection photograph make the lattice pattern the focus of the piece.
Science / Origin / Testing
Rutile is titanium dioxide, TiO2. Sagenite is a name for its netlike or reticulated habit, rather than a separate mineral species. Slender crystals cross or intergrow to form a mesh; rutile can occur as needles enclosed in quartz and other hosts. Lattice Rutile is another descriptive name used for this appearance. Acicular simply means needle-shaped: acicular rutile need not form a network, so the terms overlap without being universal synonyms. Our mirrored Acicular Rutile guide documents this same collection example. Its precise origin, treatment history and specimen-specific laboratory identification are not established here.
Metaphysical Meaning
Within contemporary crystal traditions, sagenite is associated with discernment, insight and bringing scattered ideas into a useful pattern. Its interwoven needles can symbolize learning from experience and connecting practical choices with inner reflection. These meanings are spiritual interpretations, separate from geology.
Sagenite Rutile highlights fine rutile needles arranged in a striking network. The coppery, crossing inclusions in our collection photograph make the lattice pattern the focus of the piece.
Science / Origin / Testing
Rutile is titanium dioxide, TiO2. Sagenite is a name for its netlike or reticulated habit, rather than a separate mineral species. Slender crystals cross or intergrow to form a mesh; rutile can occur as needles enclosed in quartz and other hosts. Lattice Rutile is another descriptive name used for this appearance. Acicular simply means needle-shaped: acicular rutile need not form a network, so the terms overlap without being universal synonyms. Our mirrored Acicular Rutile guide documents this same collection example. Its precise origin, treatment history and specimen-specific laboratory identification are not established here.
Metaphysical Meaning
Within contemporary crystal traditions, sagenite is associated with discernment, insight and bringing scattered ideas into a useful pattern. Its interwoven needles can symbolize learning from experience and connecting practical choices with inner reflection. These meanings are spiritual interpretations, separate from geology.
Collawood (Turkey) · Soul Body Gems, November 2023.
Background
Collawood, also written Colla Wood, is a trade name for Turkish fossil wood enriched with colorful copper minerals. The November 2023 collection photo shows a polished cross-section that brings the preserved wood structure and blue-green mineralization into view.
Science / Origin / Testing
Published research describes silicified wood from the Zile area of Tokat Province, Turkey, in which copper-bearing fluids entered tissue and fractures. Analyzed examples contain blue azurite and green malachite, with chrysocolla a minor component. The trade name does not mean that every blue-green area is chrysocolla. Silica preservation and later copper mineral deposition can record separate episodes; mineral proportions vary among pieces. These are findings for studied material, rather than a laboratory report for the photographed specimen.
Metaphysical Meaning
In contemporary crystal practice, fossil wood is associated with patience, grounding and continuity. Its copper-mineral colors also inspire themes of renewal and emotional expression. These are symbolic traditions.
Blue Aragonite Shapes · Soul Body Gems, November 2023.
Background
Blue aragonite combines soft blue-green color with the radiating fibers, bands and curved growth patterns of a carbonate mineral. This guide focuses on material circulating through the Middle Eastern and neighboring Southwest Asian mineral trade, including documented blue aragonite from Afghanistan. The collection photograph shows polished shapes.
Science / Origin / Testing
Aragonite is calcium carbonate, CaCO3, with an orthorhombic structure. Calcite has the same chemistry but a different crystal structure. Aragonite can form fibrous, banded, branching or rounded aggregates as mineral-bearing water precipitates carbonate. Blue specimens are documented from Helmand, Afghanistan; a precise mine is not established for the photographed shapes. Copper is proposed as a color contributor in some specimens, but color alone does not identify either the mineral or its chromophore. Blue calcite mixed with aragonite is also sold under trade names, so mixed carbonate material should not automatically be described as pure aragonite. Hardness is approximately 3.5-4; protect polished surfaces from abrasion, acids and prolonged soaking.
Metaphysical Meaning
Blue aragonite is associated in modern crystal traditions with gentle communication, calm reflection and emotional balance. These meanings are spiritual interpretations.
Azurite Blueberries (Russia) · Soul Body Gems, November 2023.
Background
Azurite Blueberries is a collector nickname for rounded blue azurite nodules and crystal aggregates. The Russian examples photographed for our November 2023 collection have been cut to expose their interiors, including dark sparkling pockets and radiating or segmented patterns.
Science / Origin / Testing
Azurite is a copper carbonate hydroxide, Cu3(CO3)2(OH)2, that forms during oxidation of copper deposits. Its growth habits include spherical, radial, botryoidal and drusy aggregates. Closely grouped crystals can build rounded masses rather than a single smooth crystal. Some nodules enclose cavities lined with tiny crystals: the sparkling lining is called druzy. Not every blueberry is hollow, and cutting reveals an existing interior rather than creating the crystals. Rounded azurite and polished, crystal-lined nodules are documented from Russia, including the Urals and Altai; Russia is the supplied origin here, without an assigned mine. Azurite is brittle and relatively soft, about 3.5-4 on the Mohs scale. Handle cut faces gently and avoid acids, abrasive cleaning and heat.
Metaphysical Meaning
Azurite is associated in crystal traditions with insight, contemplation and clear thinking. The hidden crystal pockets offer a symbolic reminder of discoveries beneath the surface.
Raw Dioptase (Africa) · Soul Body Gems, November 2023.
Background
Dioptase is prized for vivid emerald-green to blue-green crystals and strong glassy luster. Our November 2023 photo shows small raw African specimens on matrix. The regional label Africa is retained; no individual mine is assigned from appearance alone.
Science / Origin / Testing
Dioptase is a hydrated copper silicate, commonly written CuSiO3·H2O, with a trigonal crystal structure. Copper is essential to its composition. It forms in the oxidized zones of some copper deposits and can occur with minerals such as malachite, chrysocolla and quartz. African occurrences include Namibia, the Republic of the Congo and the Democratic Republic of the Congo. Tsumeb and the Kaokoveld region of Namibia are well-known collector sources, but these examples do not establish the locality of our photographed pieces. Dioptase has a Mohs hardness near 5, perfect cleavage and brittle crystals; protect exposed crystal points from impact and clean gently. This guide provides mineral background, not a specimen-specific testing claim.
Metaphysical Meaning
In contemporary crystal traditions, dioptase is associated with the heart, compassion and releasing old emotional patterns. These interpretations describe spiritual practice rather than established mineral properties.
Dreamcoat Lemurian · Soul Body Gems, November 2023.
Background
Dreamcoat Lemurian is a trade name for colorful quartz with visible zoning, inclusions or later growth over an earlier quartz core. The November 2023 collection photograph highlights a polished point with purple, orange-red and clearer regions.
Science / Origin / Testing
Quartz is silicon dioxide, SiO2. Changes in the growth environment can produce successive zones, with mineral inclusions or iron-bearing material concentrated between growth stages. Research on multicolored Brazilian quartz documents changing iron-related colors and separate minerals such as goethite, hematite and pyrite. That research illustrates a growth process; it does not establish all of those minerals in every Dreamcoat specimen. Material sold under this name is reported from Cristalina, Goiás, Brazil, but the trade name alone is not mine documentation. Lemurian and Dreamcoat are descriptive or spiritual trade terms, not separate mineral species. Purple color may represent amethyst; red-orange areas may include iron oxides or hydroxides. Identifying an individual inclusion requires appropriate examination.
Metaphysical Meaning
Lemurian quartz is associated in contemporary spiritual practice with meditation, inner guidance and connection. Dreamcoat material adds symbolic themes of layered experience and transformation. Stories about Lemurian civilizations are spiritual narratives rather than geological history.
Kakortokite is a striking, multi-mineral igneous rock associated with the Ilímaussaq complex in southern Greenland. Its pale, dark and reddish patches reflect different mineral components. It belongs to the nepheline syenite family; Kakortokite is a rock name rather than the name of a single mineral.
Science / Origin / Testing
The characteristic assemblage includes alkali feldspar, nepheline, eudialyte and arfvedsonite. Research on the Ilímaussaq intrusion documents layers enriched in different minerals, formed as the alkaline magma crystallized. Polishing reveals this mineral mosaic. These collection photographs show the material sold by Soul Body Gems as Kakortokite; they do not establish a laboratory identification or an exact mine for each photographed piece.
Metaphysical Meaning
For personal spiritual practice, Kakortokite can serve as a symbol of balance and connection: contrasting mineral components coming together in one stone. Its varied colors can inspire grounding, reflection and a sense of wholeness. These are symbolic associations and personal interpretations, separate from its geological identification.


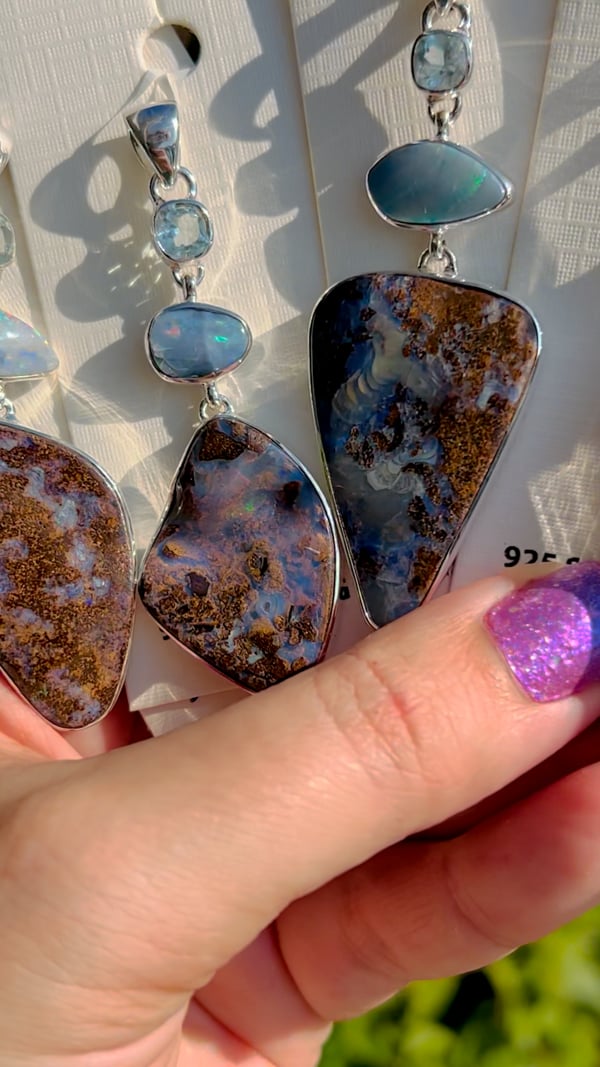
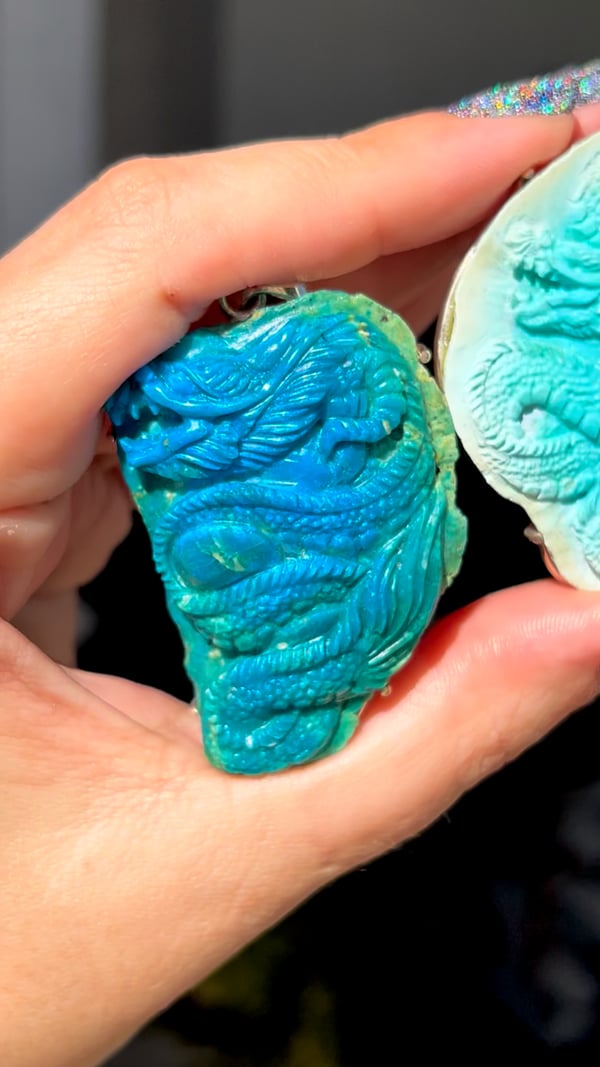


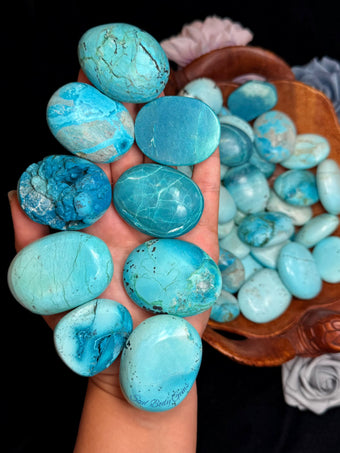

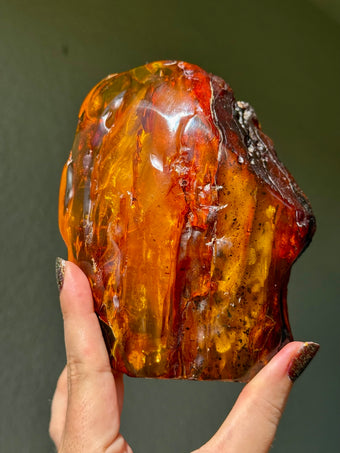


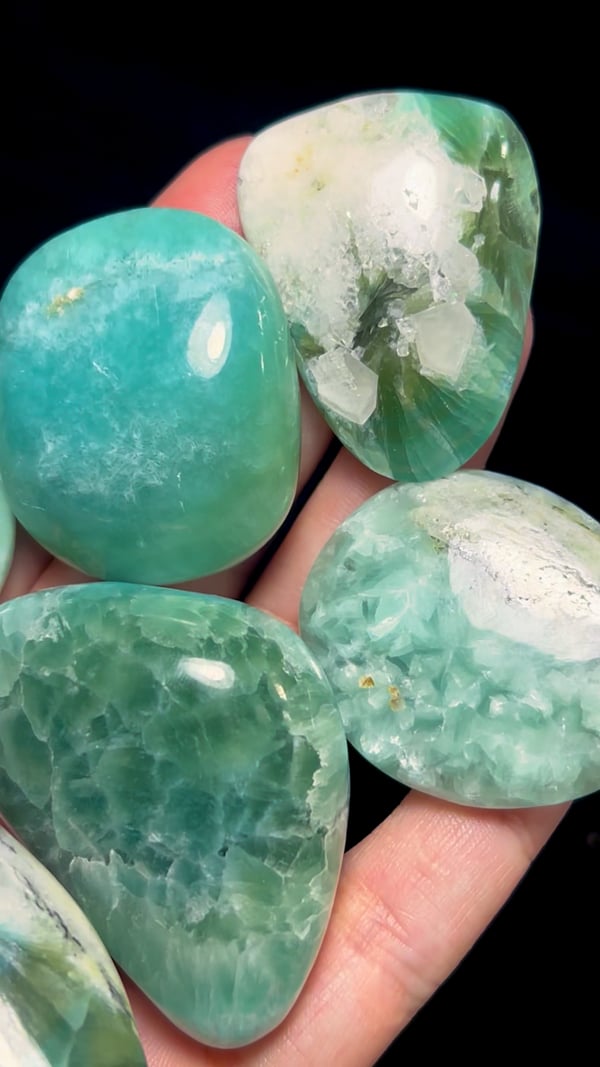


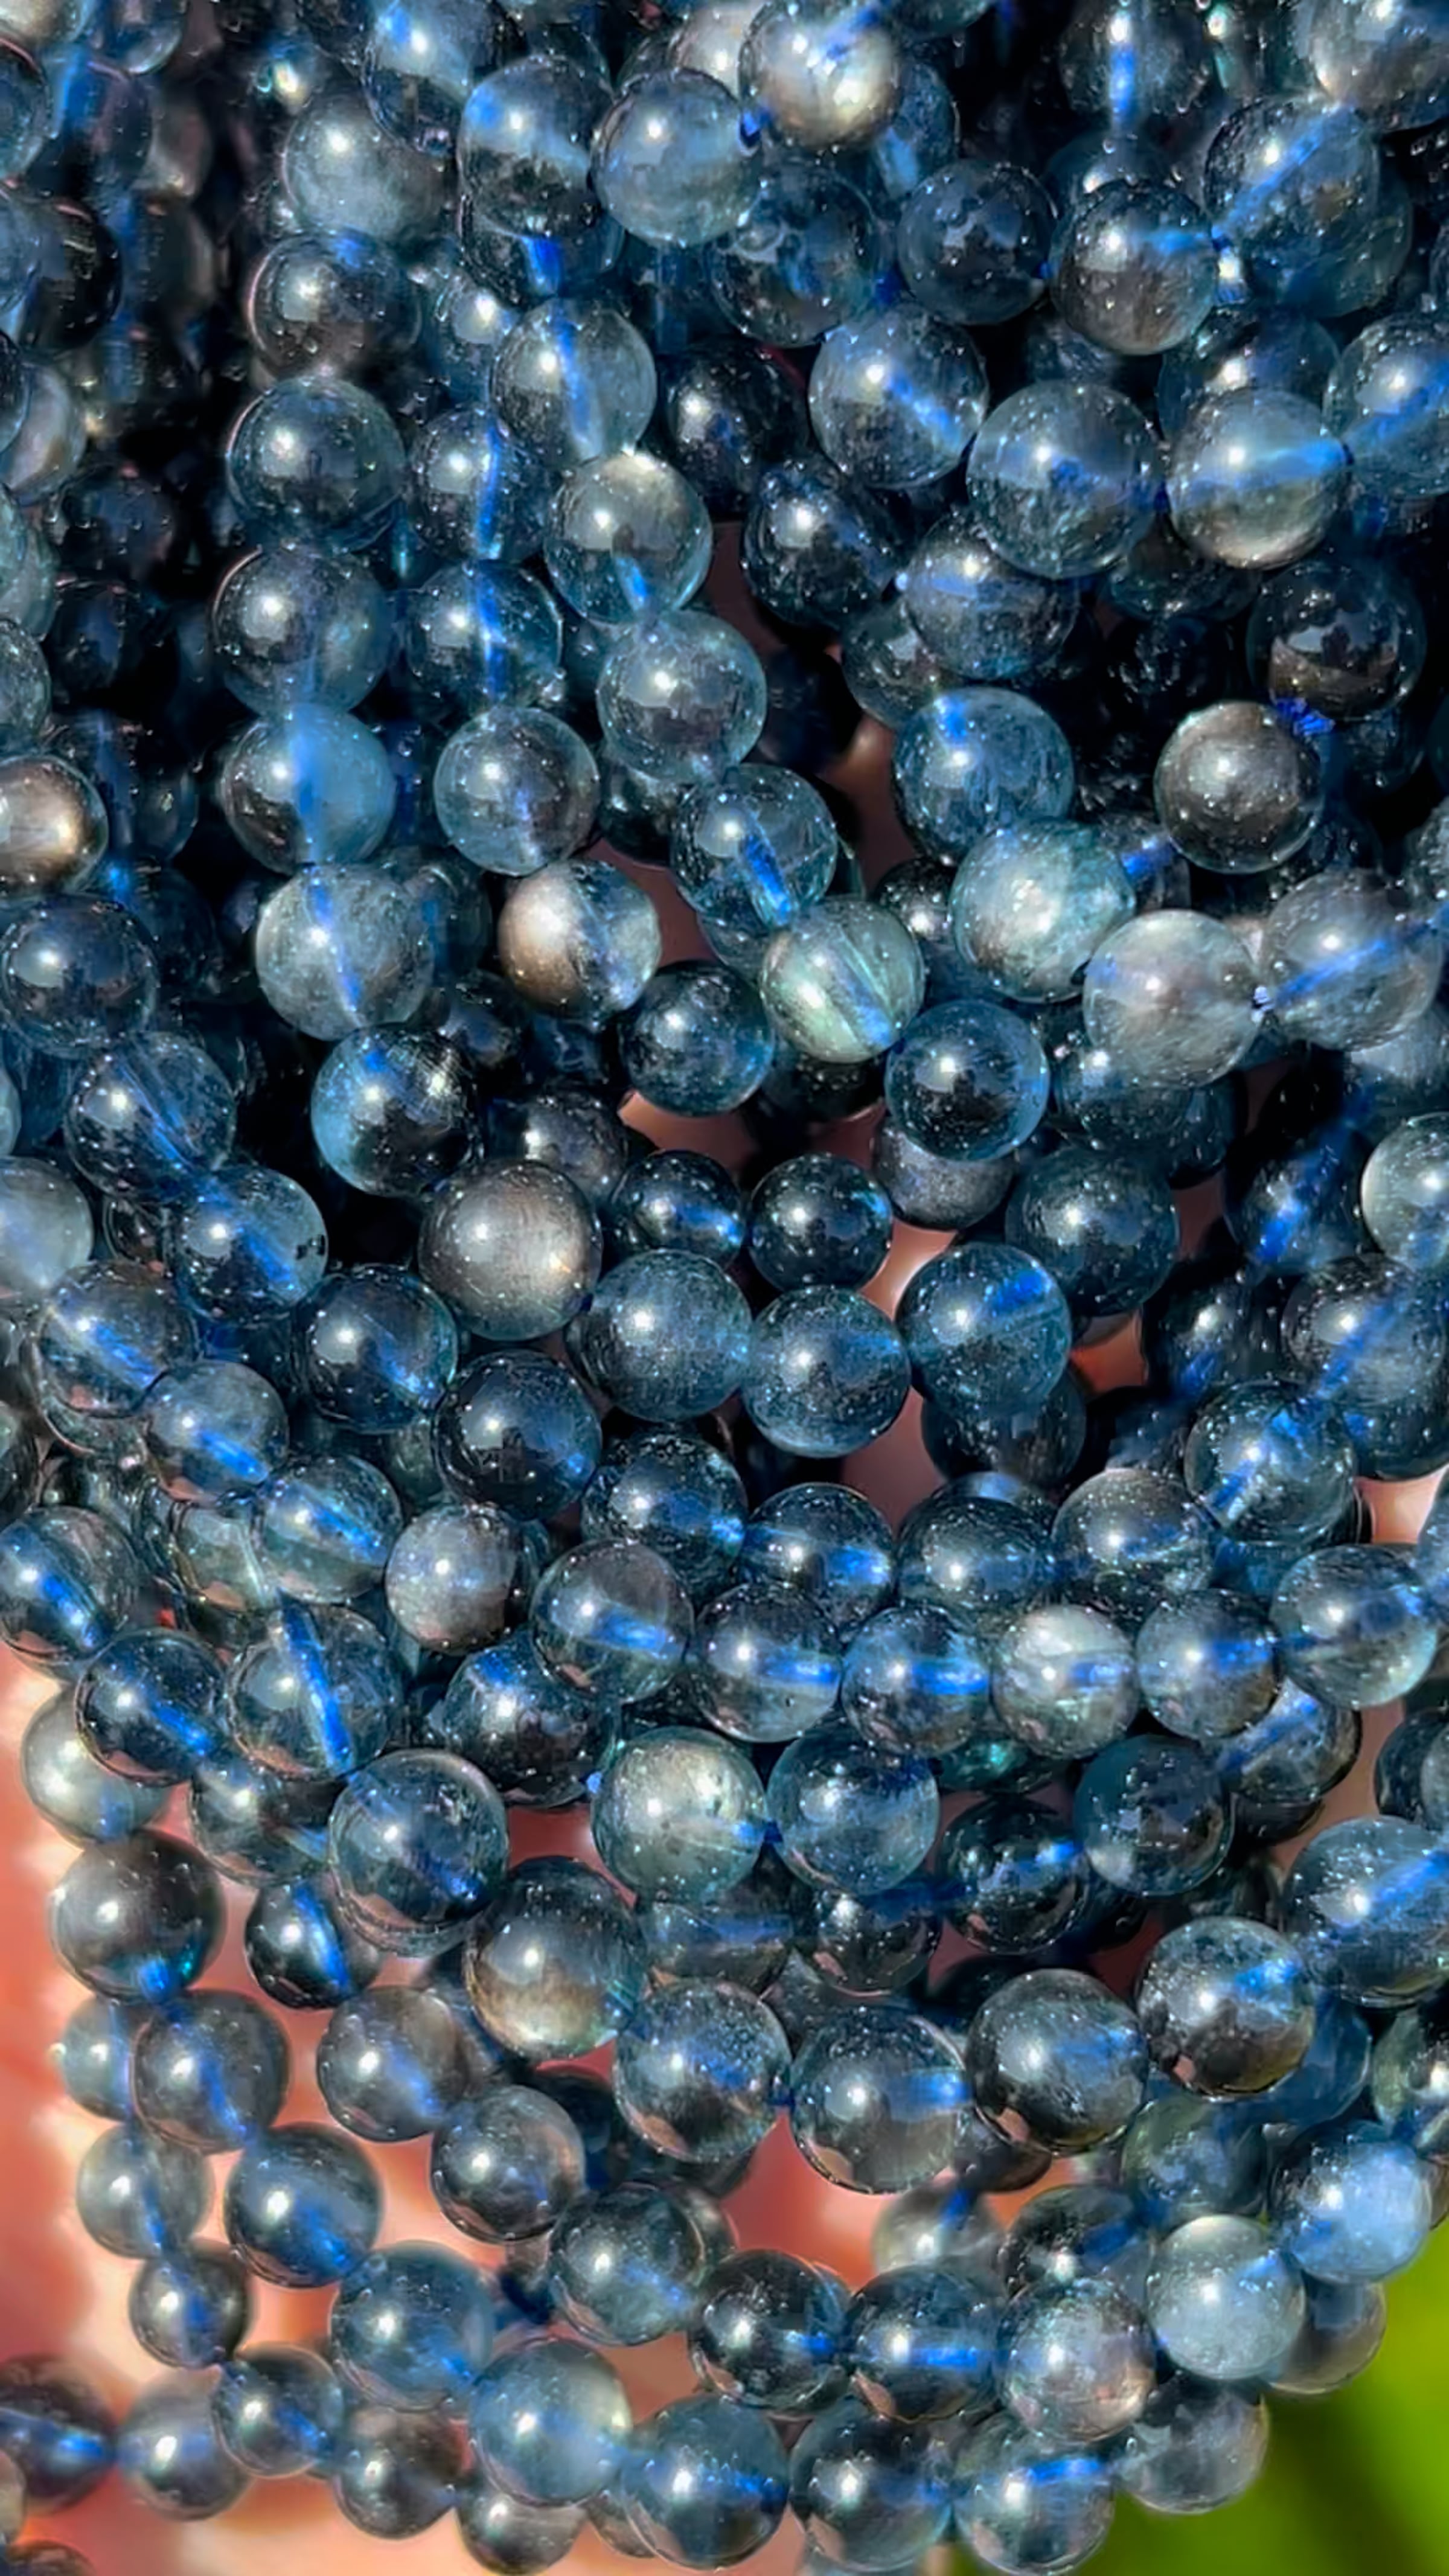


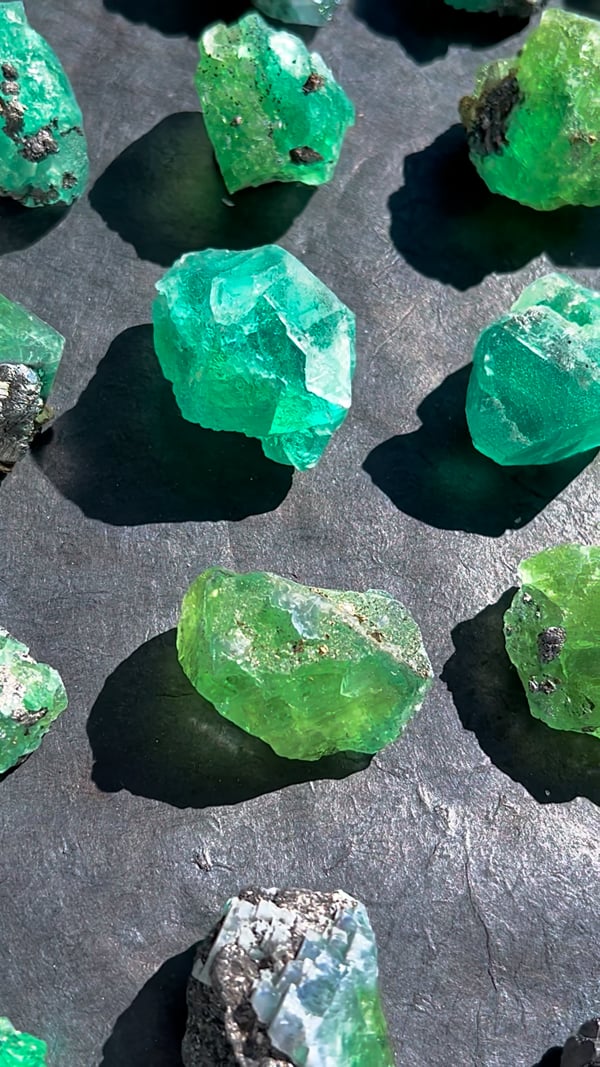

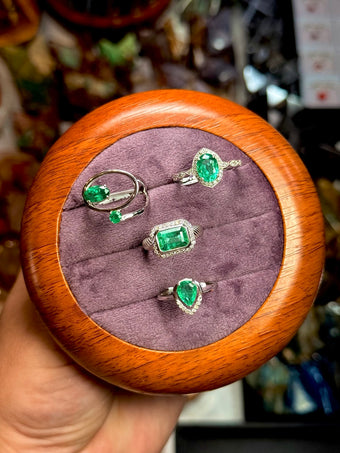


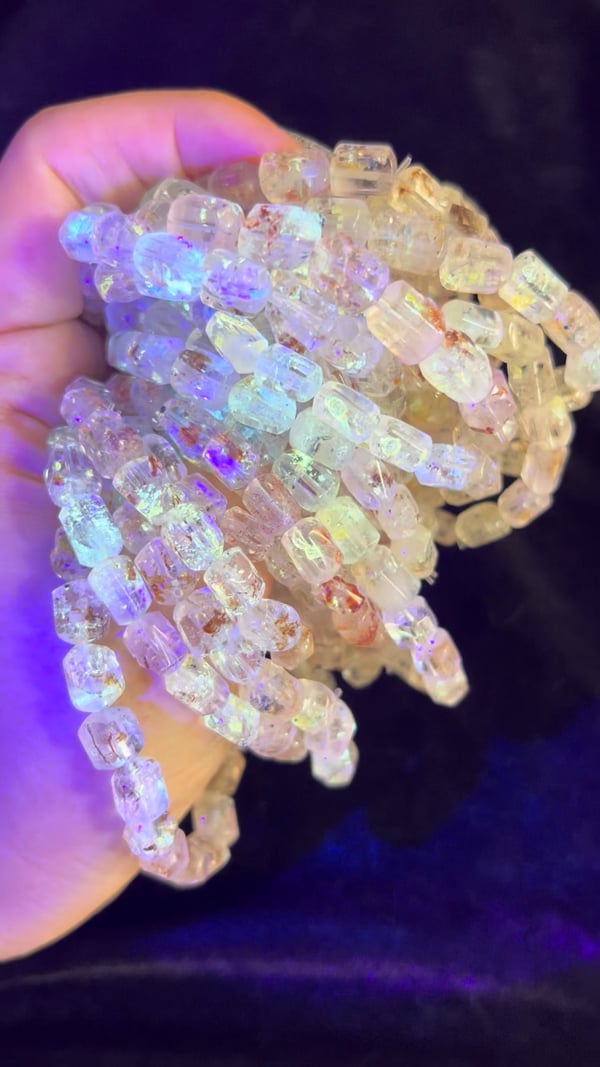


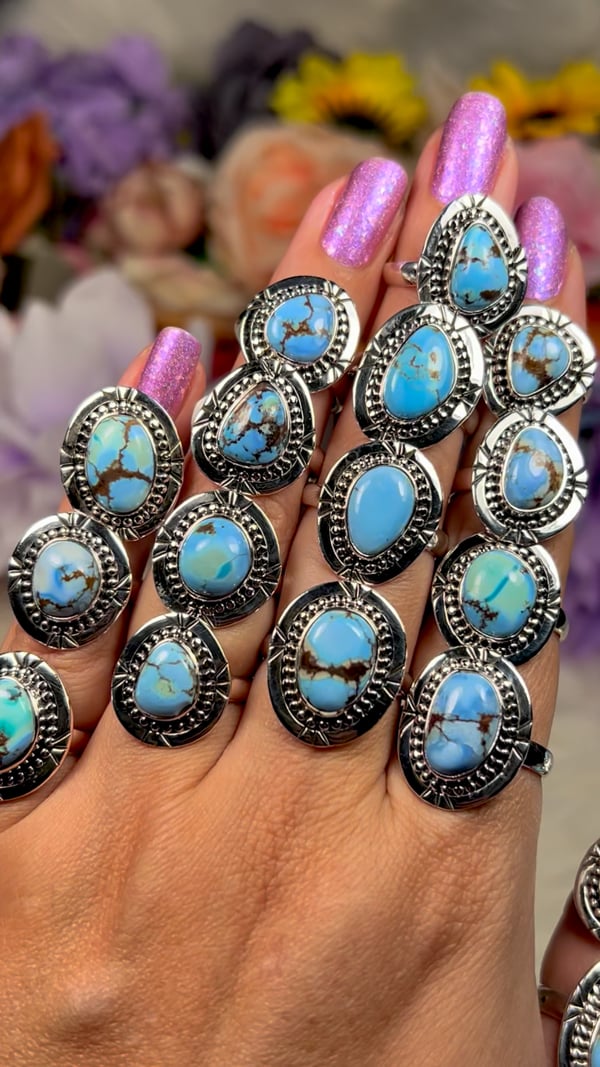


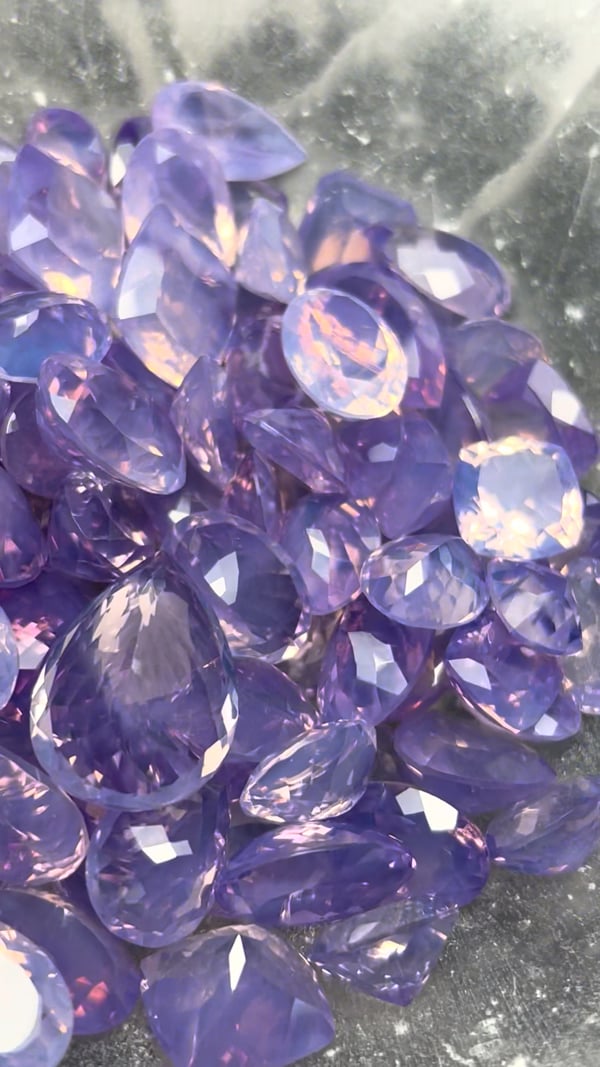


 AI illustration · not the tested specimen